stars so that we can understand how star and planet formation proceed in time. Age is not a direct observable. Mass is sometimes a direct observable, but only in rare eclipsing binary systems or resolved gas disk systems.
stars so that we can understand how star and planet formation proceed in time. Age is not a direct observable. Mass is sometimes a direct observable, but only in rare eclipsing binary systems or resolved gas disk systems.
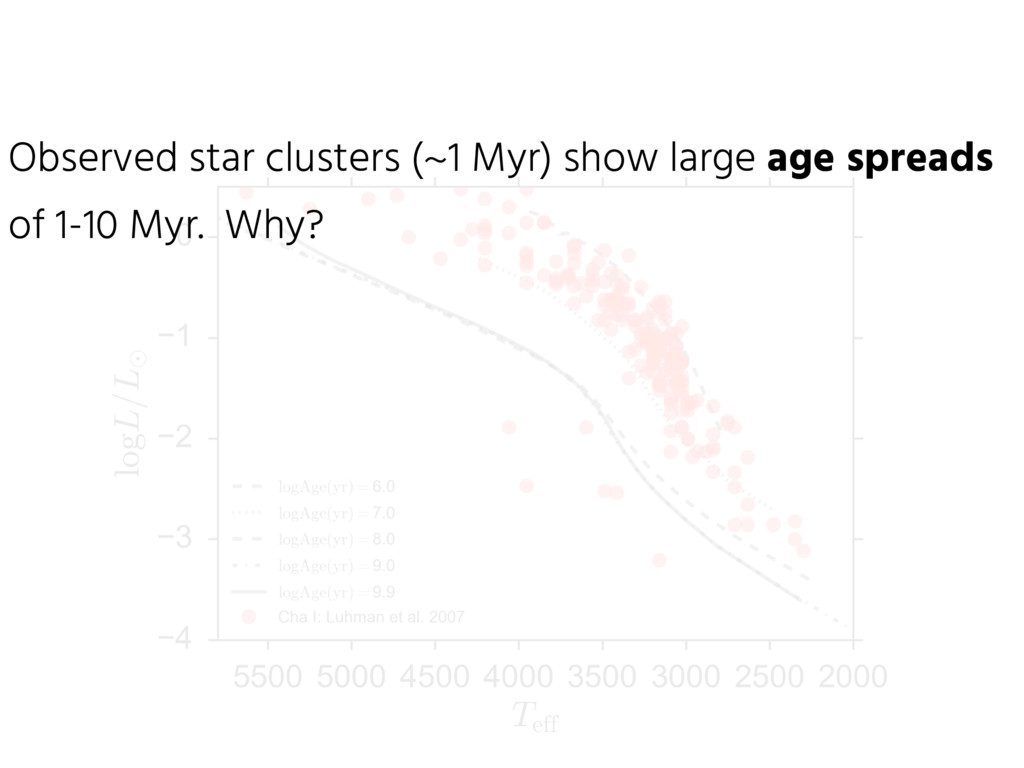
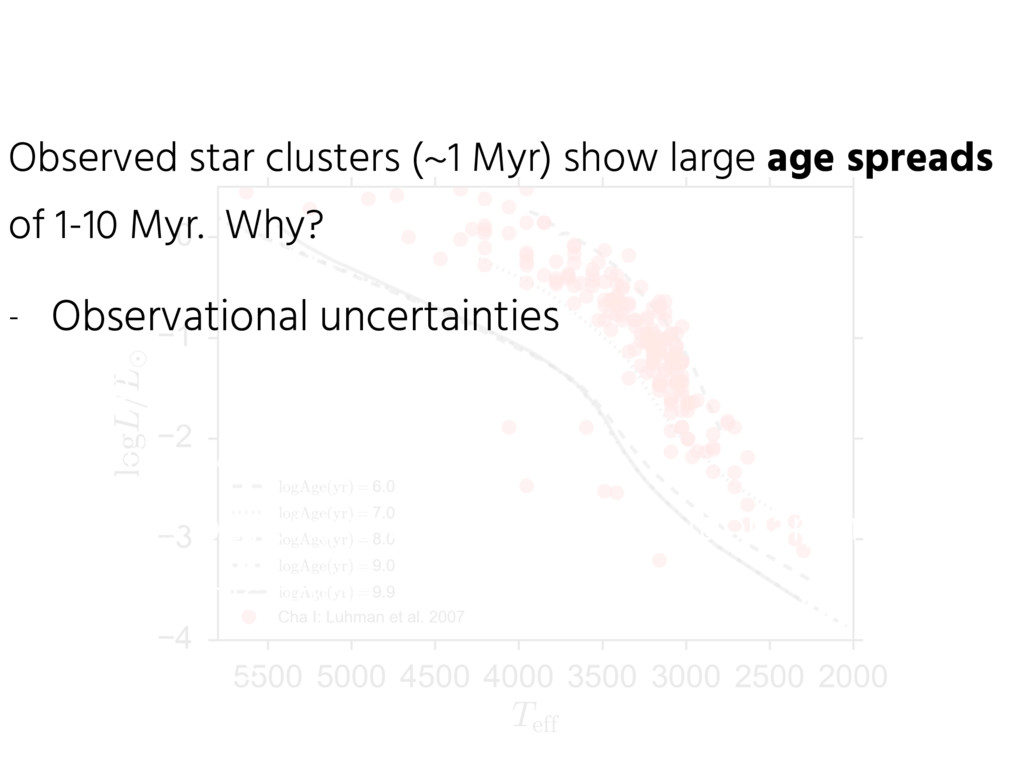
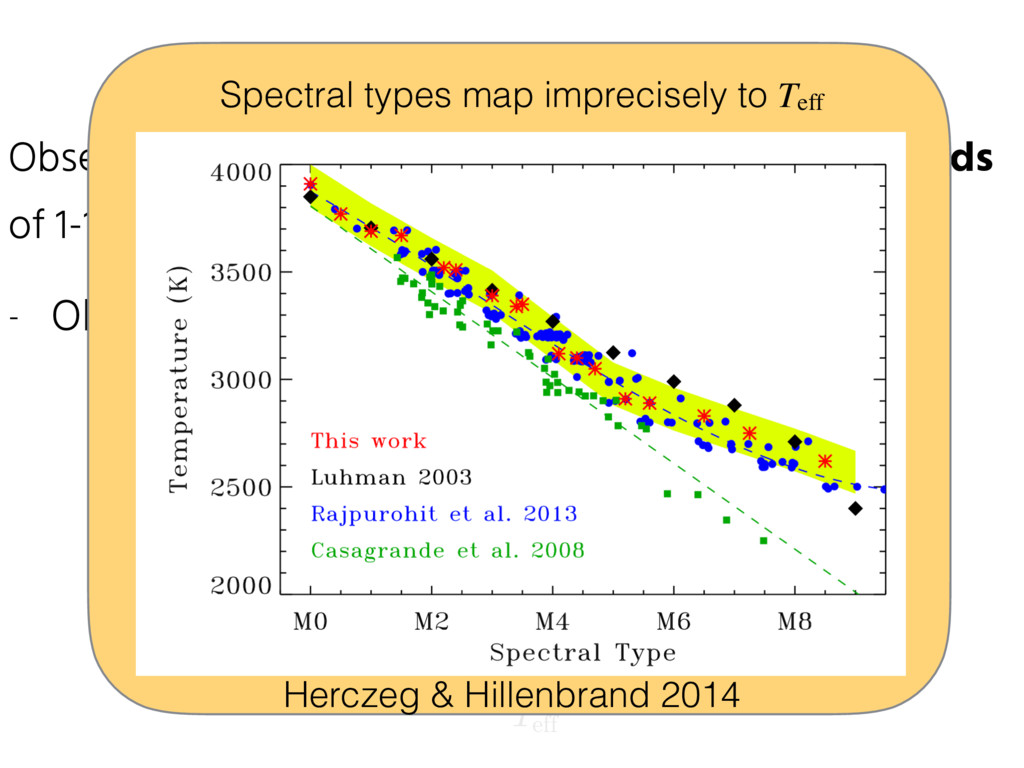
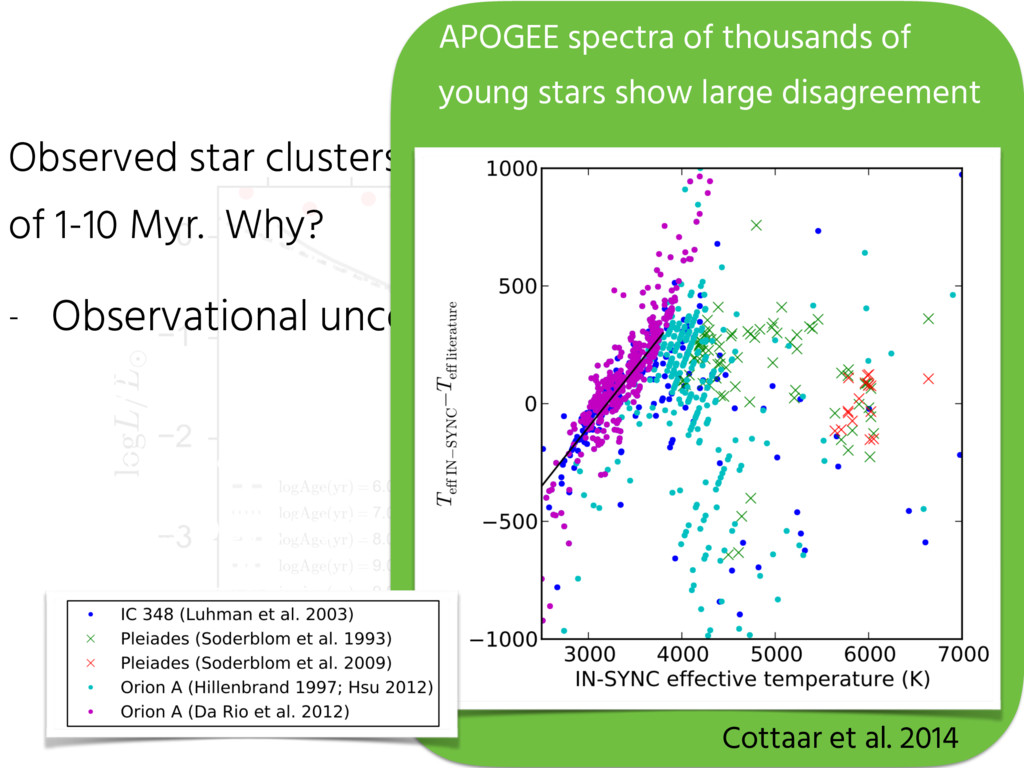
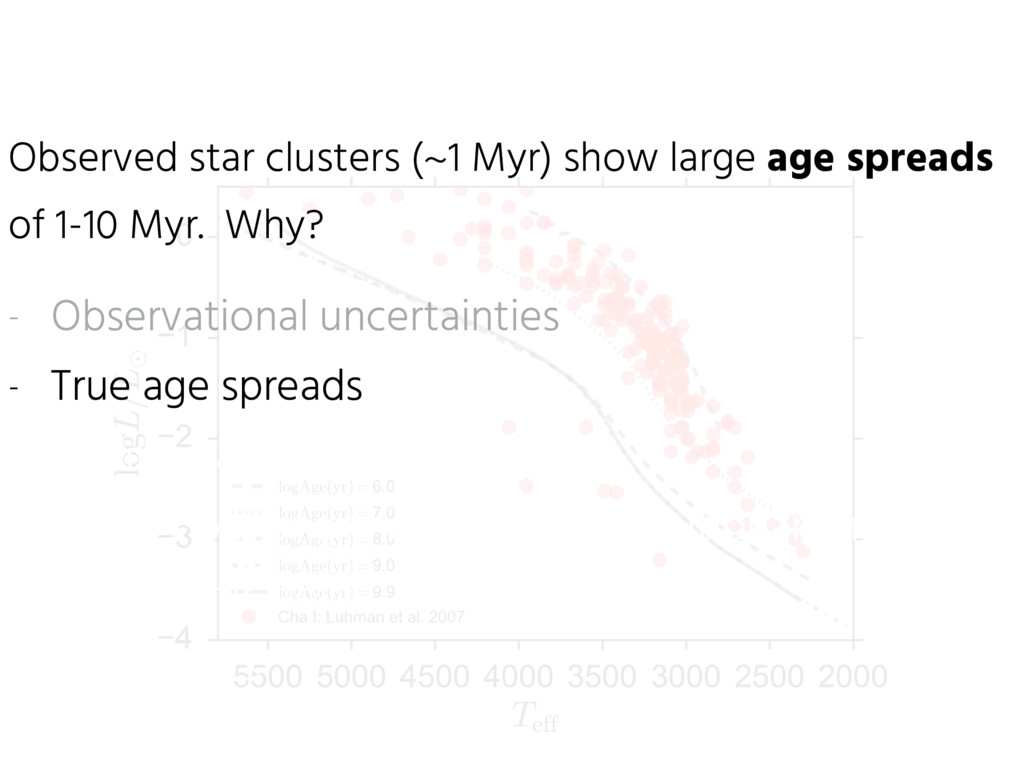
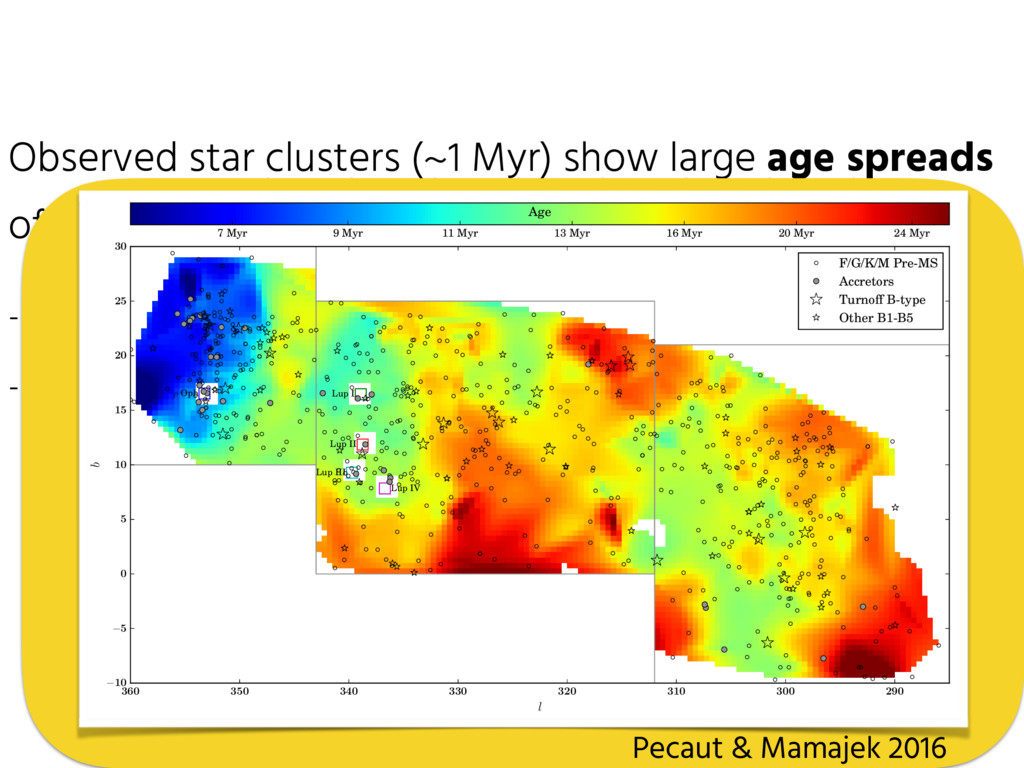
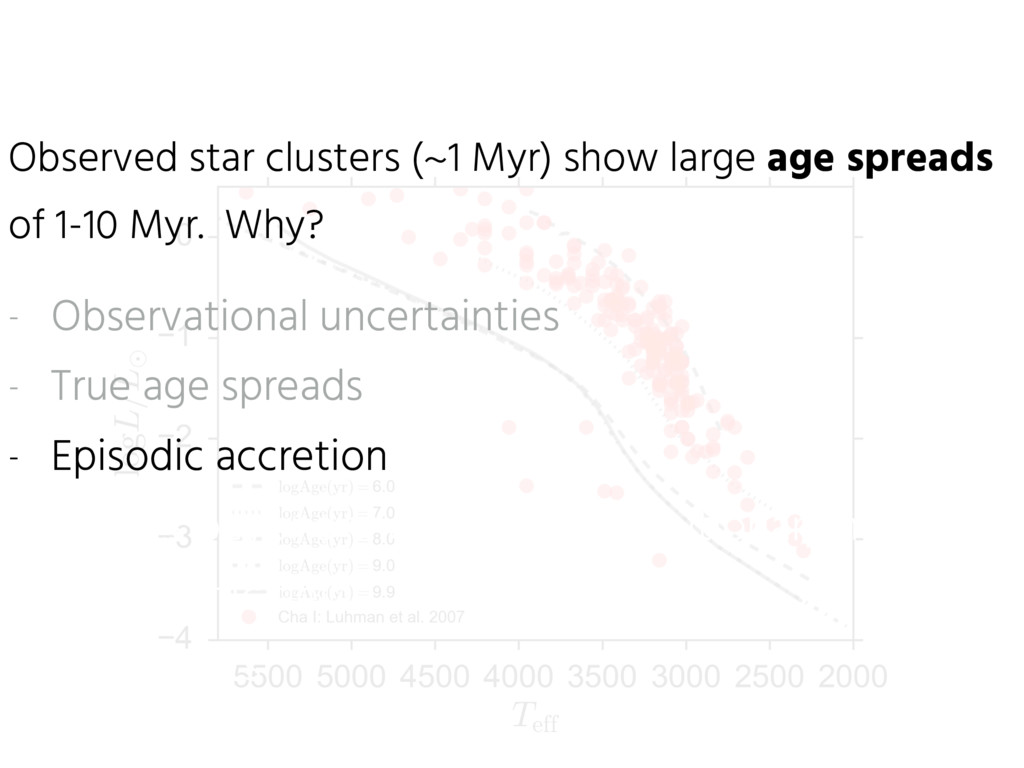
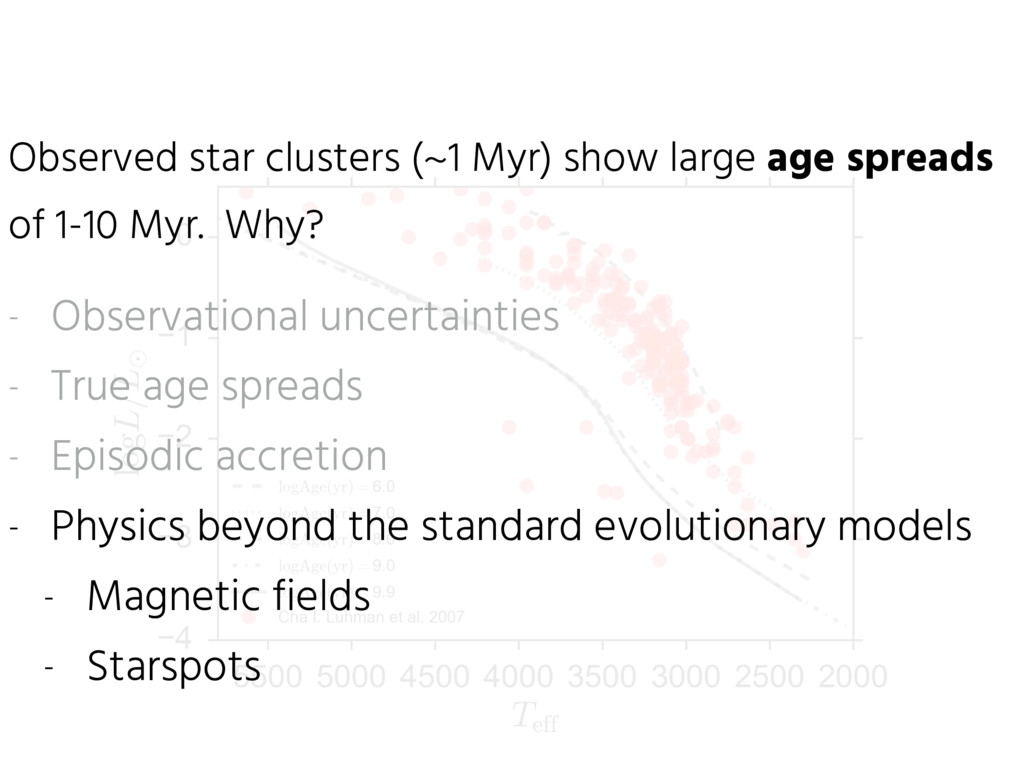
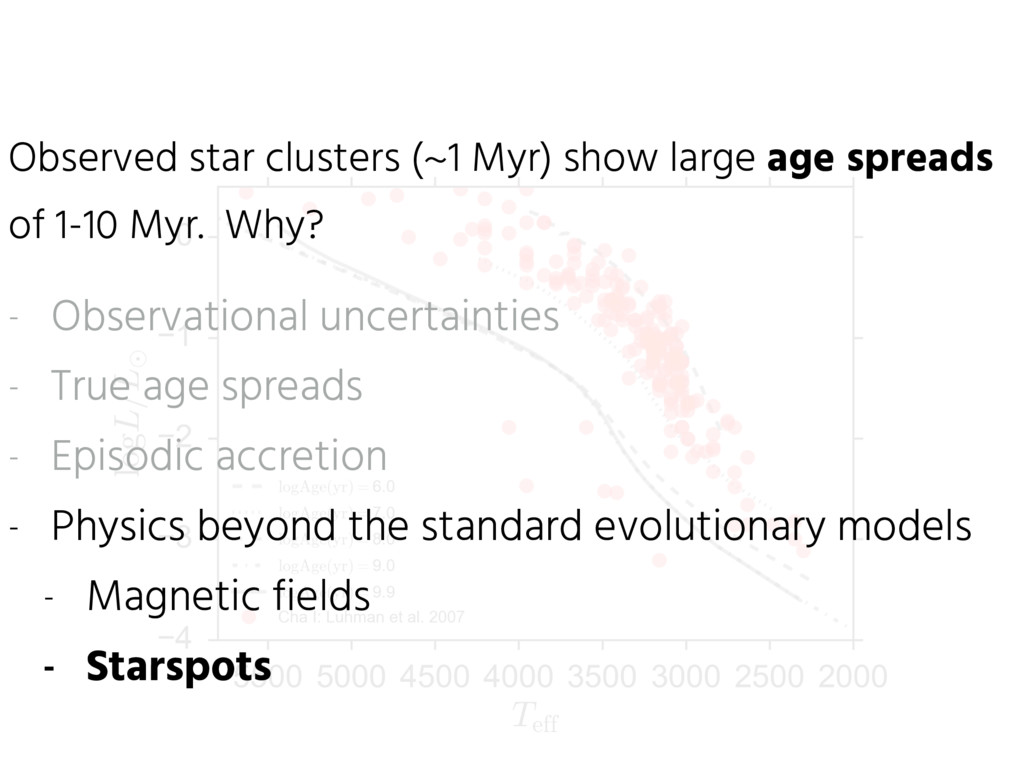
1-10 Myr. Why? - Observational uncertainties - True age spreads - Episodic accretion - Physics beyond the standard evolutionary models - Magnetic fields - Starspots APOGEE spectra of thousands of young stars show large disagreement Cottaar et al. 2014
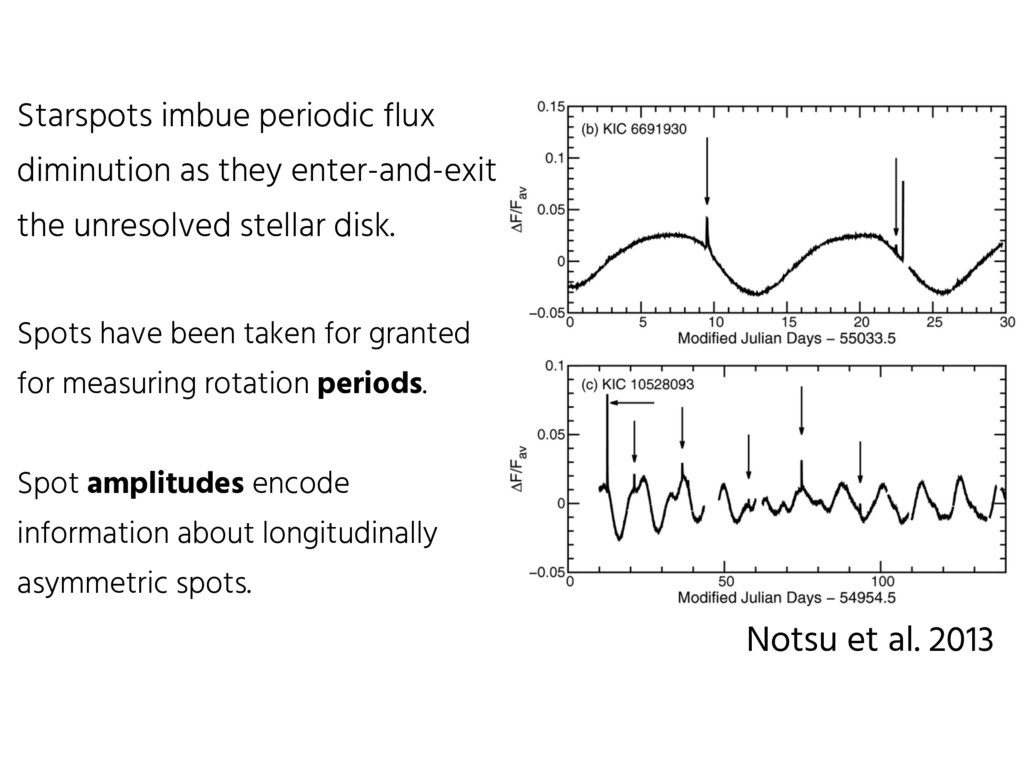
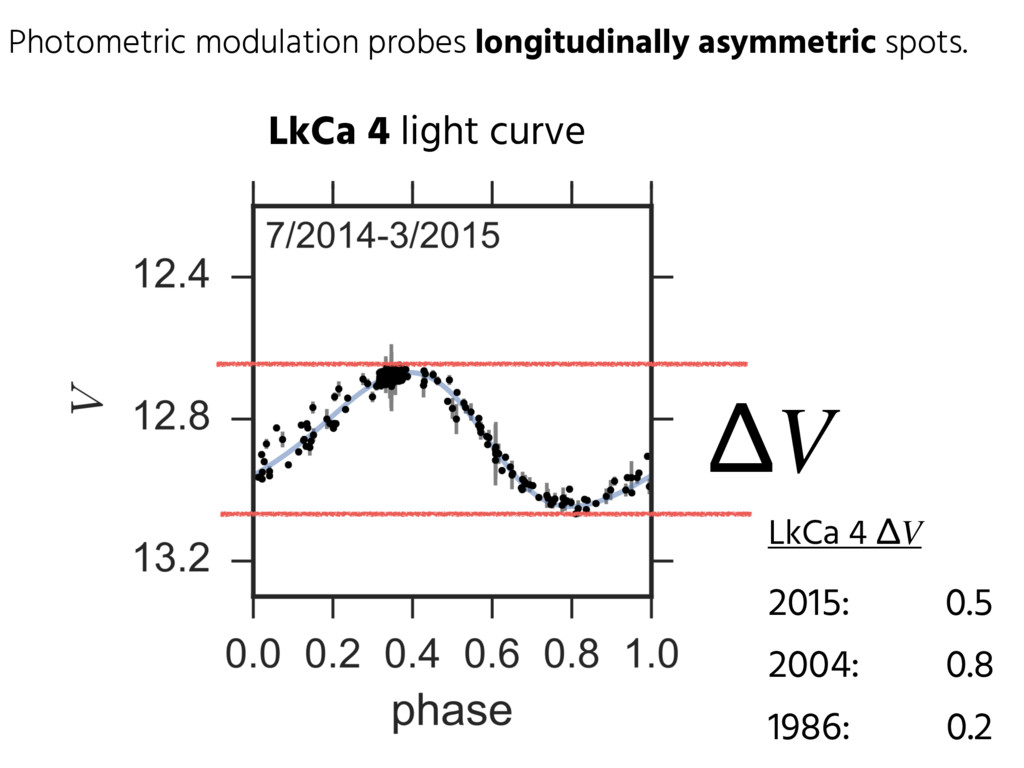
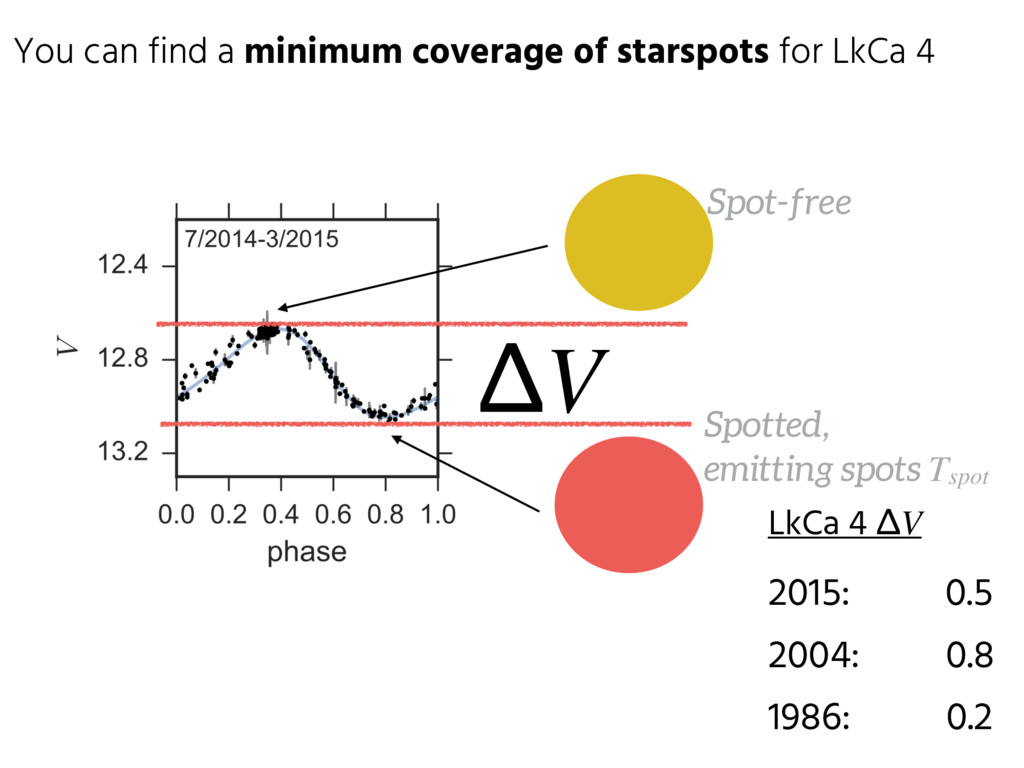
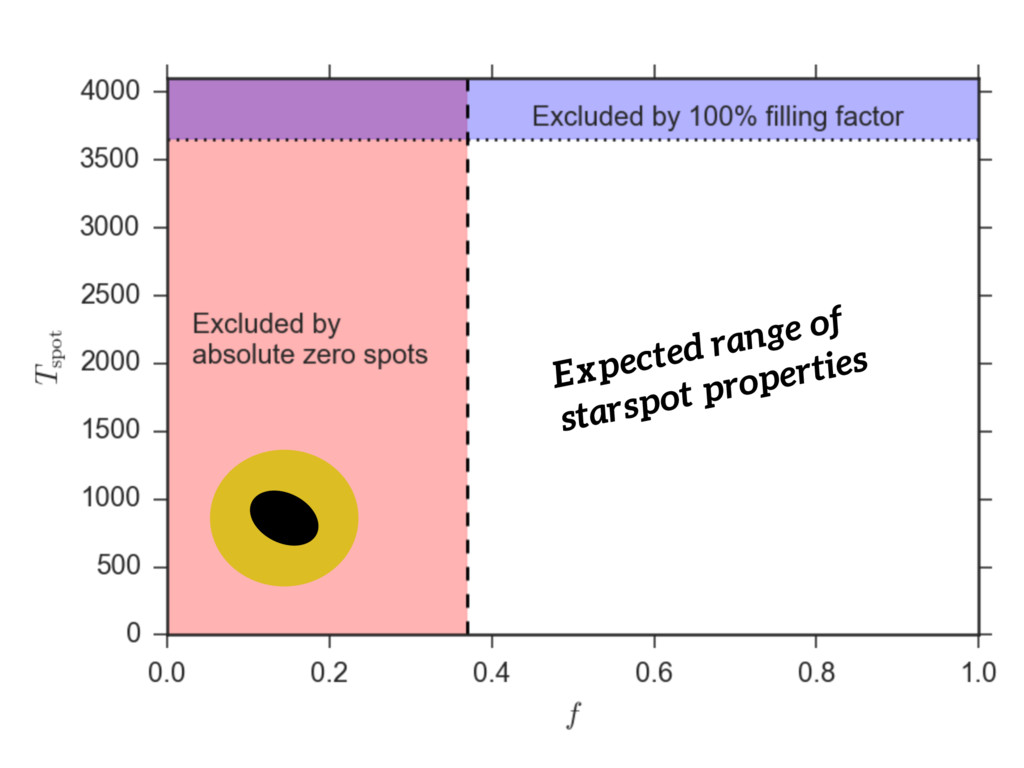
stellar disk. Spots have been taken for granted for measuring rotation periods. Spot amplitudes encode information about longitudinally asymmetric spots. Notsu et al. 2013
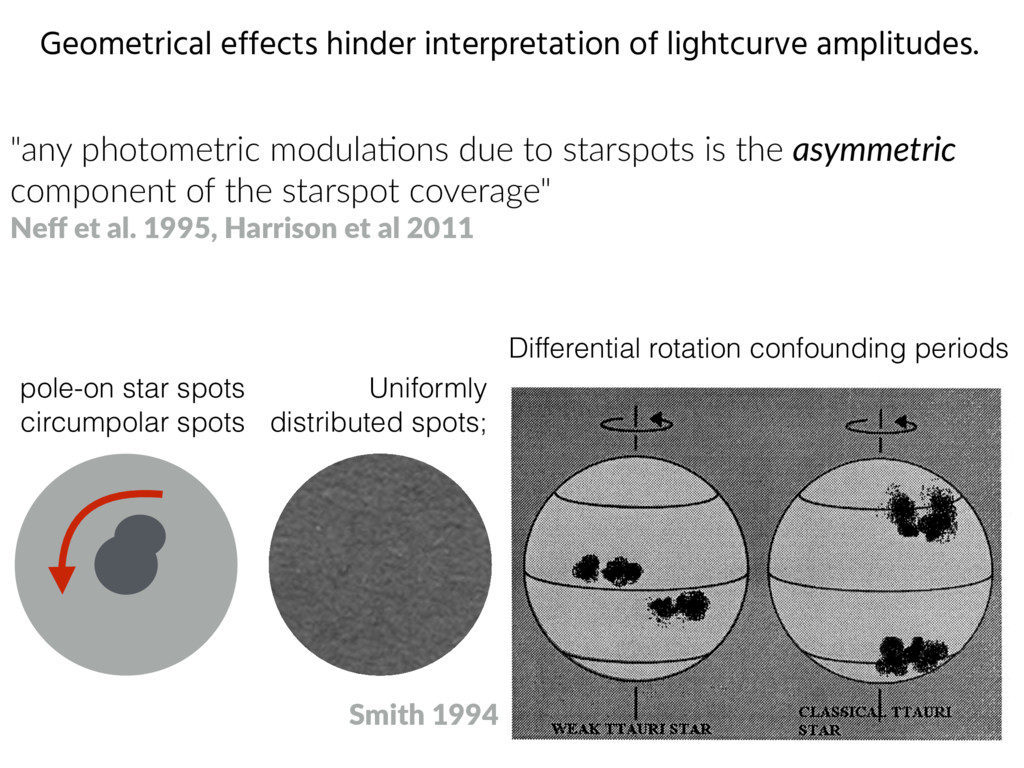
component of the starspot coverage" Neff et al. 1995, Harrison et al 2011 Smith 1994 Uniformly distributed spots; pole-on star spots circumpolar spots Differential rotation confounding periods Geometrical effects hinder interpretation of lightcurve amplitudes.
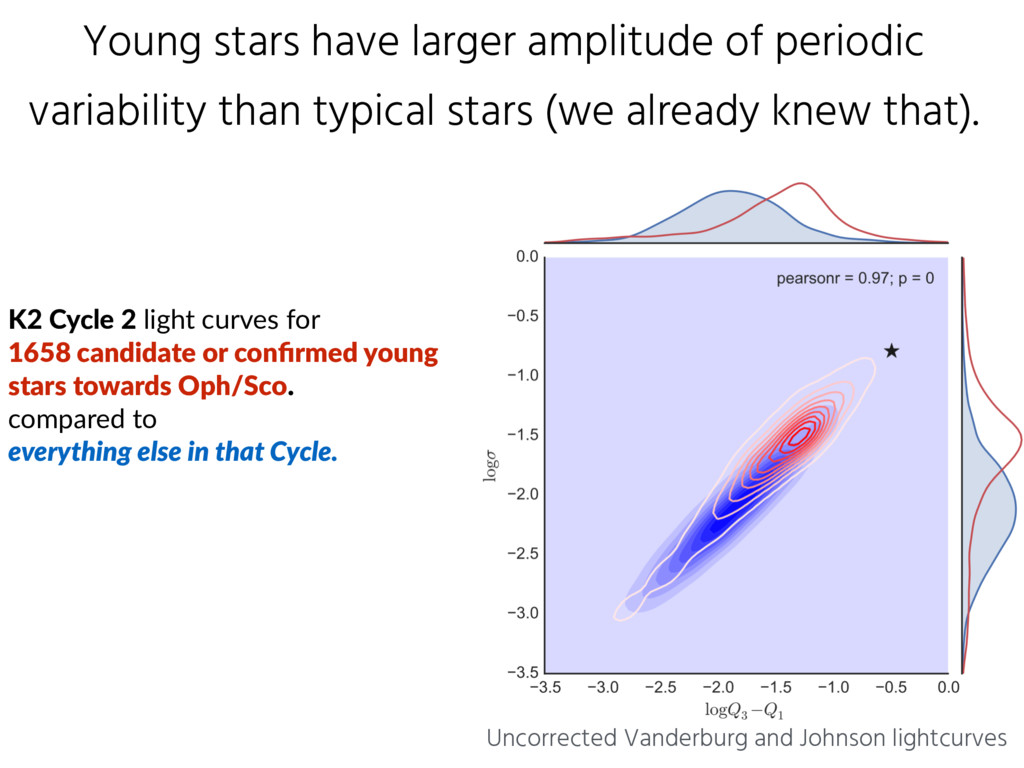
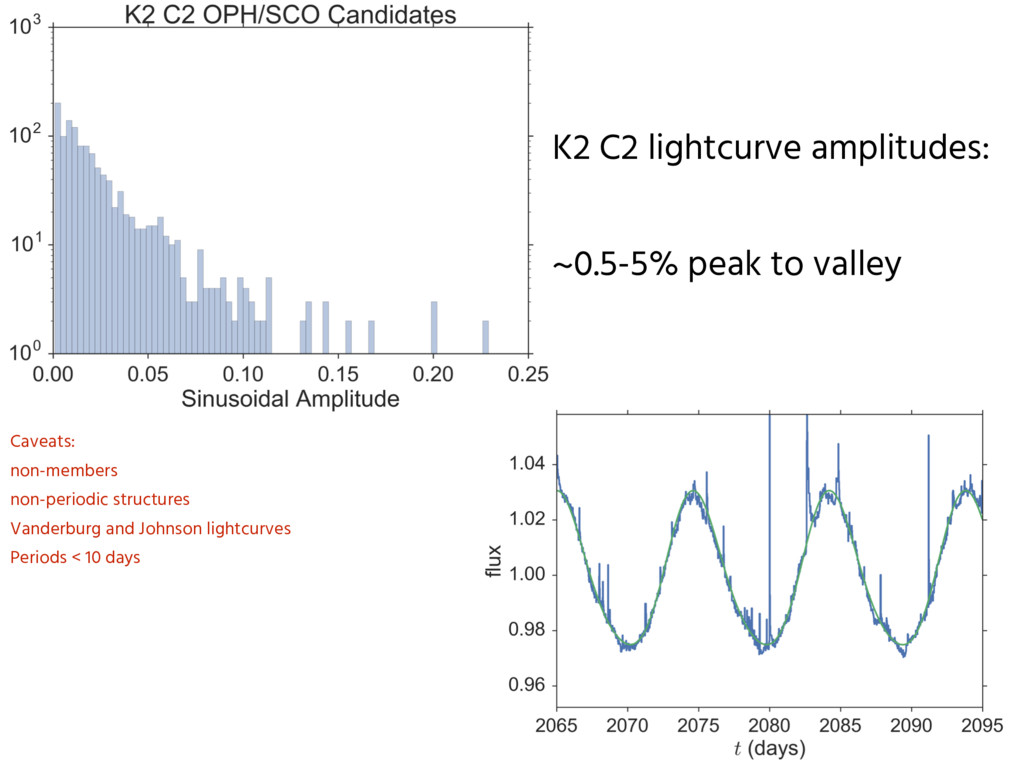
stars (we already knew that). K2 Cycle 2 light curves for 1658 candidate or confirmed young stars towards Oph/Sco. compared to everything else in that Cycle. Uncorrected Vanderburg and Johnson lightcurves
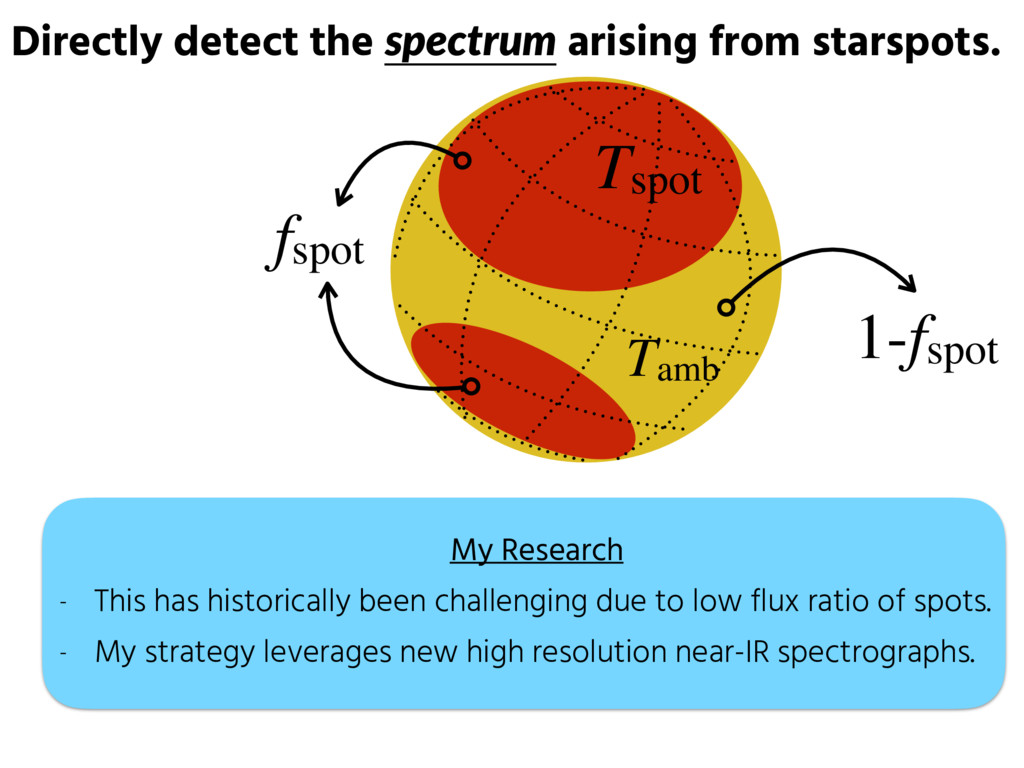
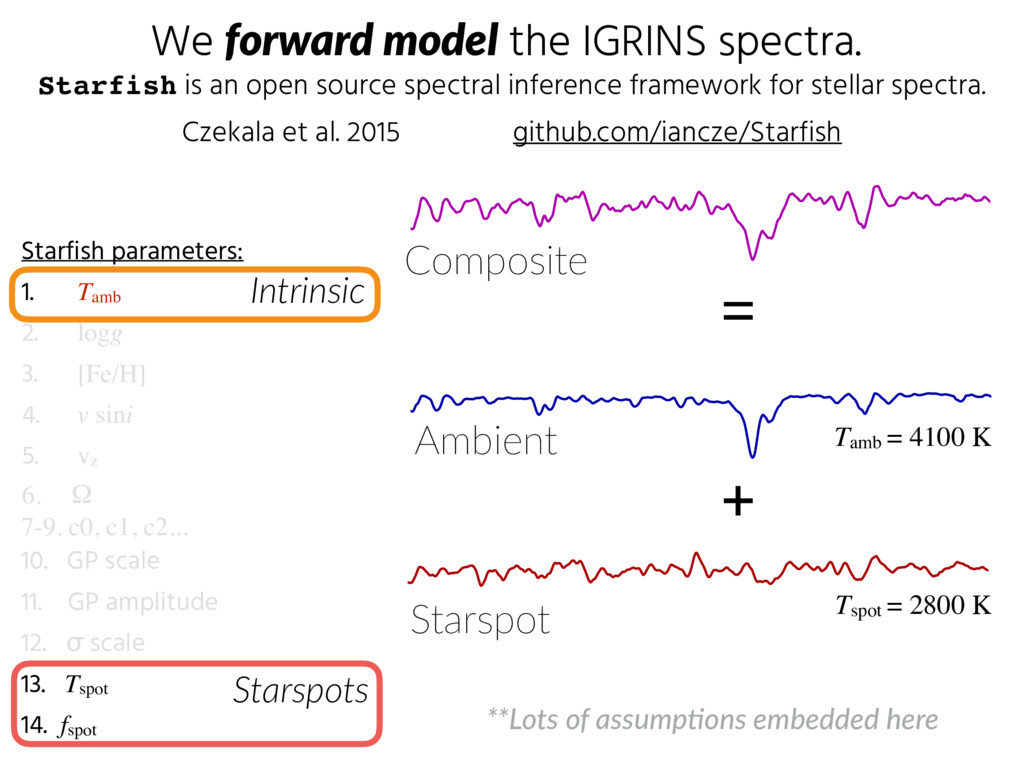
1-fspot My Research - This has historically been challenging due to low flux ratio of spots. - My strategy leverages new high resolution near-IR spectrographs.
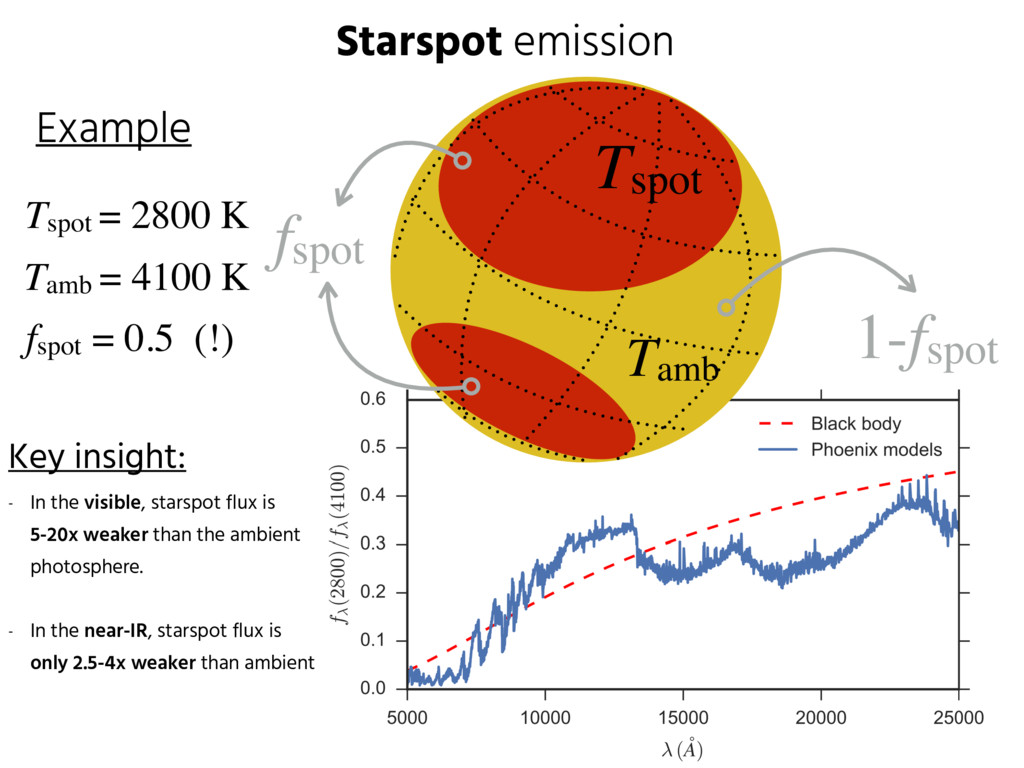
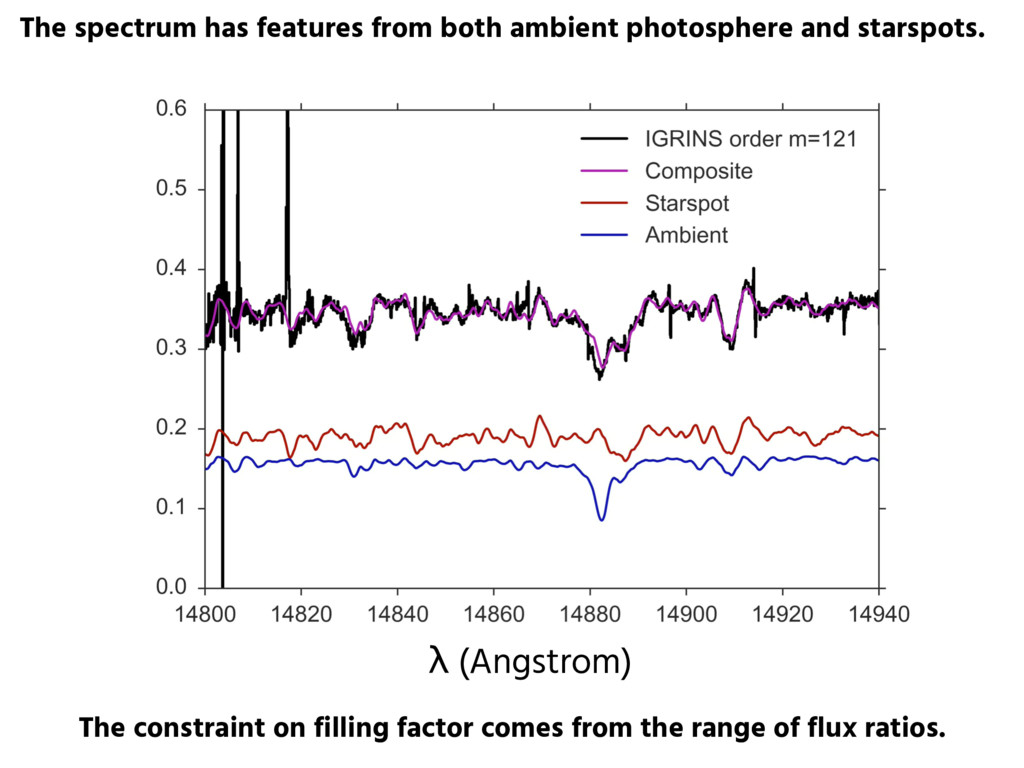
Tamb = 4100 K fspot = 0.5 (!) Example Key insight: - In the visible, starspot flux is 5-20x weaker than the ambient photosphere. - In the near-IR, starspot flux is only 2.5-4x weaker than ambient
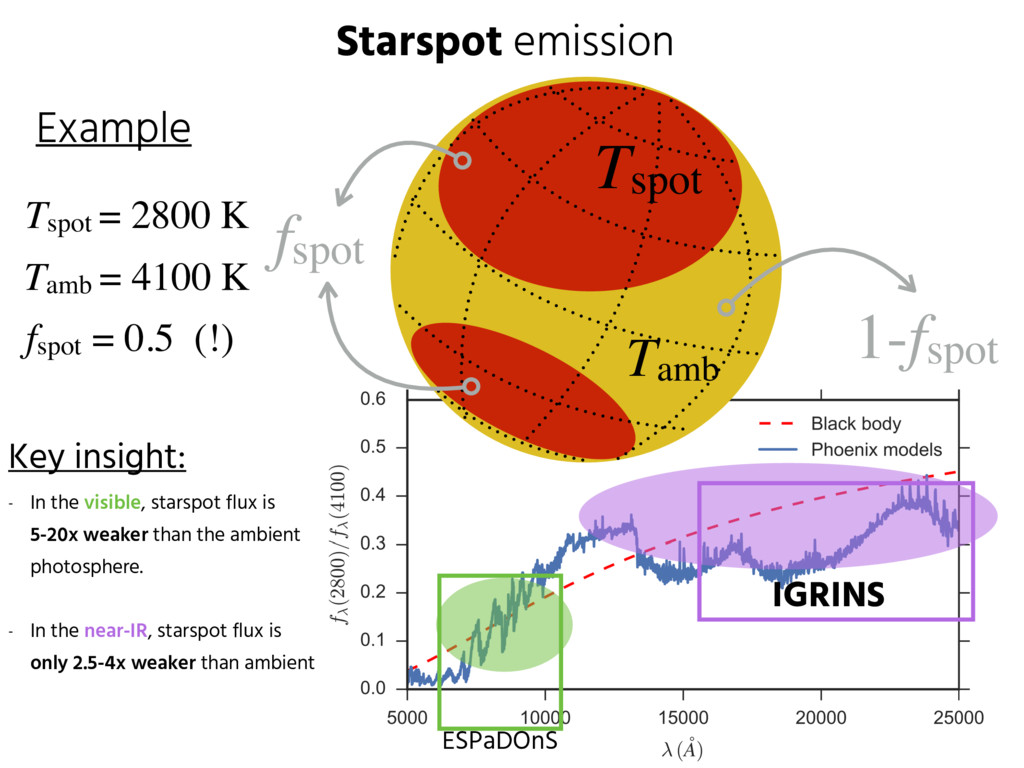
Tamb = 4100 K fspot = 0.5 (!) Example Key insight: - In the visible, starspot flux is 5-20x weaker than the ambient photosphere. - In the near-IR, starspot flux is only 2.5-4x weaker than ambient IGRINS ESPaDOnS
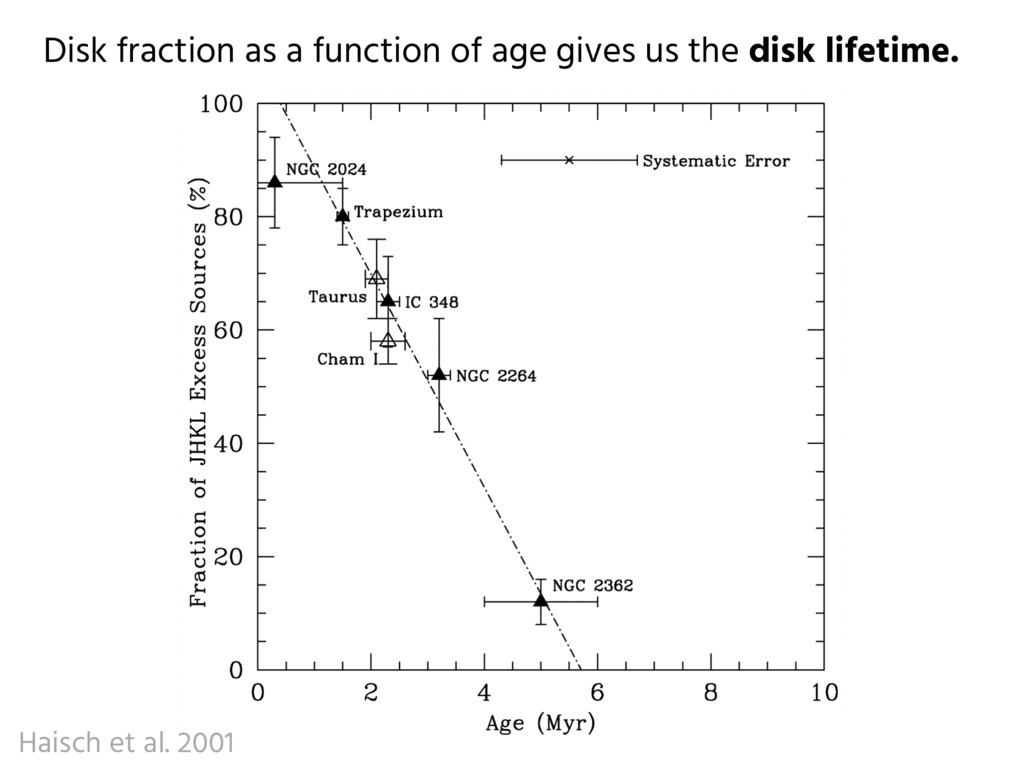
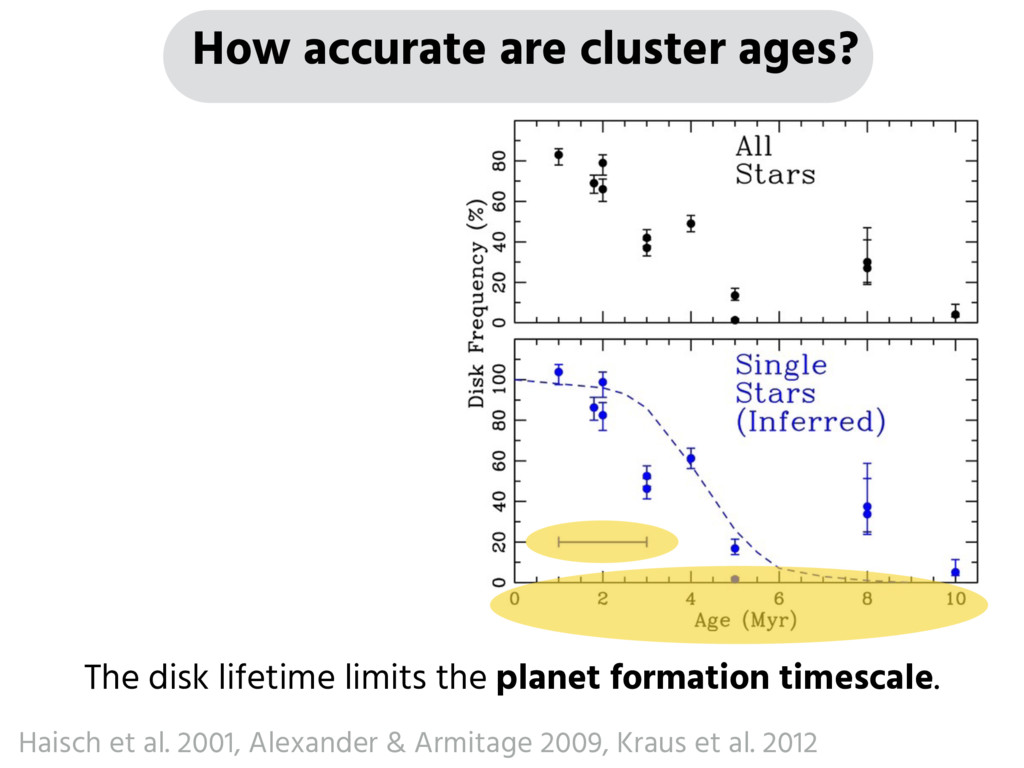
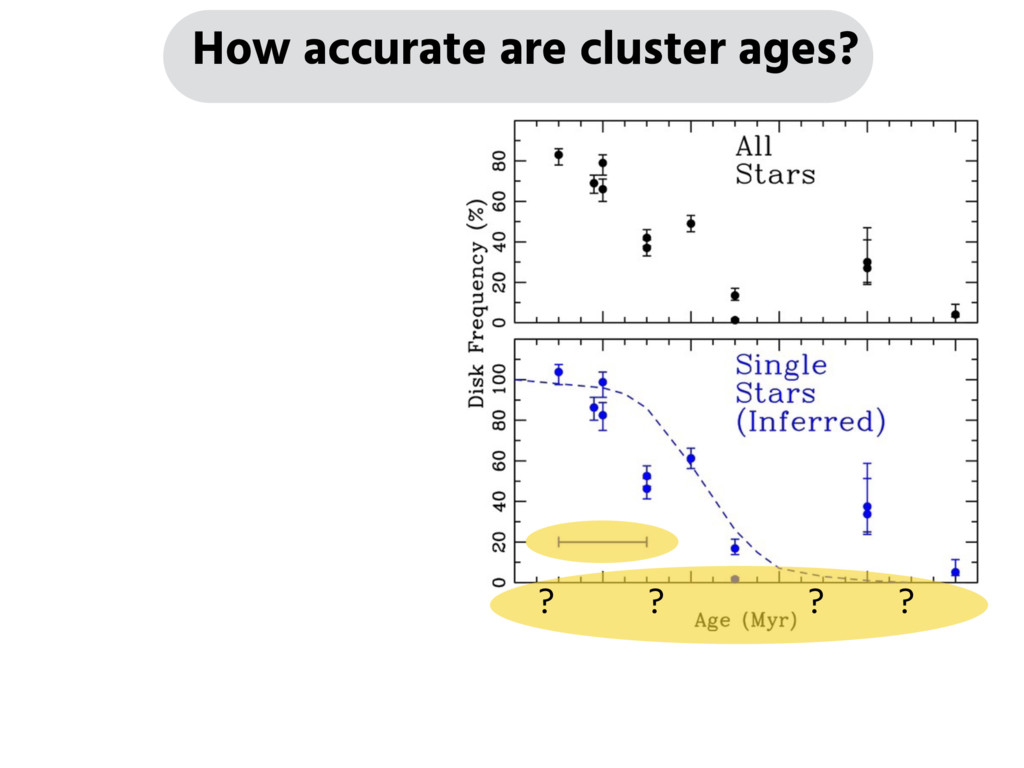
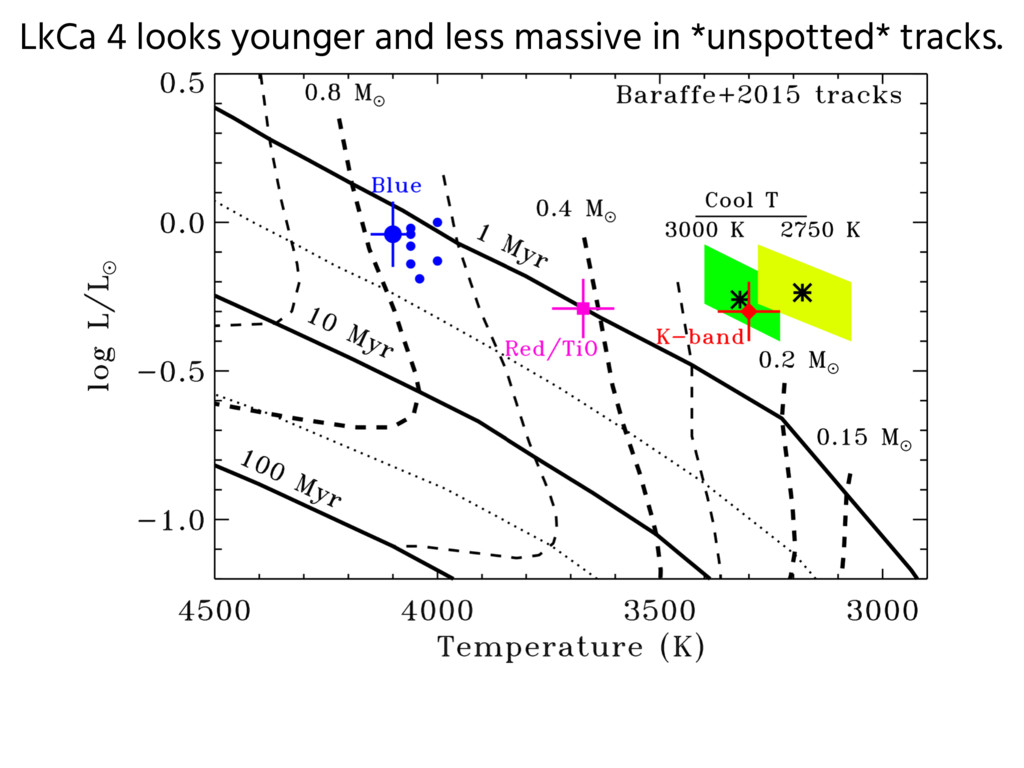
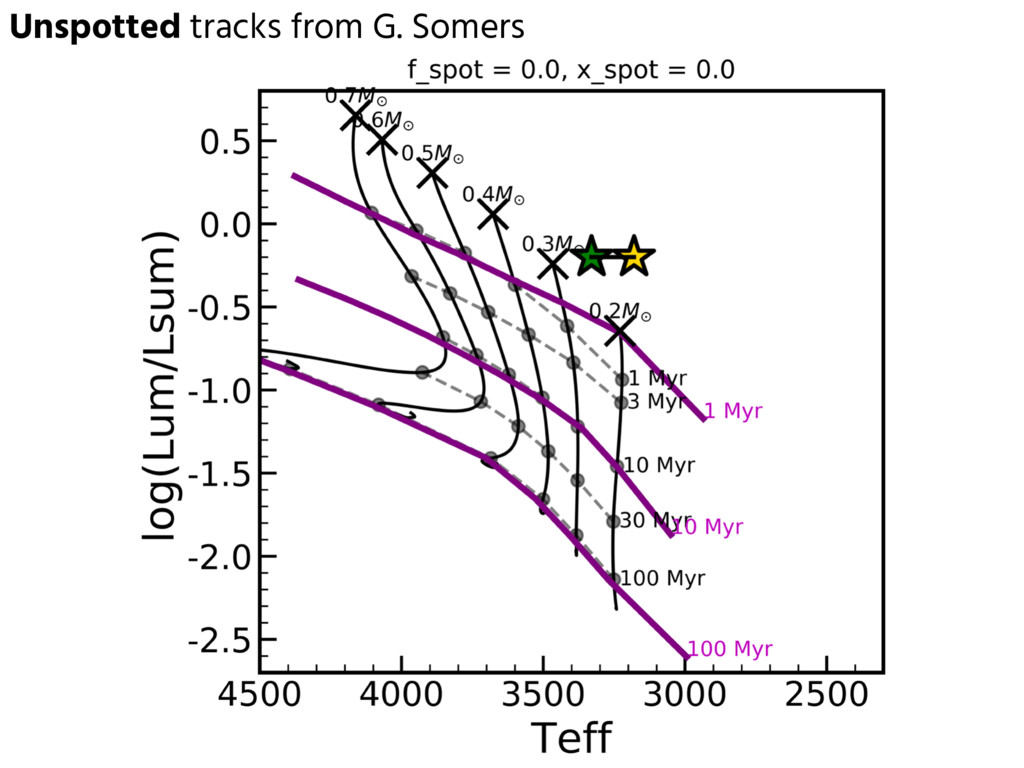
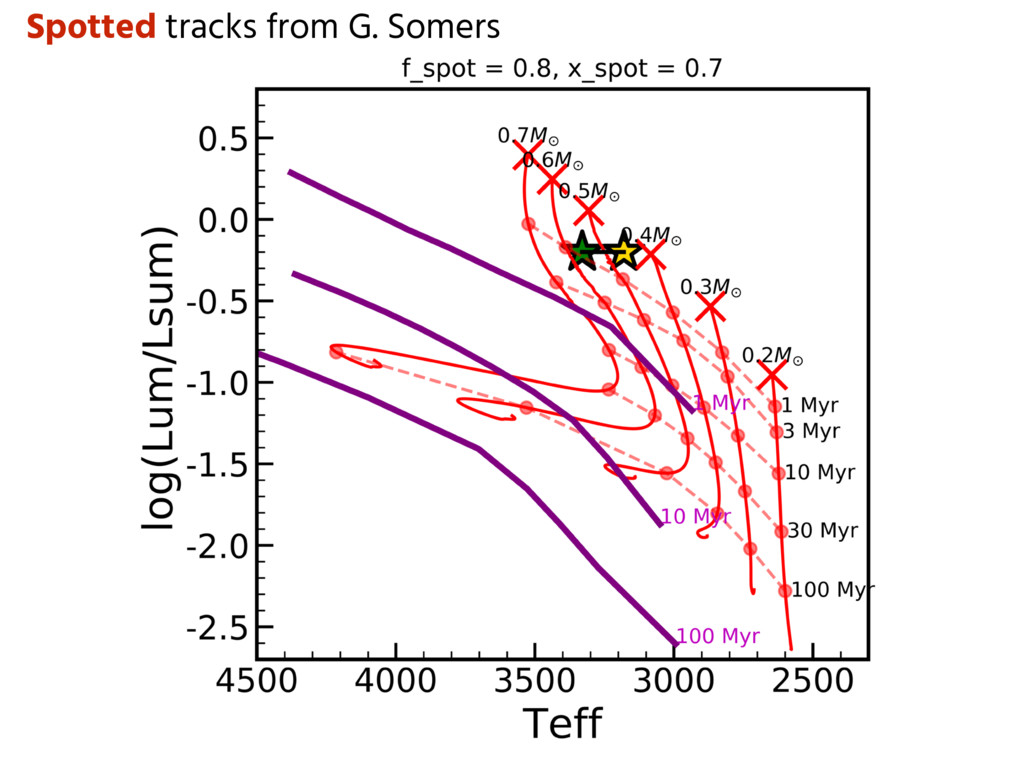
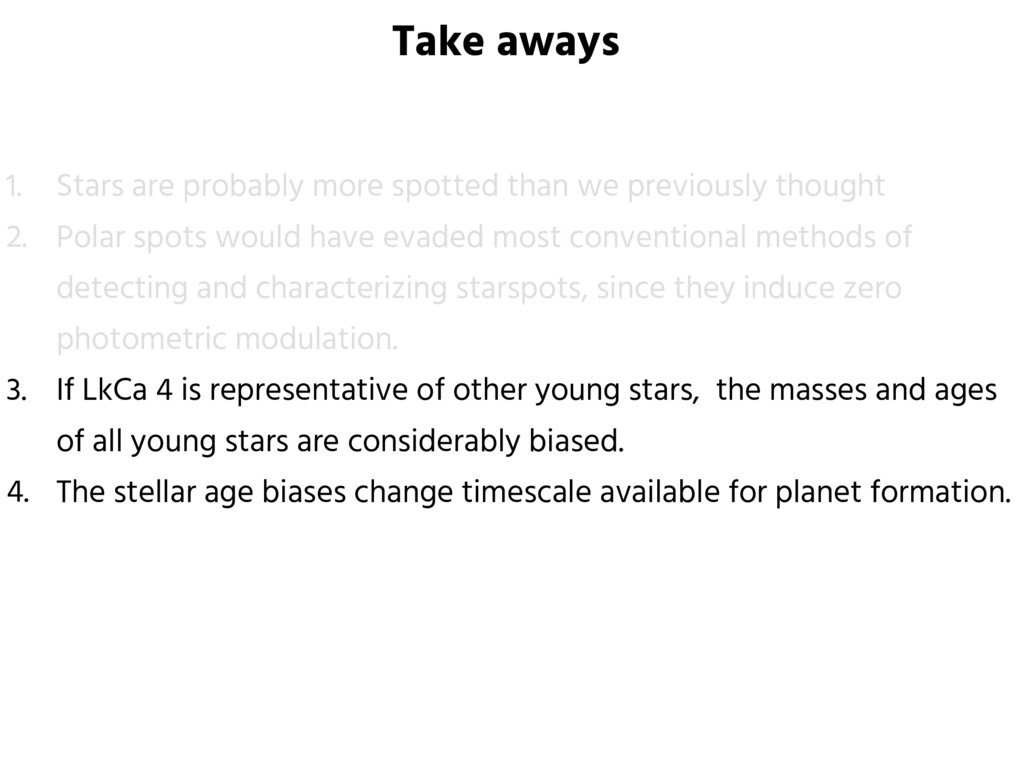
previously thought 2. Polar spots would have evaded most conventional methods of detecting and characterizing starspots, since they induce zero photometric modulation. 3. If LkCa 4 is representative of other young stars, the masses and ages of all young stars are considerably biased. 4. The stellar age biases change timescale available for planet formation. 5. What matters is the starspot coverage history, which is generally unobservable. 6. Teff measurement is hindered for highly inclined young spotted stars.
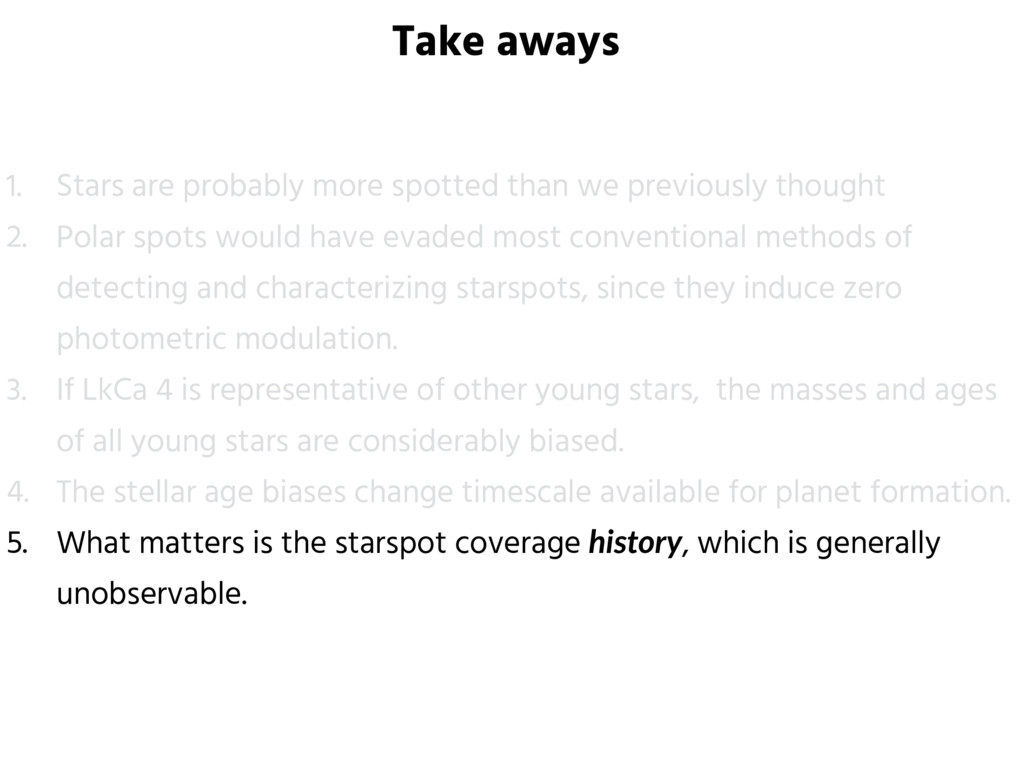
2. Polar spots would have evaded most conventional methods of detecting and characterizing starspots, since they induce zero photometric modulation. 3. If LkCa 4 is representative of other young stars, the masses and ages of all young stars are considerably biased. 4. The stellar age biases change timescale available for planet formation. 5. What matters is the starspot coverage history, which is generally unobservable. 6. Teff measurement is hindered for highly inclined young spotted stars. Take aways
2. Polar spots would have evaded most conventional methods of detecting and characterizing starspots, since they induce zero photometric modulation. 3. If LkCa 4 is representative of other young stars, the masses and ages of all young stars are considerably biased. 4. The stellar age biases change timescale available for planet formation. 5. What matters is the starspot coverage history, which is generally unobservable. 6. Teff measurement is hindered for highly inclined young spotted stars. Take aways
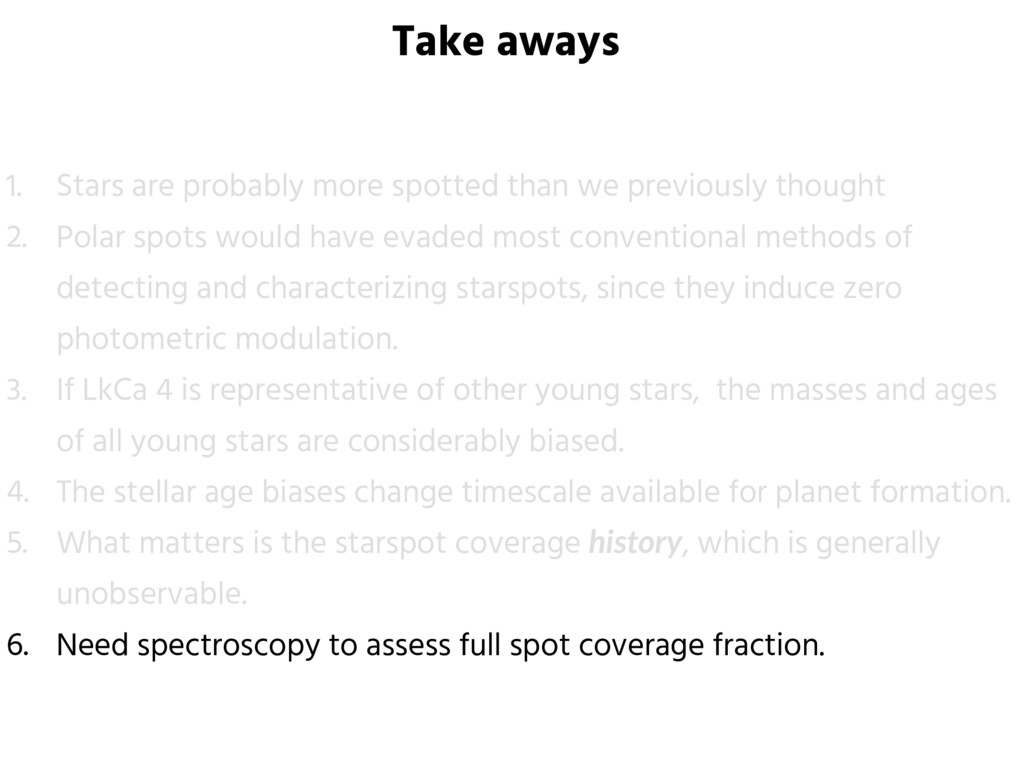
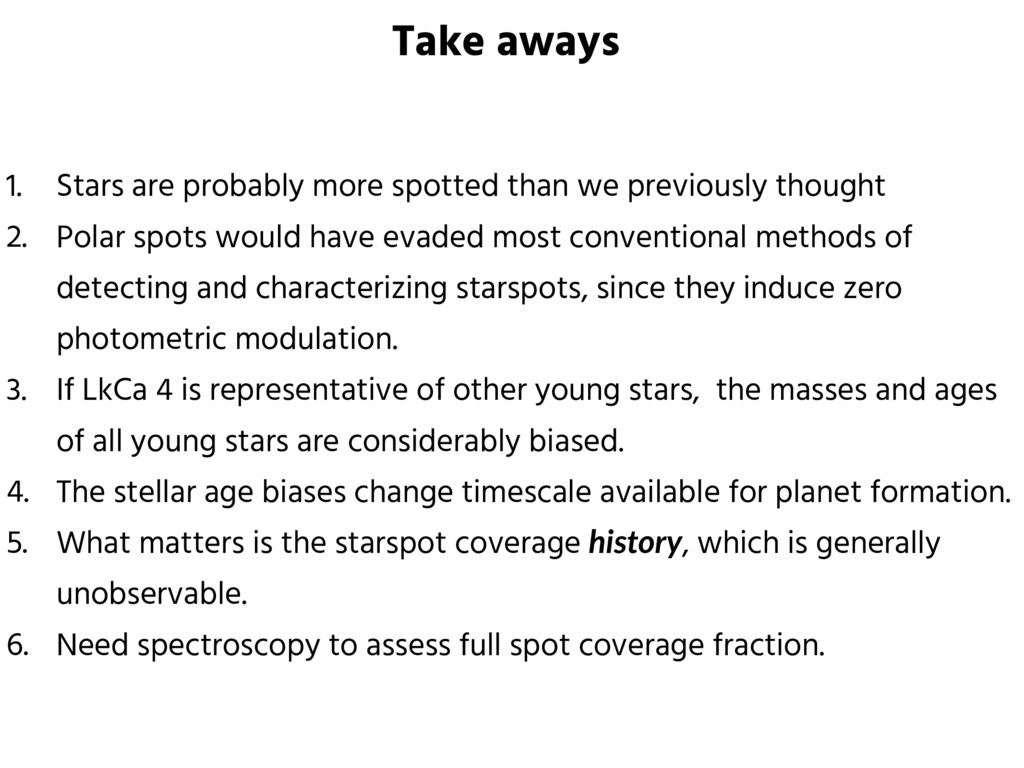
2. Polar spots would have evaded most conventional methods of detecting and characterizing starspots, since they induce zero photometric modulation. 3. If LkCa 4 is representative of other young stars, the masses and ages of all young stars are considerably biased. 4. The stellar age biases change timescale available for planet formation. 5. What matters is the starspot coverage history, which is generally unobservable. 6. Need spectroscopy to assess full spot coverage fraction. Take aways
2. Polar spots would have evaded most conventional methods of detecting and characterizing starspots, since they induce zero photometric modulation. 3. If LkCa 4 is representative of other young stars, the masses and ages of all young stars are considerably biased. 4. The stellar age biases change timescale available for planet formation. 5. What matters is the starspot coverage history, which is generally unobservable. 6. Need spectroscopy to assess full spot coverage fraction. Take aways