Seminar given at Imperial College on Nov 4 2020, to an audience of astrophysicists (not necessarily cosmologists). This is astate of affairs of some aspects of observational cosmology, with a focus on a comparison between the 2010s and the 2020s.
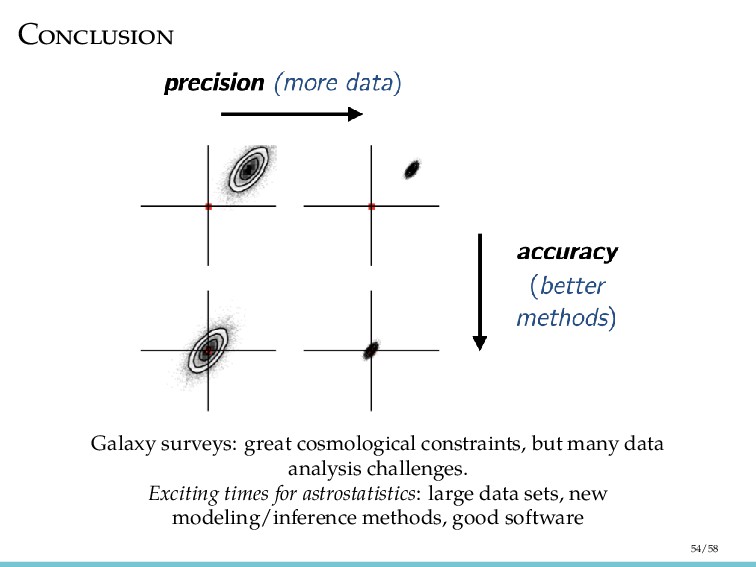
analysis challenges Disclaimer – there are many other: 1) interesting questions in cosmology, 2) types of surveys/missions that can help answer those questions, 3) data analysis challenges. 2/58
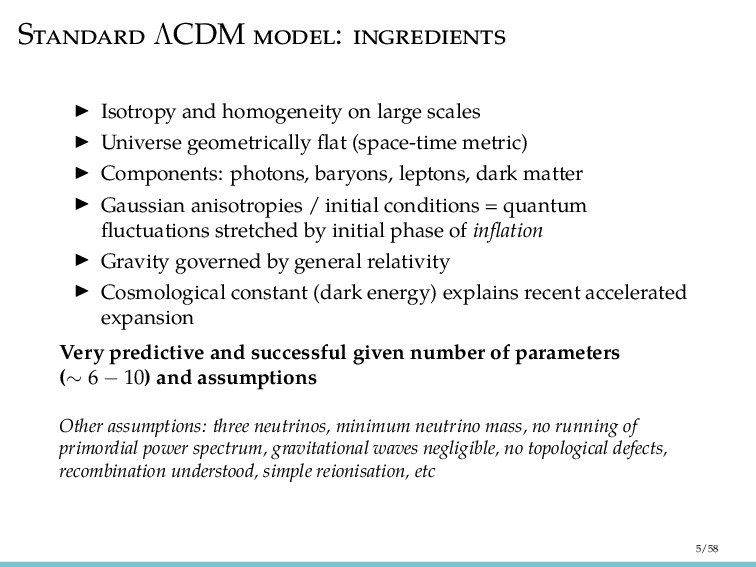
geometrically flat (space-time metric) Components: photons, baryons, leptons, dark matter Gaussian anisotropies / initial conditions = quantum fluctuations stretched by initial phase of inflation Gravity governed by general relativity Cosmological constant (dark energy) explains recent accelerated expansion Very predictive and successful given number of parameters (∼ 6 − 10) and assumptions Other assumptions: three neutrinos, minimum neutrino mass, no running of primordial power spectrum, gravitational waves negligible, no topological defects, recombination understood, simple reionisation, etc 5/58
nucleosynthesis (abundances of H, He, Li) ‘Late’ universe (0 < z < 3): Clustering of galaxies, including baryon acoustic oscillations Weak lensing of galaxies Clustering of neutral hydrogen in quasar Lyman alpha forest Type Ia supernovae Clustering, abundances, & lensing of galaxy clusters Strong lensing 6/58
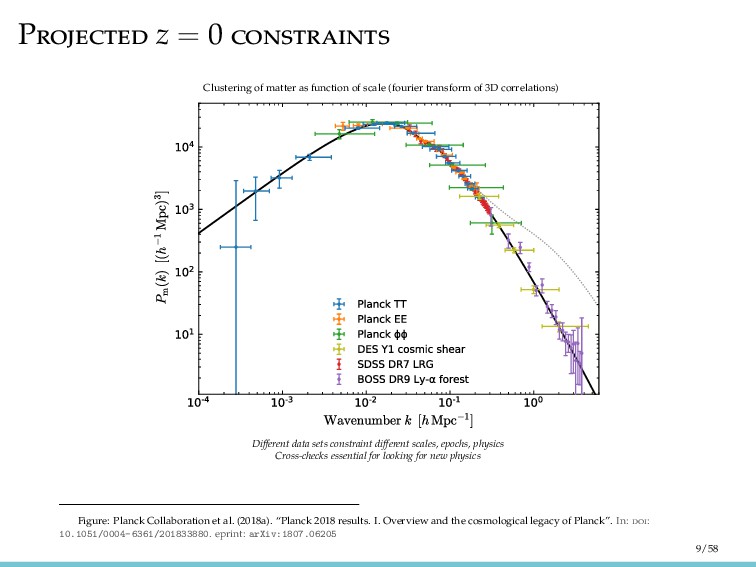
scale (fourier transform of 3D correlations) Different data sets constraint different scales, epochs, physics Cross-checks essential for looking for new physics Figure: Planck Collaboration et al. (2018a). “Planck 2018 results. I. Overview and the cosmological legacy of Planck”. In: : 10.1051/0004-6361/201833880. eprint: arXiv:1807.06205 9/58
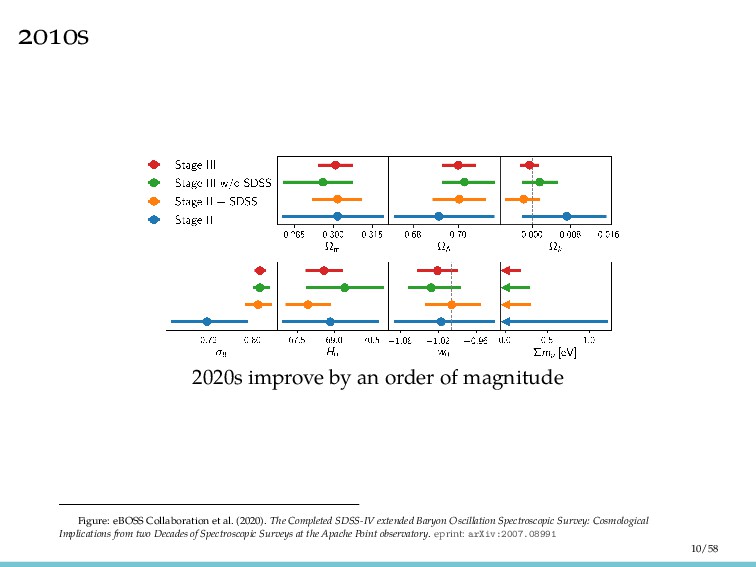
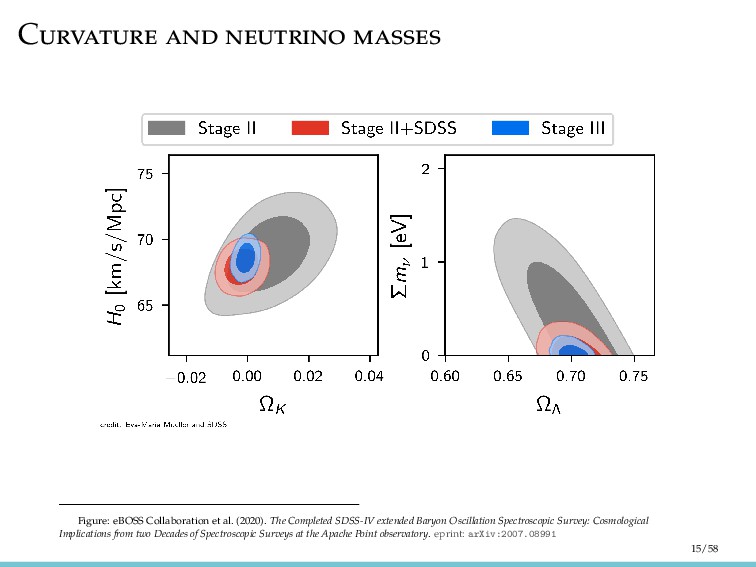
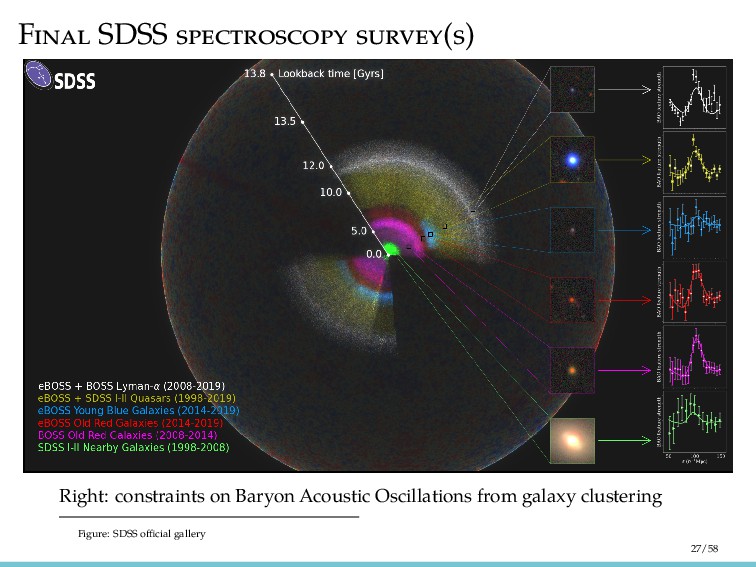
et al. (2020). The Completed SDSS-IV extended Baryon Oscillation Spectroscopic Survey: Cosmological Implications from two Decades of Spectroscopic Surveys at the Apache Point observatory. eprint: arXiv:2007.08991 10/58
for dark matter or dark energy 3. Multiple ΛCDM assumptions relaxed = weakened model constraints 4. Tensions between current data sets, with no viable explanation 5. Some physics/assumptions yet to be tested: curvature, modified gravity, inflationary physics, neutrino masses, etc 12/58
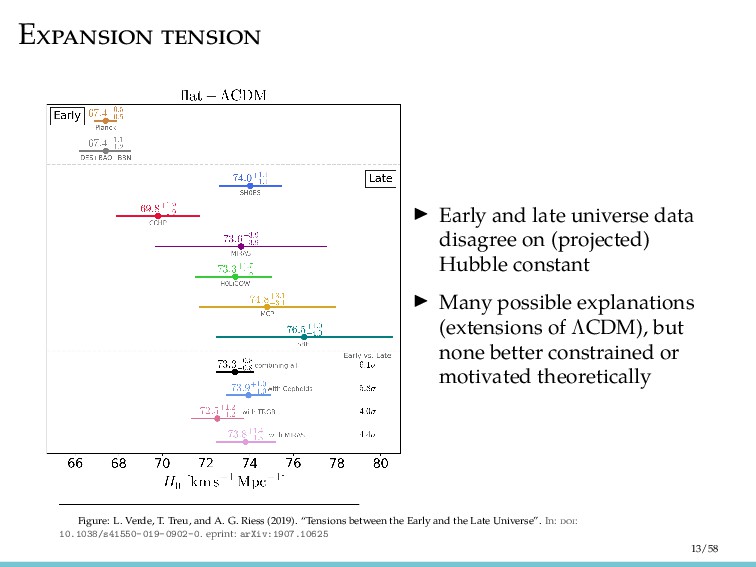
constant Many possible explanations (extensions of ΛCDM), but none better constrained or motivated theoretically Figure: L. Verde, T. Treu, and A. G. Riess (2019). “Tensions between the Early and the Late Universe”. In: : 10.1038/s41550-019-0902-0. eprint: arXiv:1907.10625 13/58
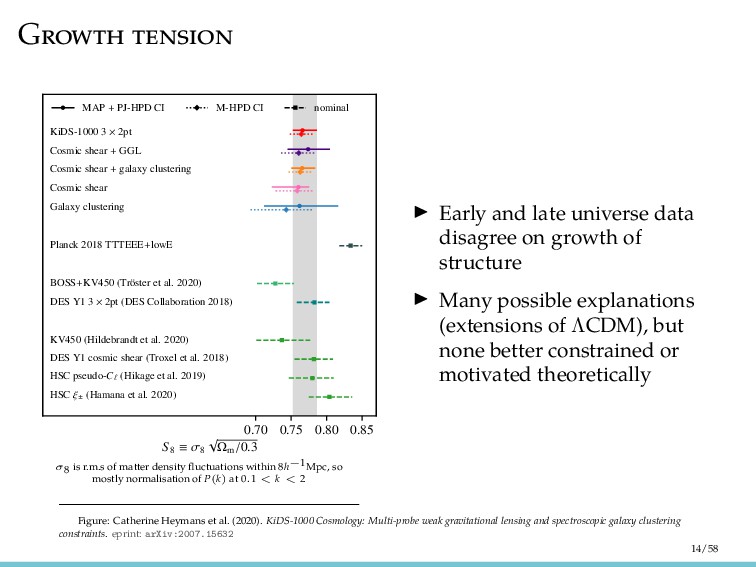
KiDS-1000 3 × 2pt Cosmic shear + GGL Cosmic shear + galaxy clustering Cosmic shear Galaxy clustering Planck 2018 TTTEEE+lowE BOSS+KV450 (Tr¨ oster et al. 2020) DES Y1 3 × 2pt (DES Collaboration 2018) KV450 (Hildebrandt et al. 2020) DES Y1 cosmic shear (Troxel et al. 2018) HSC pseudo-C (Hikage et al. 2019) HSC ξ± (Hamana et al. 2020) MAP + PJ-HPD CI M-HPD CI nominal σ 8 is r.m.s of matter density fluctuations within 8h−1Mpc, so mostly normalisation of P(k) at 0.1 < k < 2 Early and late universe data disagree on growth of structure Many possible explanations (extensions of ΛCDM), but none better constrained or motivated theoretically Figure: Catherine Heymans et al. (2020). KiDS-1000 Cosmology: Multi-probe weak gravitational lensing and spectroscopic galaxy clustering constraints. eprint: arXiv:2007.15632 14/58
extended Baryon Oscillation Spectroscopic Survey: Cosmological Implications from two Decades of Spectroscopic Surveys at the Apache Point observatory. eprint: arXiv:2007.08991 15/58
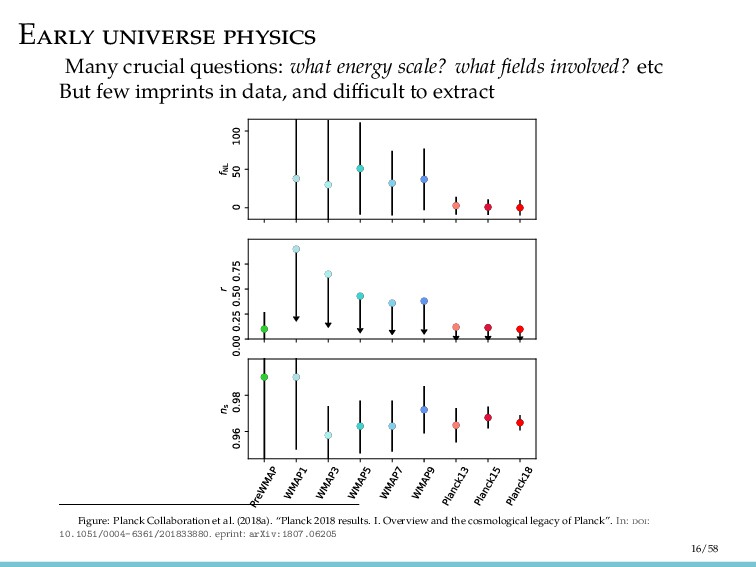
etc But few imprints in data, and difficult to extract Figure: Planck Collaboration et al. (2018a). “Planck 2018 results. I. Overview and the cosmological legacy of Planck”. In: : 10.1051/0004-6361/201833880. eprint: arXiv:1807.06205 16/58
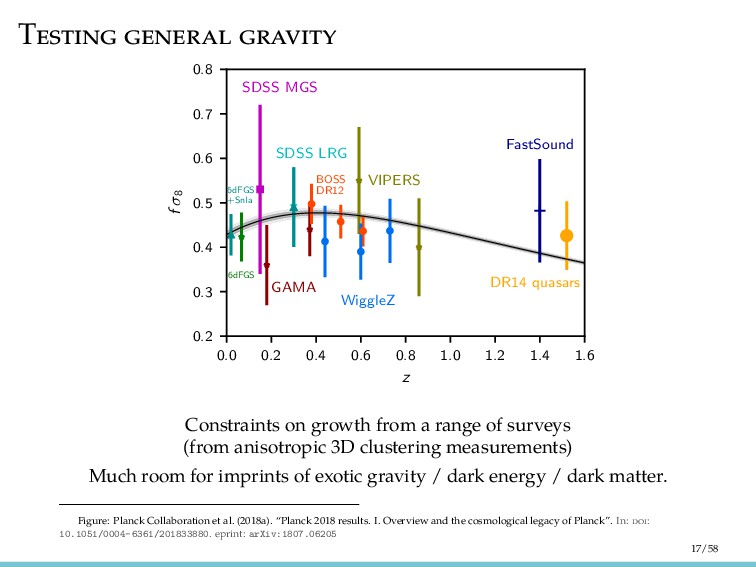
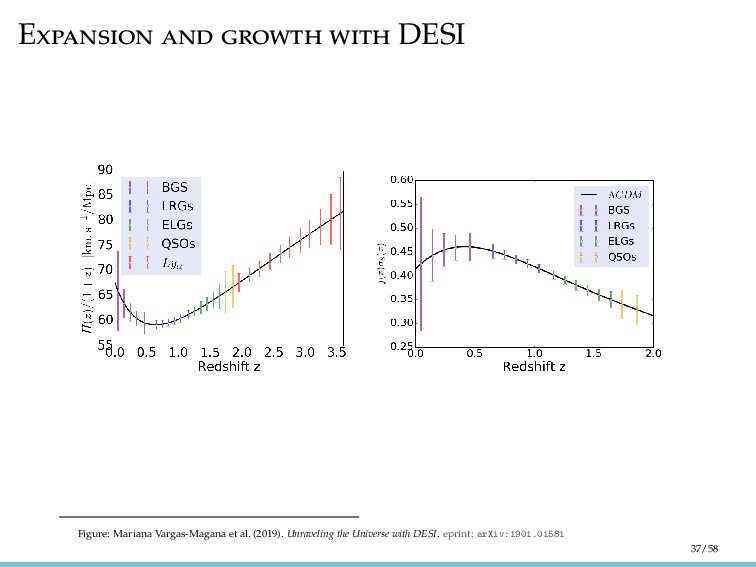
z 0.2 0.3 0.4 0.5 0.6 0.7 0.8 f 8 6dFGS SDSS MGS SDSS LRG 6dFGS +SnIa GAMA VIPERS BOSS DR12 WiggleZ DR14 quasars FastSound Constraints on growth from a range of surveys (from anisotropic 3D clustering measurements) Much room for imprints of exotic gravity / dark energy / dark matter. Figure: Planck Collaboration et al. (2018a). “Planck 2018 results. I. Overview and the cosmological legacy of Planck”. In: : 10.1051/0004-6361/201833880. eprint: arXiv:1807.06205 17/58
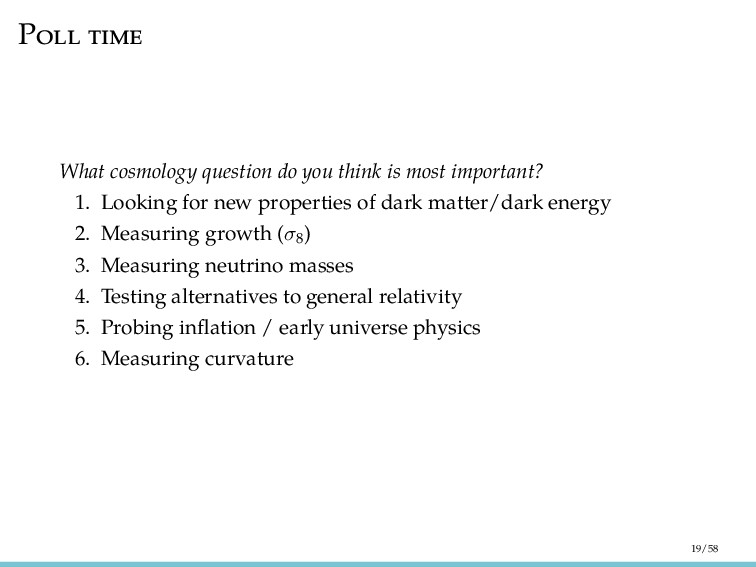
1. Looking for new properties of dark matter/dark energy 2. Measuring growth (σ 8) 3. Measuring neutrino masses 4. Testing alternatives to general relativity 5. Probing inflation / early universe physics 6. Measuring curvature 19/58
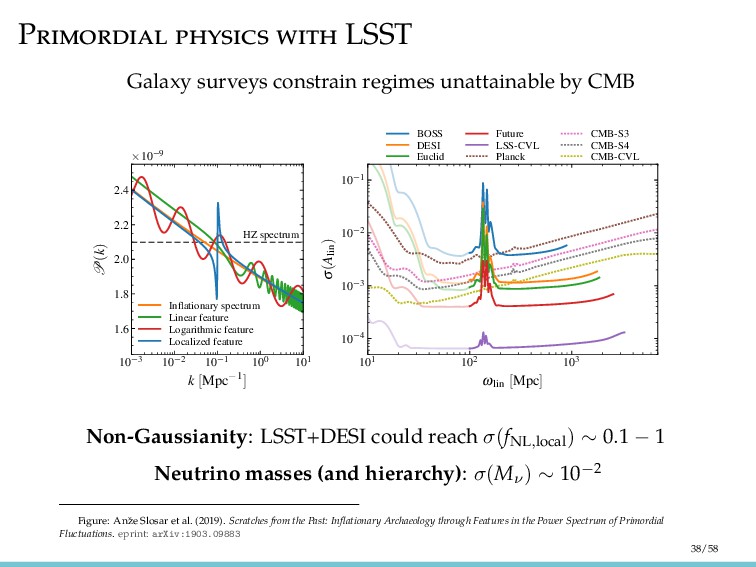
on: scale k redshift z line of sight angle µ galaxy bias b Sensitivity: Primordial physics : largest volumes/scales, high redshift, high bias Gravity/growth and expansion : all scales (number of modes) Neutrinos: small scales 23/58
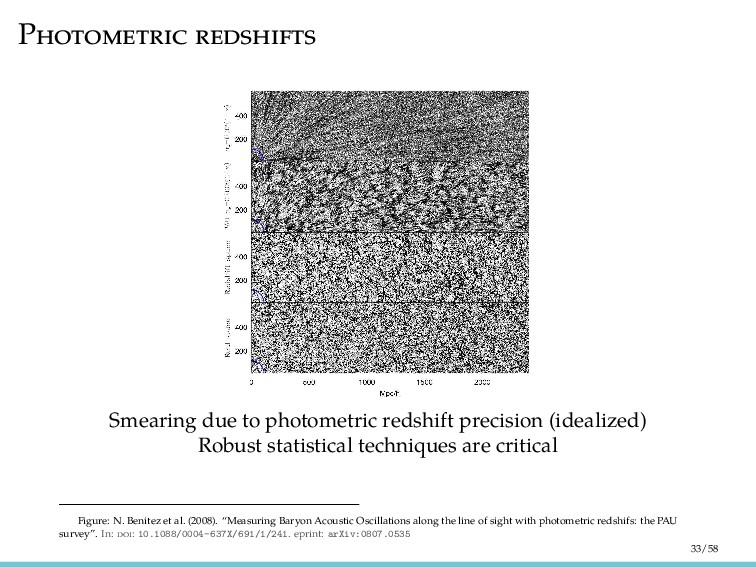
techniques are critical Figure: N. Benitez et al. (2008). “Measuring Baryon Acoustic Oscillations along the line of sight with photometric redshifs: the PAU survey”. In: : 10.1088/0004-637X/691/1/241. eprint: arXiv:0807.0535 33/58
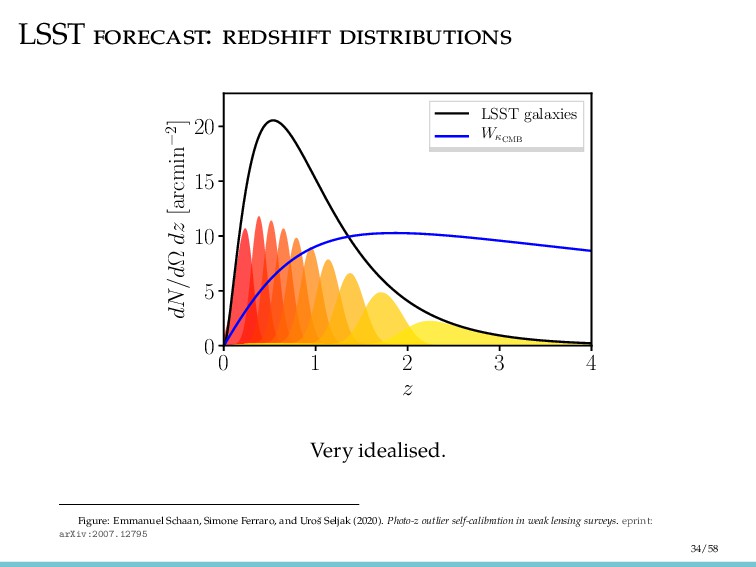
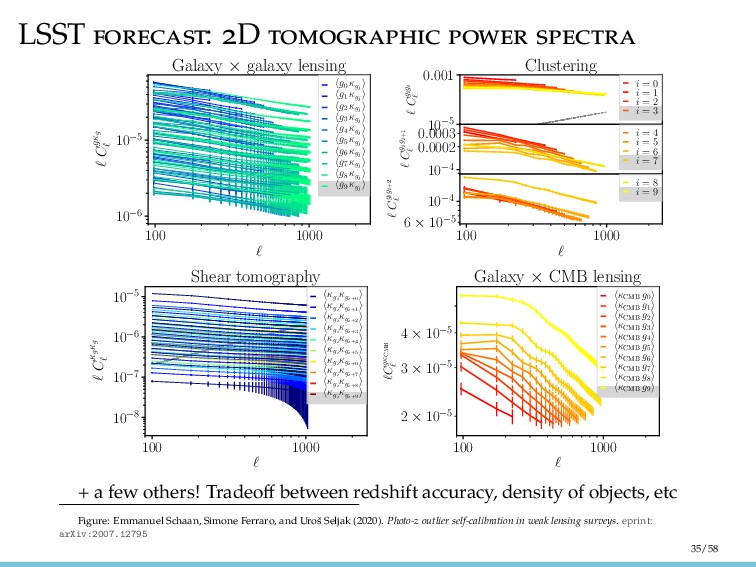
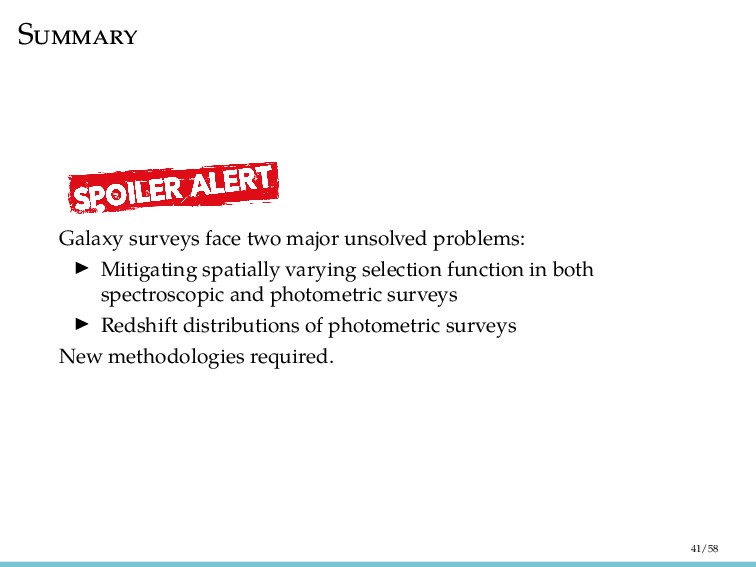
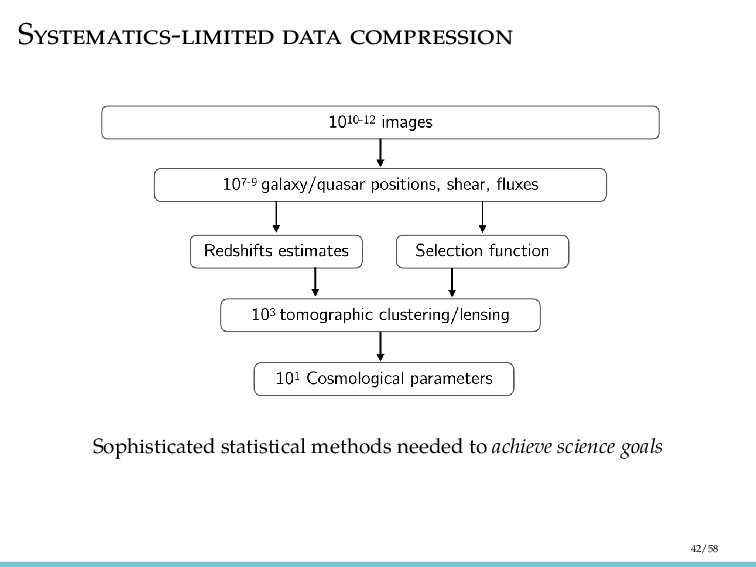
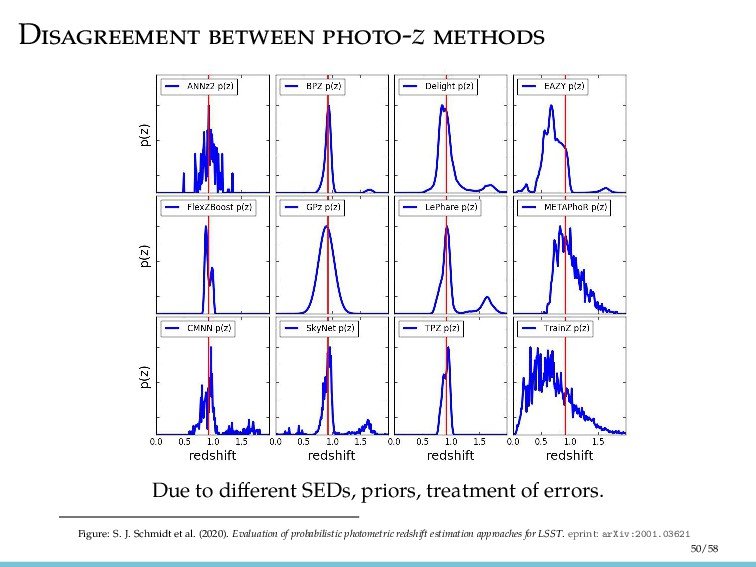
varying selection function in both spectroscopic and photometric surveys Redshift distributions of photometric surveys New methodologies required. 41/58
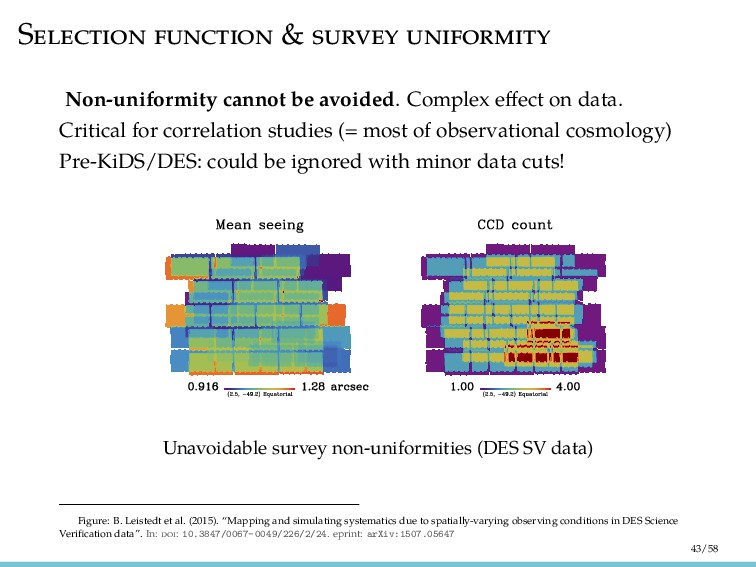
Critical for correlation studies (= most of observational cosmology) Pre-KiDS/DES: could be ignored with minor data cuts! Unavoidable survey non-uniformities (DES SV data) Figure: B. Leistedt et al. (2015). “Mapping and simulating systematics due to spatially-varying observing conditions in DES Science Verification data”. In: : 10.3847/0067-0049/226/2/24. eprint: arXiv:1507.05647 43/58
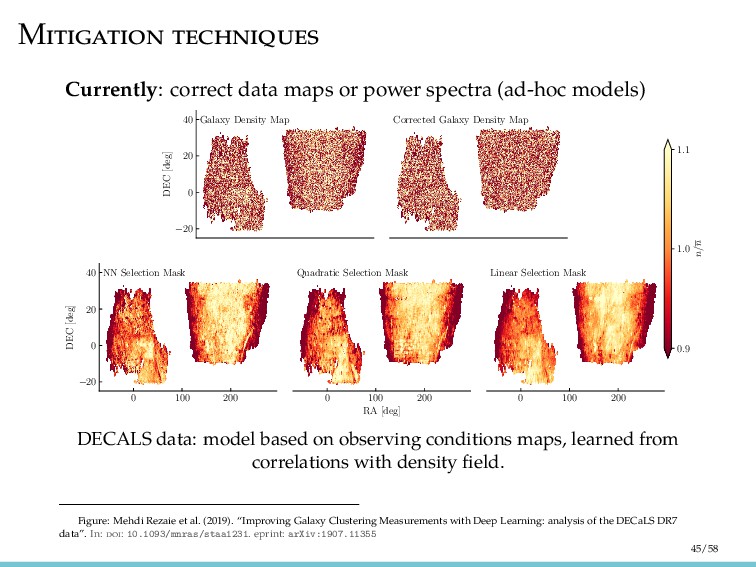
−20 0 20 40 DEC [deg] Galaxy Density Map Corrected Galaxy Density Map 0 100 200 −20 0 20 40 DEC [deg] NN Selection Mask 0 100 200 RA [deg] Quadratic Selection Mask 0 100 200 Linear Selection Mask 0.9 1.0 1.1 n/n DECALS data: model based on observing conditions maps, learned from correlations with density field. Figure: Mehdi Rezaie et al. (2019). “Improving Galaxy Clustering Measurements with Deep Learning: analysis of the DECaLS DR7 data”. In: : 10.1093/mnras/staa1231. eprint: arXiv:1907.11355 45/58
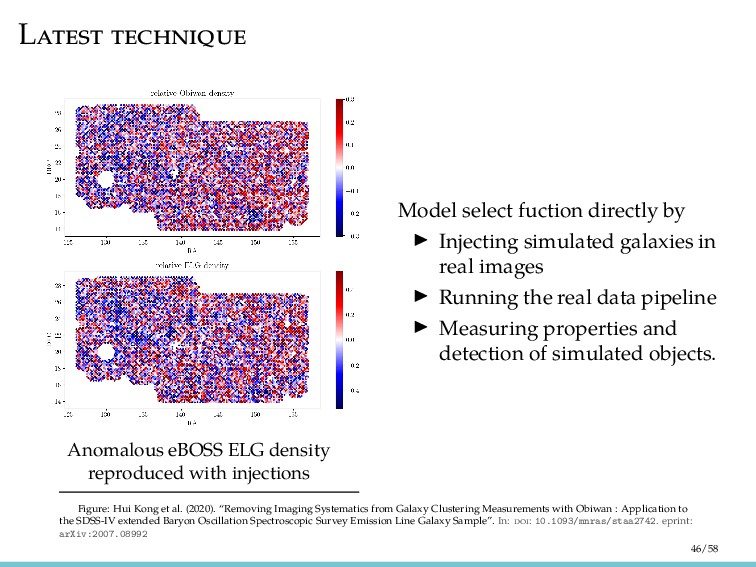
fuction directly by Injecting simulated galaxies in real images Running the real data pipeline Measuring properties and detection of simulated objects. Figure: Hui Kong et al. (2020). “Removing Imaging Systematics from Galaxy Clustering Measurements with Obiwan : Application to the SDSS-IV extended Baryon Oscillation Spectroscopic Survey Emission Line Galaxy Sample”. In: : 10.1093/mnras/staa2742. eprint: arXiv:2007.08992 46/58
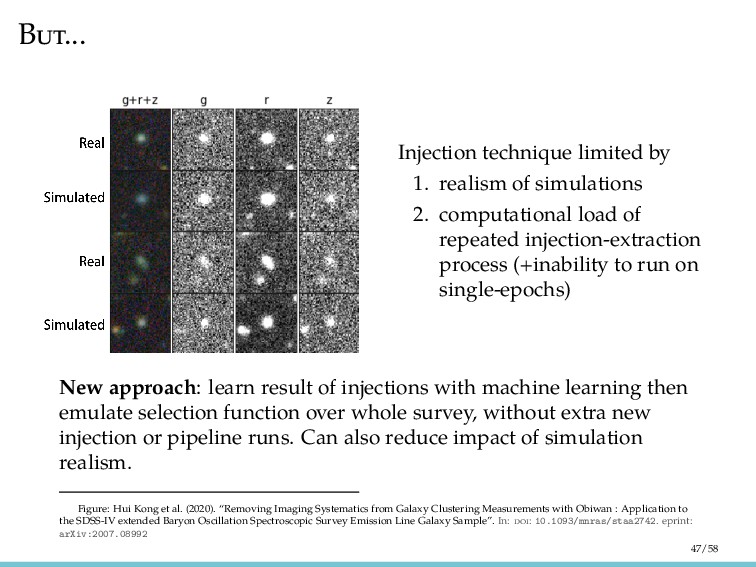
2. computational load of repeated injection-extraction process (+inability to run on single-epochs) New approach: learn result of injections with machine learning then emulate selection function over whole survey, without extra new injection or pipeline runs. Can also reduce impact of simulation realism. Figure: Hui Kong et al. (2020). “Removing Imaging Systematics from Galaxy Clustering Measurements with Obiwan : Application to the SDSS-IV extended Baryon Oscillation Spectroscopic Survey Emission Line Galaxy Sample”. In: : 10.1093/mnras/staa2742. eprint: arXiv:2007.08992 47/58
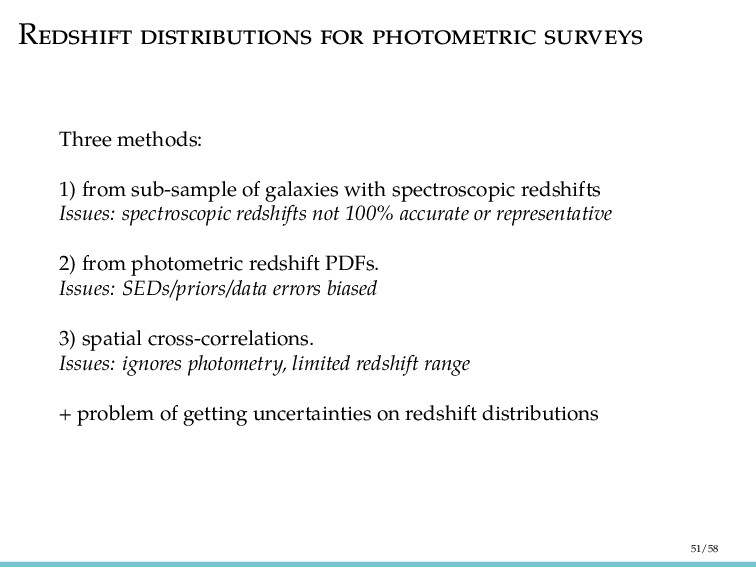
redshifts Issues: spectroscopic redshifts not 100% accurate or representative 2) from photometric redshift PDFs. Issues: SEDs/priors/data errors biased 3) spatial cross-correlations. Issues: ignores photometry, limited redshift range + problem of getting uncertainties on redshift distributions 51/58
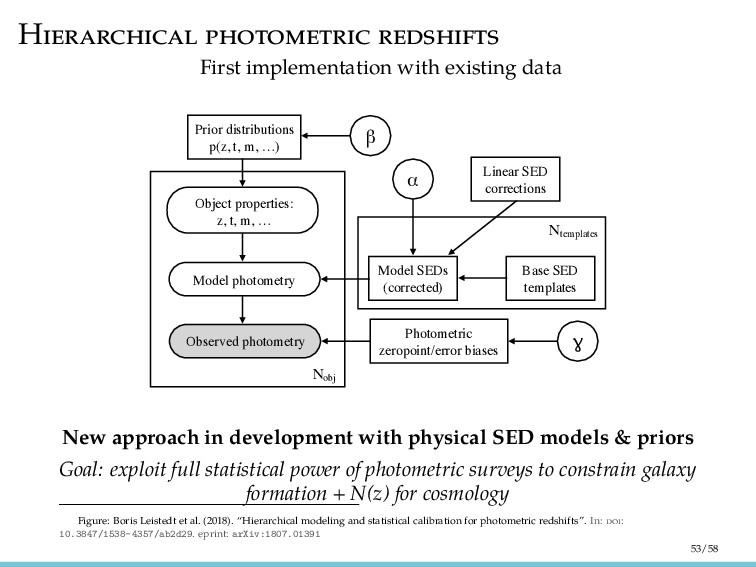
properties: z, t, m, … Model photometry Observed photometry Model SEDs (corrected) Base SED templates Linear SED corrections Prior distributions p(z, t, m, …) Photometric zeropoint/error biases Nobj Ntemplates New approach in development with physical SED models & priors Goal: exploit full statistical power of photometric surveys to constrain galaxy formation + N(z) for cosmology Figure: Boris Leistedt et al. (2018). “Hierarchical modeling and statistical calibration for photometric redshifts”. In: : 10.3847/1538-4357/ab2d29. eprint: arXiv:1807.01391 53/58
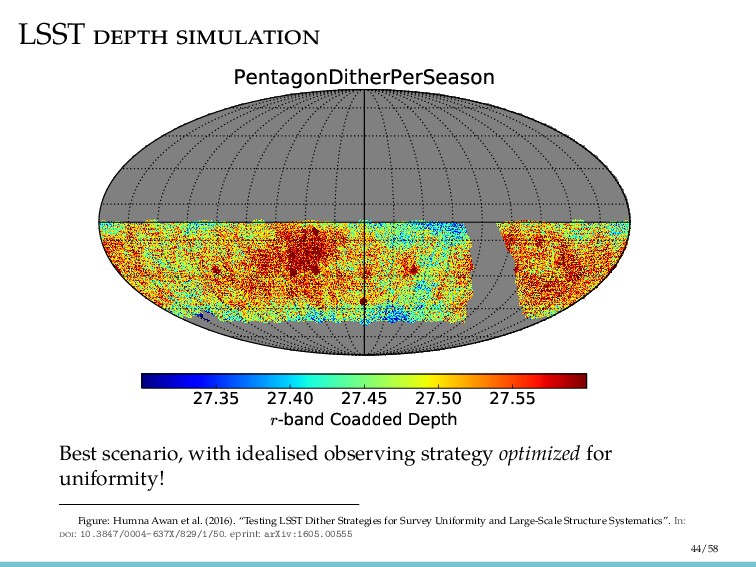
Strategies for Survey Uniformity and Large-Scale Structure Systematics”. In: : 10.3847/0004-637X/829/1/50. eprint: arXiv:1605.00555. Benitez, N. et al. (2008). “Measuring Baryon Acoustic Oscillations along the line of sight with photometric redshifs: the PAU survey”. In: : 10.1088/0004-637X/691/1/241. eprint: arXiv:0807.0535. Collaboration, eBOSS et al. (2020). The Completed SDSS-IV extended Baryon Oscillation Spectroscopic Survey: Cosmological Implications from two Decades of Spectroscopic Surveys at the Apache Point observatory. eprint: arXiv:2007.08991. Collaboration, Planck et al. (2018a). “Planck 2018 results. I. Overview and the cosmological legacy of Planck”. In: : 10.1051/0004-6361/201833880. eprint: arXiv:1807.06205. Collaboration, Planck et al. (2018b). “Planck 2018 results. VI. Cosmological parameters”. In: : 10.1051/0004-6361/201833910. eprint: arXiv:1807.06209. 56/58
Measurements with Deep Learning: analysis of the DECaLS DR7 data”. In: : 10.1093/mnras/staa1231. eprint: arXiv:1907.11355. Salvato, Mara, Olivier Ilbert, and Ben Hoyle (2018). The many flavours of photometric redshifts. eprint: arXiv:1805.12574. Schaan, Emmanuel, Simone Ferraro, and Uroˇ s Seljak (2020). Photo-z outlier self-calibration in weak lensing surveys. eprint: arXiv:2007.12795. Schmidt, S. J. et al. (2020). Evaluation of probabilistic photometric redshift estimation approaches for LSST. eprint: arXiv:2001.03621. Slosar, Anˇ ze et al. (2019). Scratches from the Past: Inflationary Archaeology through Features in the Power Spectrum of Primordial Fluctuations. eprint: arXiv:1903.09883. Vargas-Magana, Mariana et al. (2019). Unraveling the Universe with DESI. eprint: arXiv:1901.01581. 58/58
![S P 4000 6000 8000 10000 λ [ ˚ A]](https://files.speakerdeck.com/presentations/94096050440e421384085d9dfdc05f1a/slide_25.jpg)