Upgrade to Pro — share decks privately, control downloads, hide ads and more …

Predictability: No Magic Required

Julia Wester
November 08, 2016

Predictability: No Magic Required

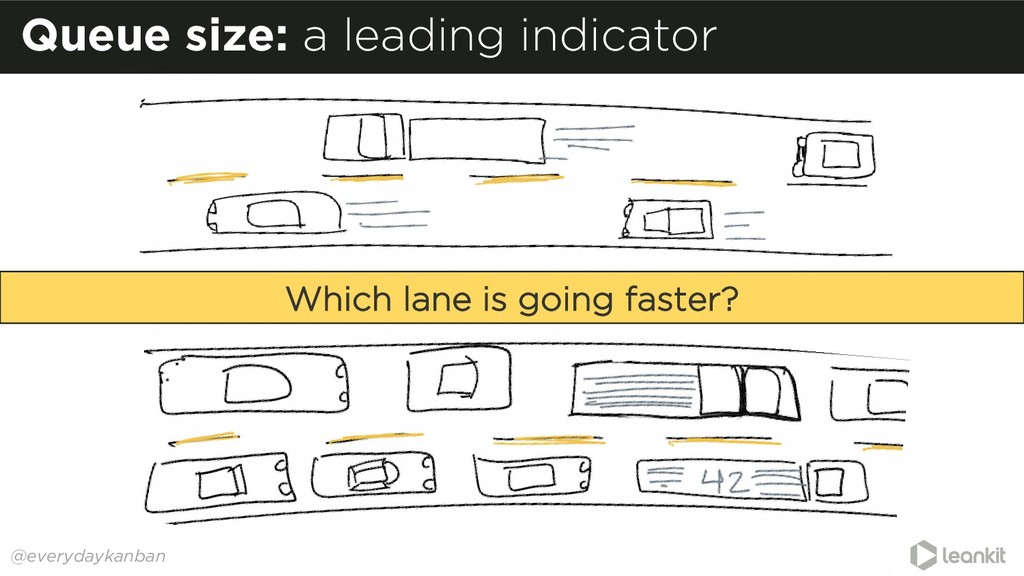
When you merge onto a freeway and are stuck in bumper-to-bumper traffic, you know right away that its going to be a long trip. Similarly, you can predict the cycle time of your work before it is finished without time consuming, and often incorrect, estimation. Sound like magic? Fortunately for all of us, it’s not.

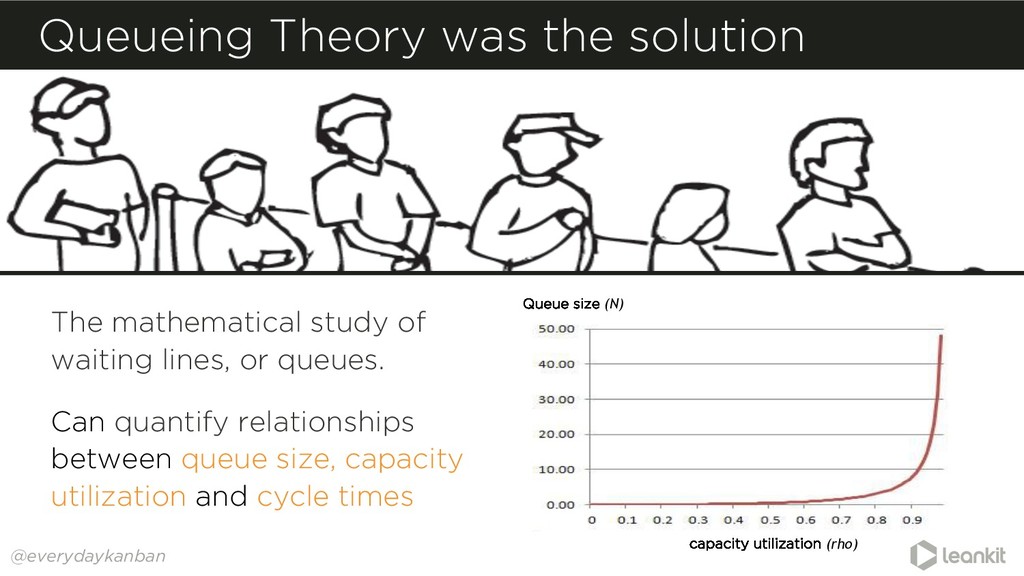
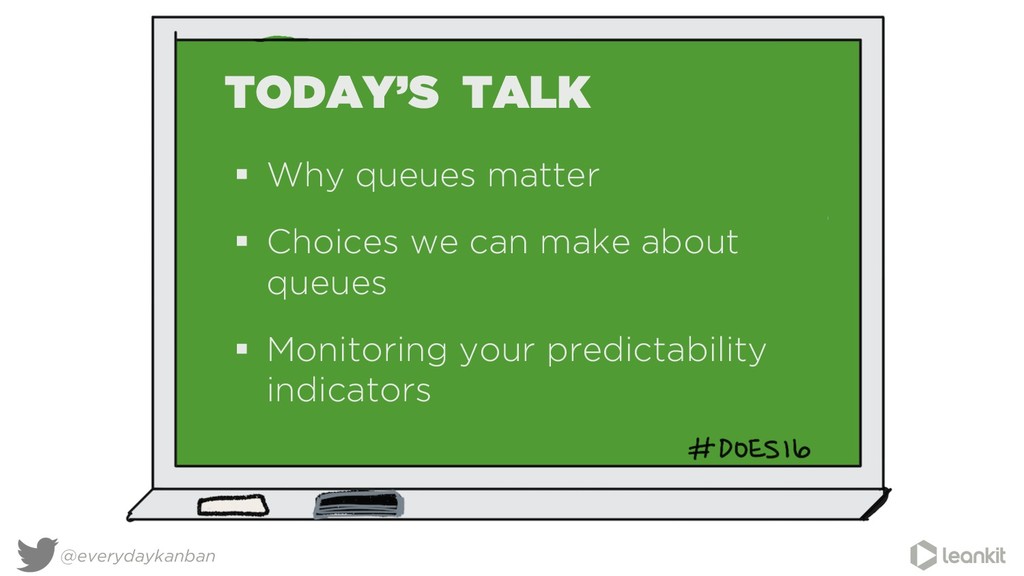
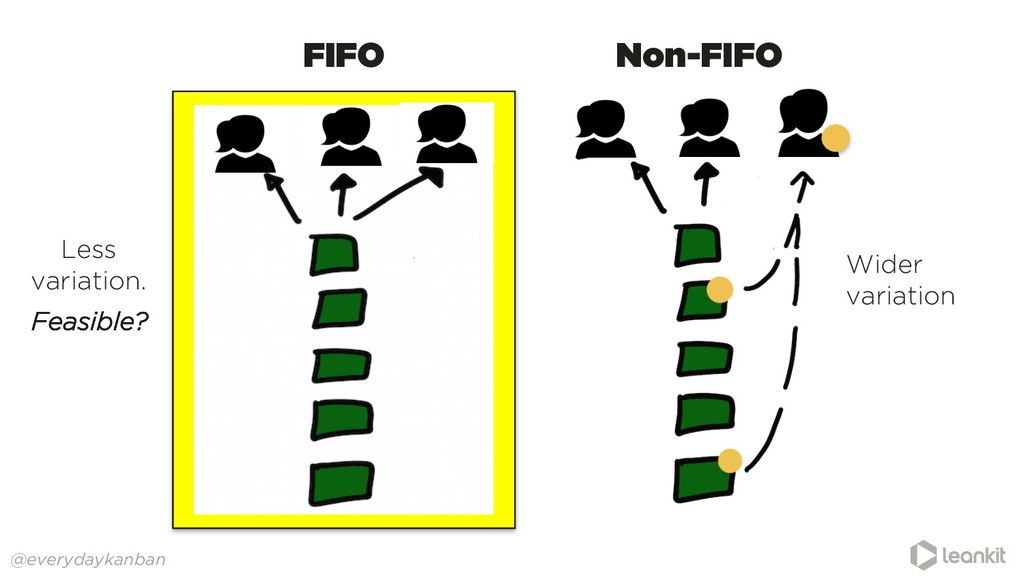
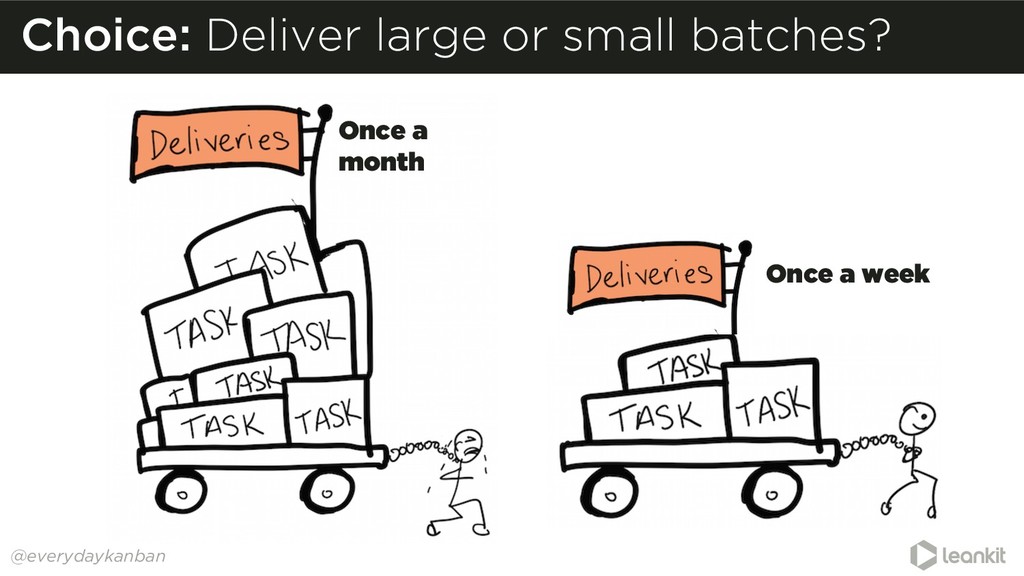
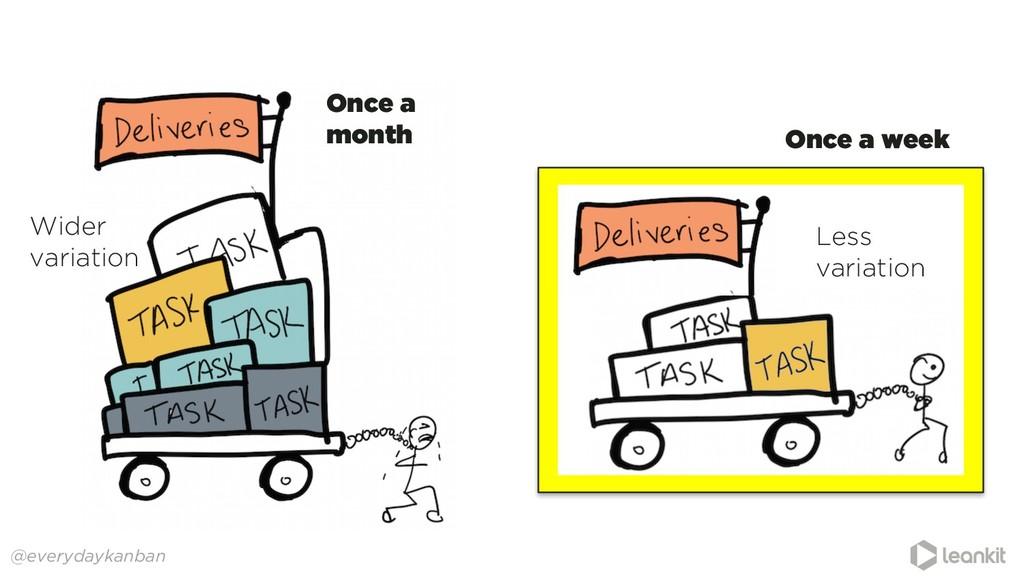
This talk explains the basics of queueing theory; demonstrates how allocation models and pull policies affect the cycle time of work; discusses the effects of batch size and variability on queues; and teaches how to successfully monitor your workflow to get leading indicators of effectiveness. With this information, you’ll be doing better forecasting, and achieving better outcomes, in no time!

Julia Wester

November 08, 2016
Tweet

More Decks by Julia Wester

Other Decks in Business

Transcript

  1. Adjective Expected, especially on the basis of previous or known

    behavior [good or bad!] Predictable [pri-dik-tuh-buh l] @everydaykanban USUALLY GREAT! USUALLY HORRIBLE! USUALLY ________!
  2. How many telephone lines are needed to avoid blocked calls

    given § Random arrivals § Random durations Pulling answers from randomness @everydaykanban
  3. The mathematical study of waiting lines, or queues. Can quantify

    relationships between queue size, capacity utilization and cycle times Queueing Theory was the solution @everydaykanban capacity utilization (rho) Queue size (N)
  4. @everydaykanban TODAY’S TALK § Why queues matter § Choices we

    can make about queues § Monitoring your predictability indicators
  5. Mo’ queue, Mo’ problems @everydaykanban § Longer average cycle times

    § Wider range of cycle times § More mgmt overhead § Reduced motivation & quality
  6. Predictability ≠ fastest UNLESS you can consistently be that fast.

    To become more predictable… USUALLY DONE IN 2 to 200 DAYS! @everydaykanban USUALLY DONE IN 25 to 35 DAYS! reduce the range of probable outcomes.
  7. @everydaykanban Choice: Use a push system or pull system? 1

    queue per server 1 queue multiple servers Which one do you use?
  8. @everydaykanban Cycle time ranges: Lagging indicator Nov October September August

    July Good clustering Can we reduce the outliers? 95%: 45 days or less
  9. @everydaykanban CFD: Demonstrates the relationship Work units Time Avg. Queue

    Size Avg. Cycle Time To Do Design Create Verify Deliver 18 10 1.5 2.5
  10. @everydaykanban Queue Size: predicting predictability issues Bigger queues lead to

    longer cycle times, less predictability Smaller queues lead to shorter cycle times, more predictability Work-In-Process (hidden queues?) Queued work 9 20 10 2
  11. @everydaykanban • Remember, you have control over predictability! • Get

    baseline measures of queue size/cycle times. • Make informed choices about handling queues. • Monitor queues to anticipate and correct issues before they negatively impact cycle times.
  12. www.leankit.com To receive a copy of: • The slide deck

    for today’s presentation • LeanKit’s 1st Annual Lean Business report Send an email to: [email protected] Subject: DOES16