Upgrade to Pro — share decks privately, control downloads, hide ads and more …

Exploratory Seminar #33 - Exploratory v6.4 Introduction

Kan Nishida
February 10, 2021

Exploratory Seminar #33 - Exploratory v6.4 Introduction

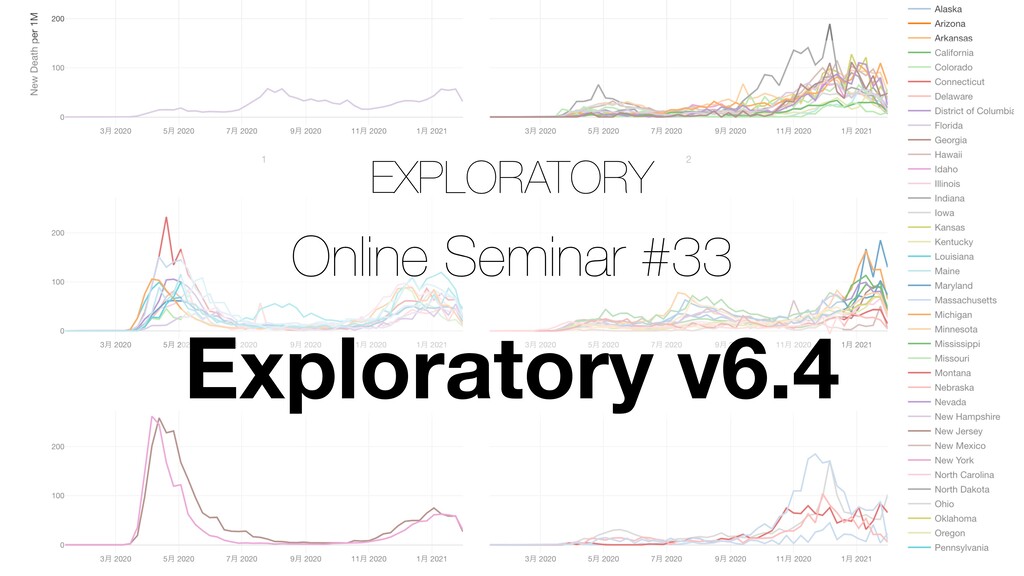
I have presented the newly released Exploratory v6.4's new features and enhancements on 2/10 (Wed), 2021.

Exploratory v6.4 New Feature Highlights:

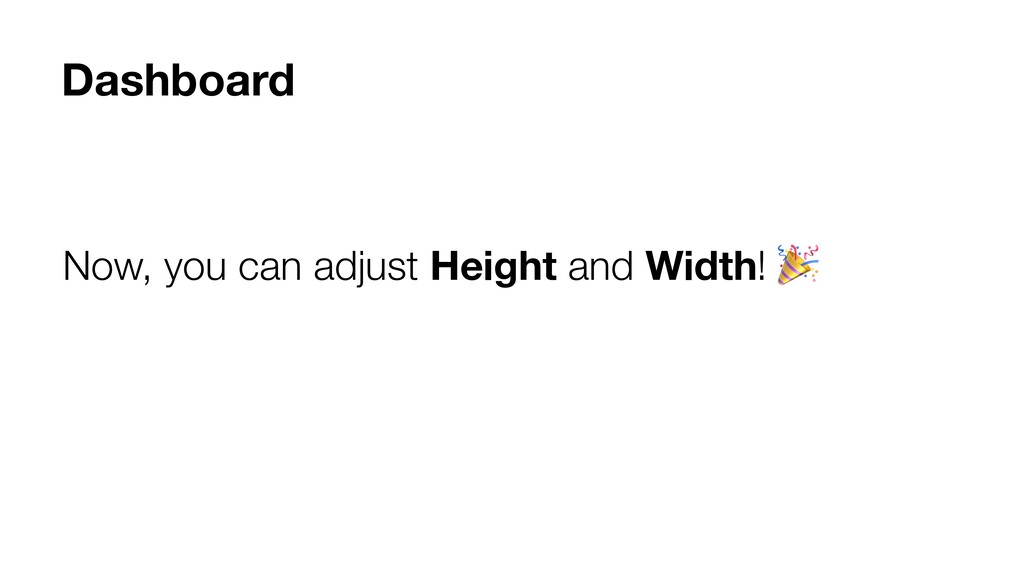
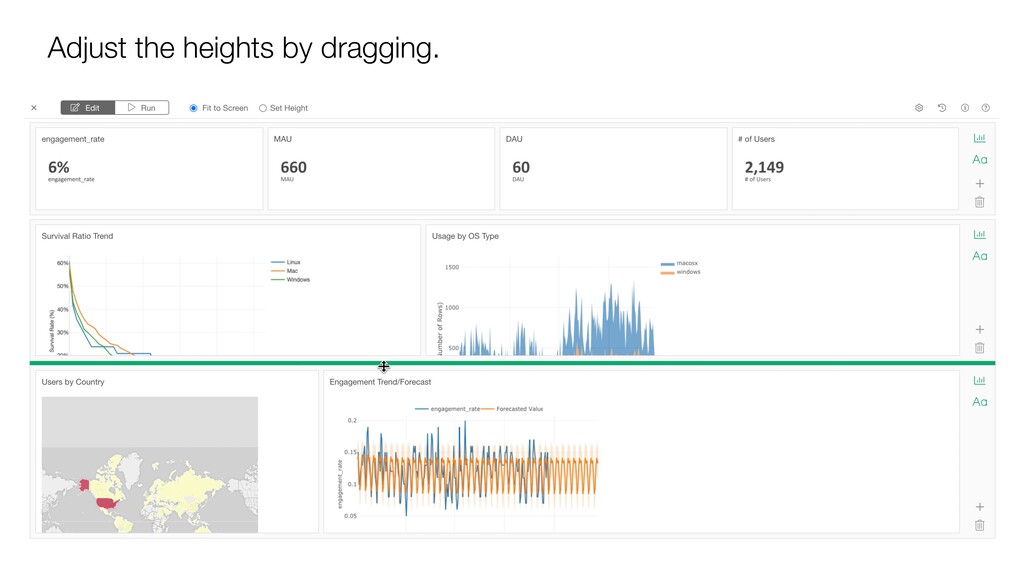
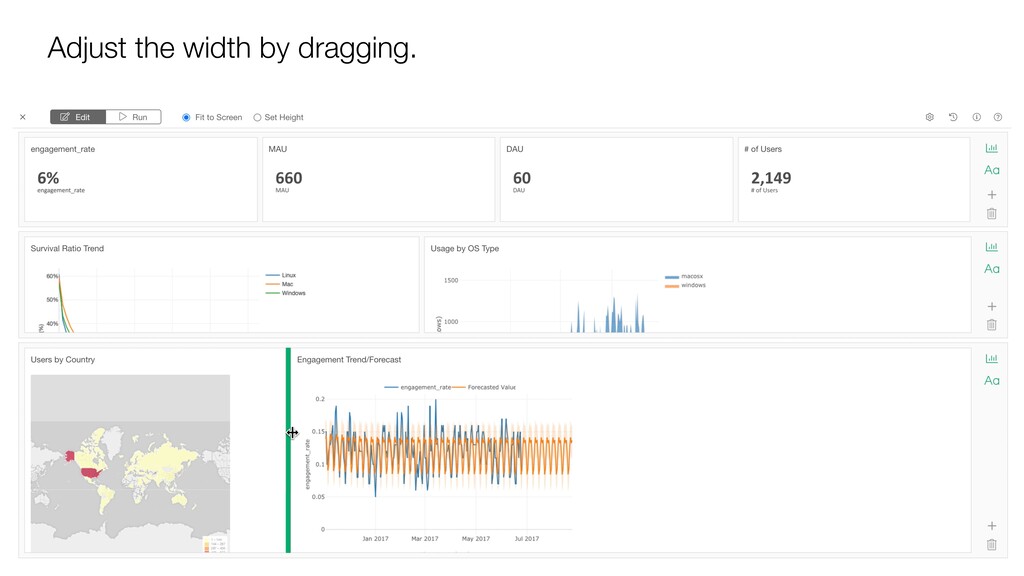
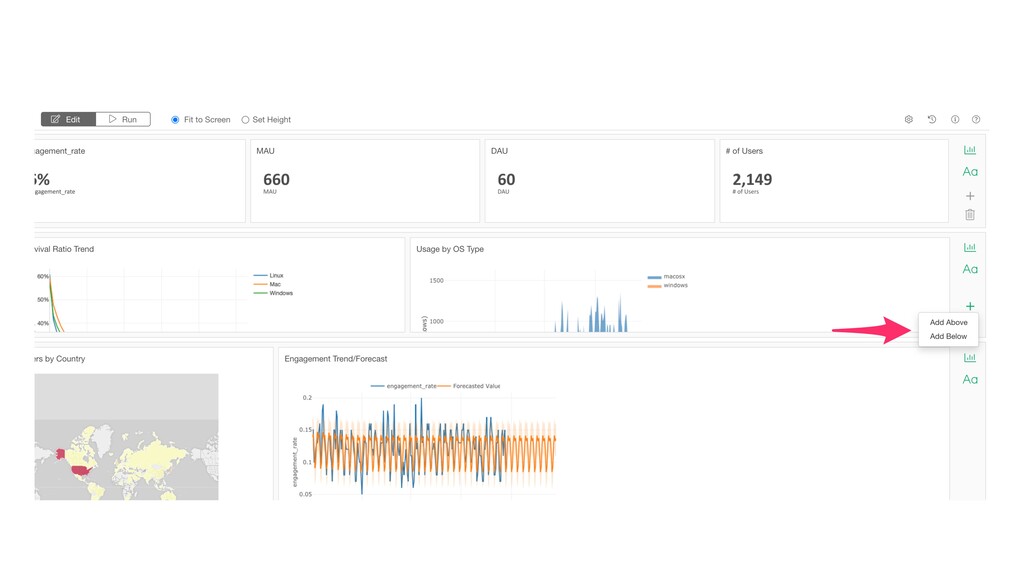
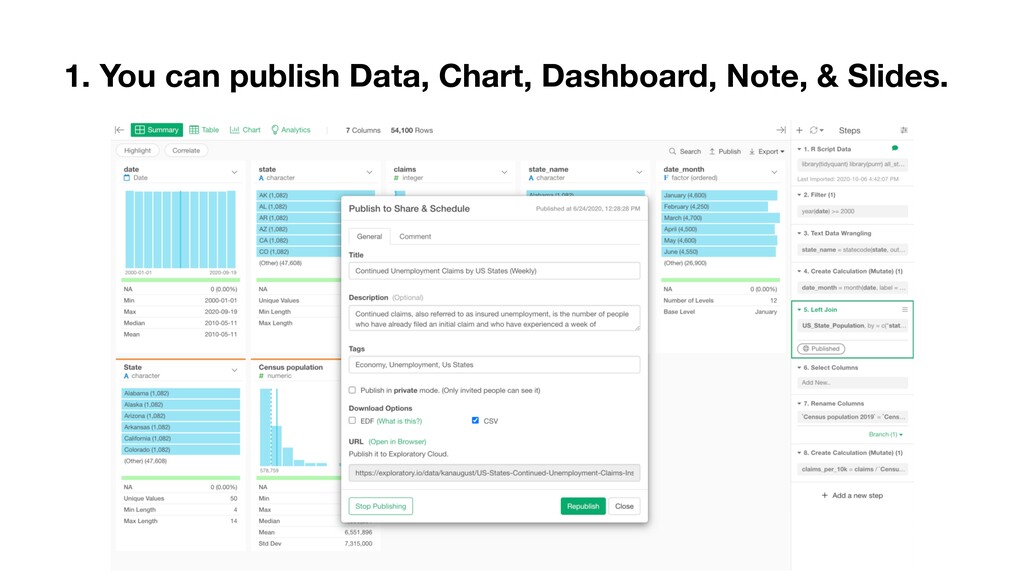
- Dashboard - Drag & Drop to Resize
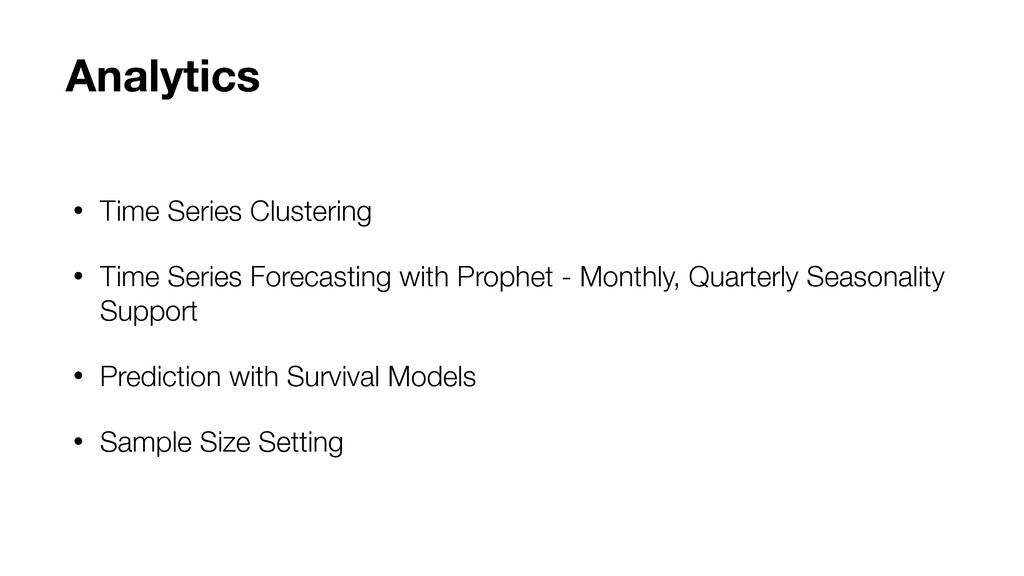
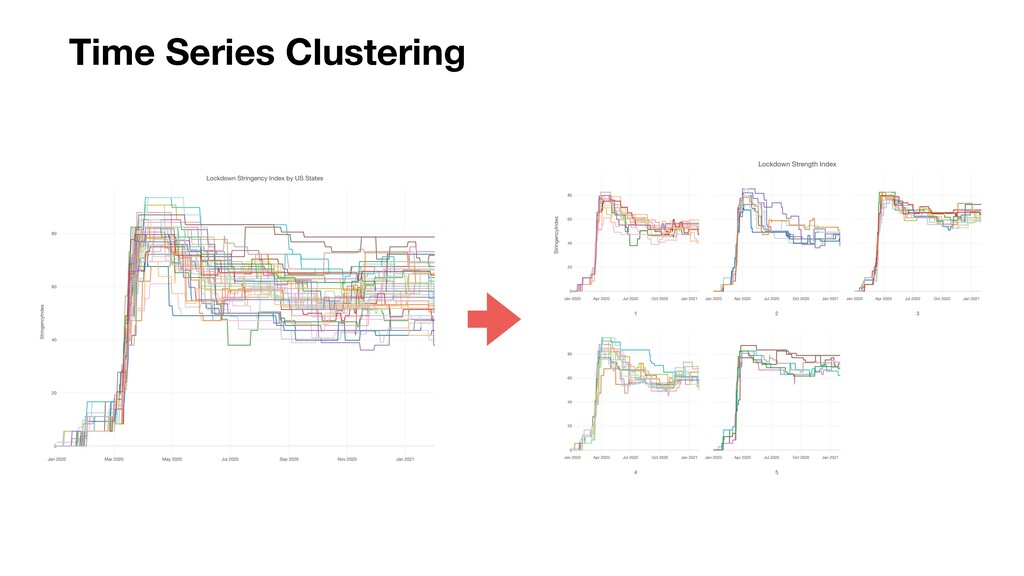
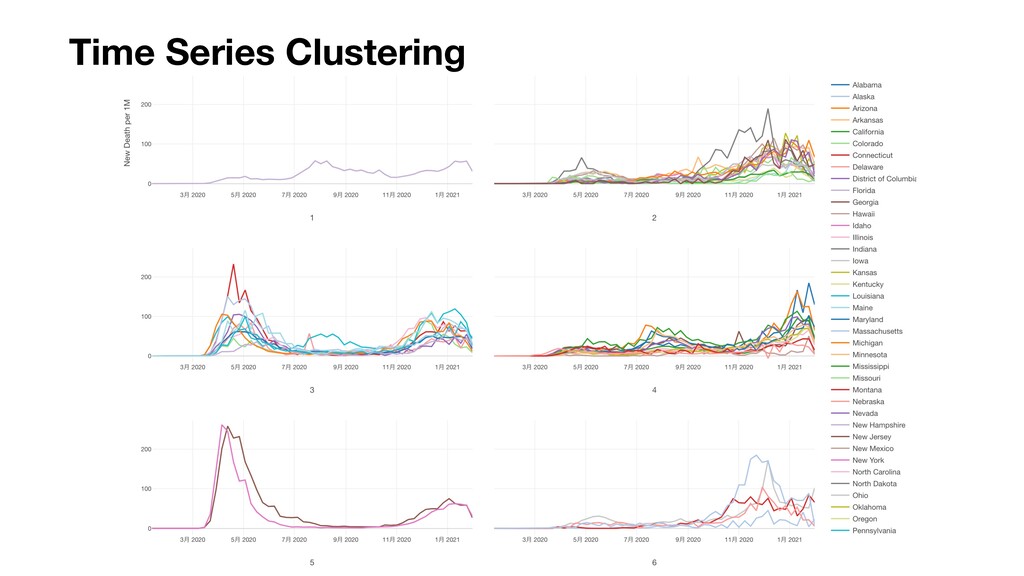
- Time Series Data Clustering
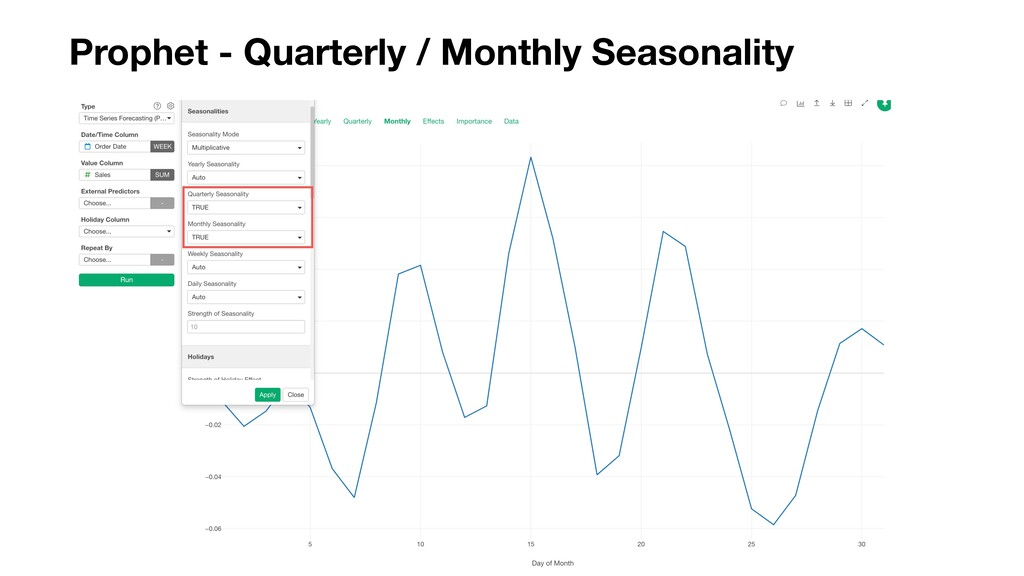
- Time Series Forecasting (Prophet) - Quarterly / Monthly Seasonality
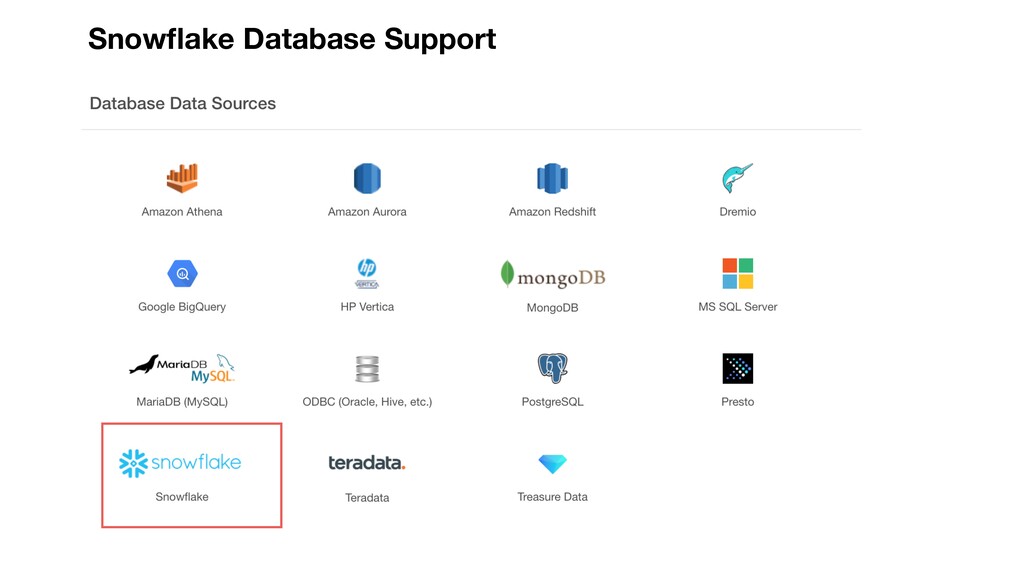
- Snowflake Data Source Support
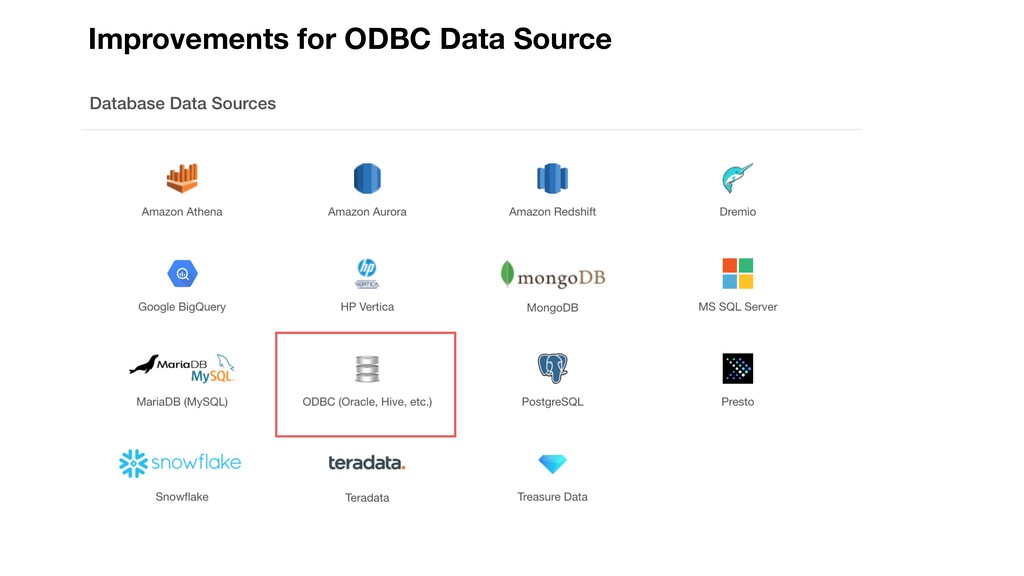
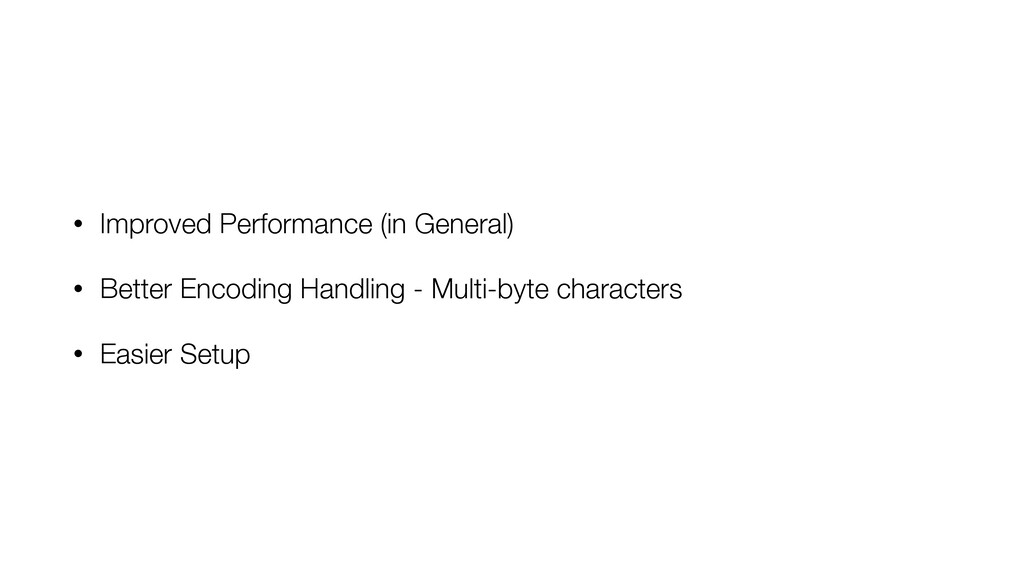
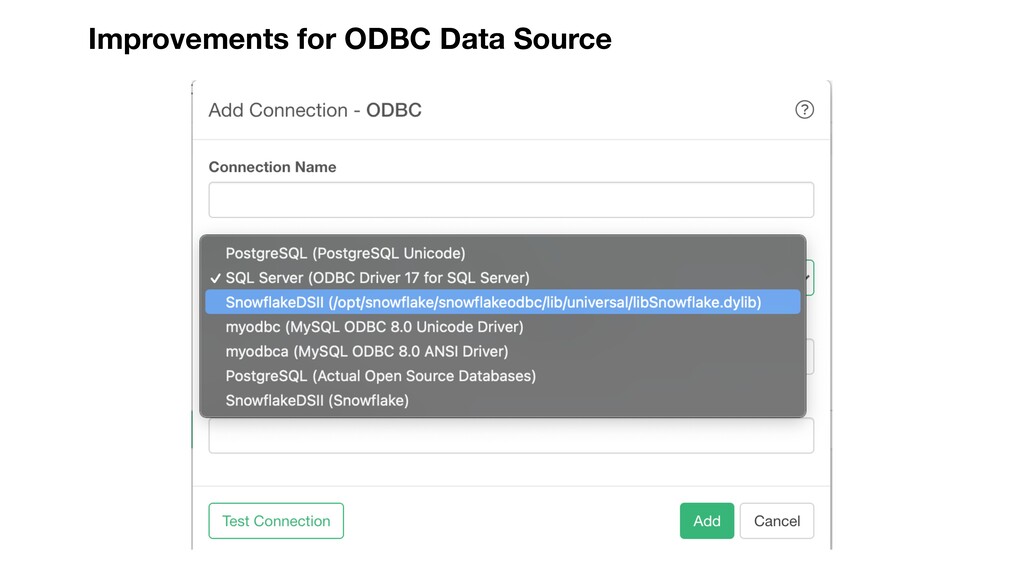
- Improvements on ODBC Data Source
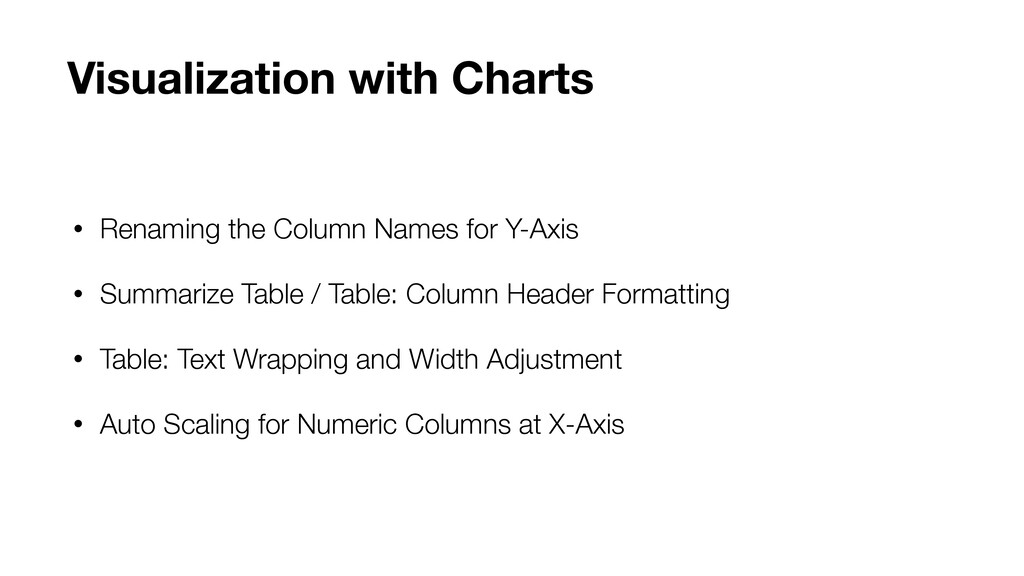
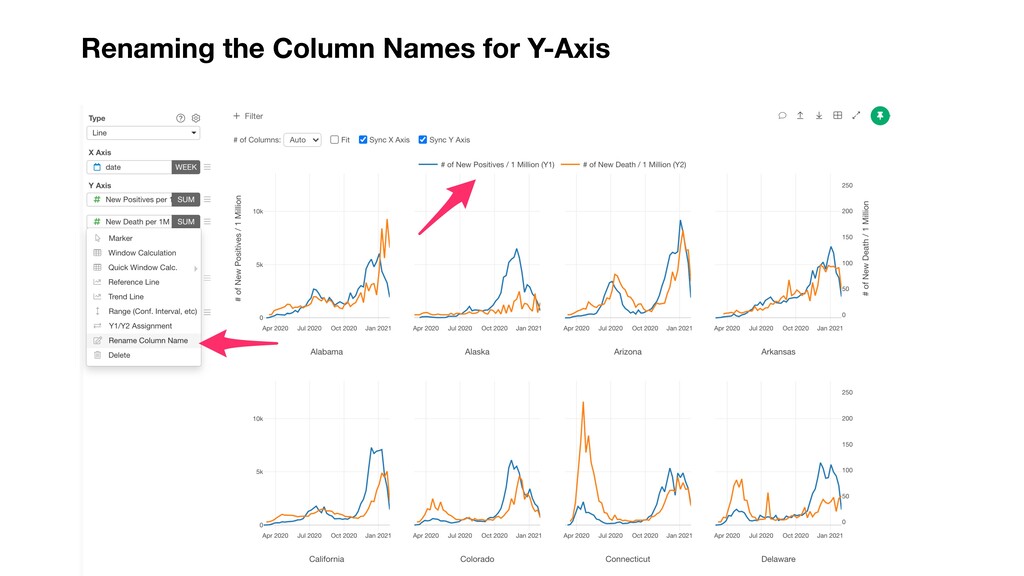
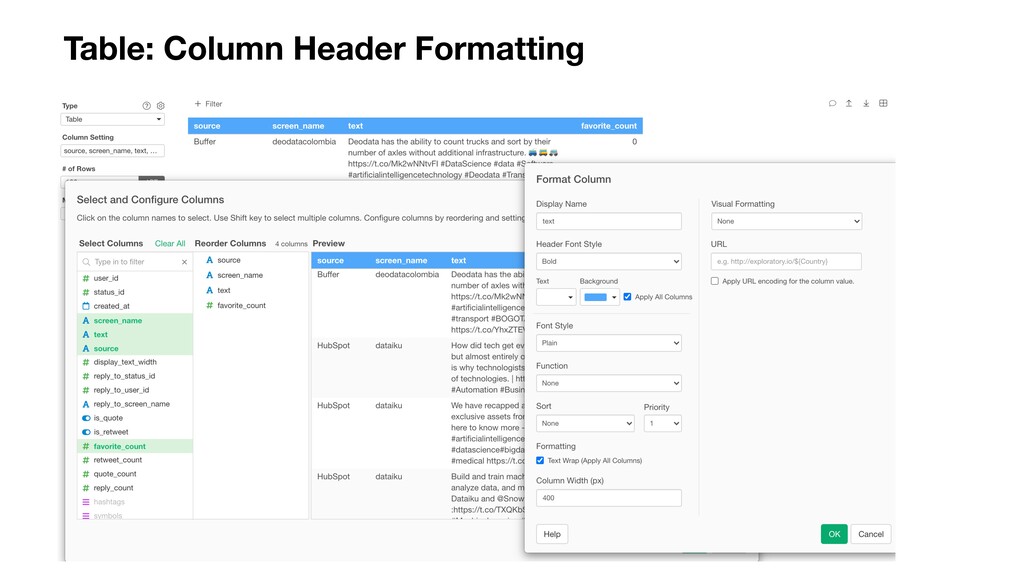
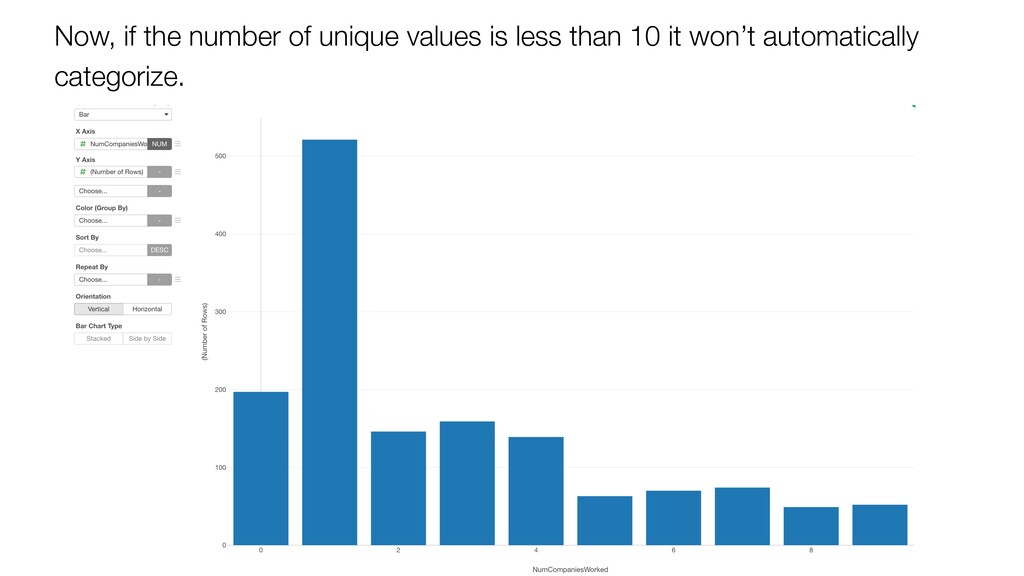
- Chart: Rename on Y-Axis Column Names

Exploratory: https://exploratory.io/

Follow us at @ExploratoryData (https://twitter.com/ExploratoryData) !!

Kan Nishida

February 10, 2021
Tweet

More Decks by Kan Nishida

Other Decks in Technology

Transcript

  1. Kan Nishida CEO/co-founder Exploratory Summary In Spring 2016, launched Exploratory,

    Inc. to democratize Data Science. Prior to Exploratory, Kan was a director of product development at Oracle leading teams to build various Data Science products in areas including Machine Learning, BI, Data Visualization, Mobile Analytics, Big Data, etc. While at Oracle, Kan also provided training and consulting services to help organizations transform with data. @KanAugust Speaker
  2. 3 Data Science is not just for Engineers and Statisticians.

    Exploratory makes it possible for Everyone to do Data Science. The Third Wave
  3. 4 Questions Communication Data Access Data Wrangling Visualization Analytics (Statistics

    / Machine Learning) Data Analysis Data Science Workflow
  4. 5 Questions Communication (Dashboard, Note, Slides) Data Access Data Wrangling

    Visualization Analytics (Statistics / Machine Learning) Data Analysis ExploratoryɹModern & Simple UI
  5. • Summary View • Analytics • Visualization with Chart •

    Data Wrangling • Reporting - Dashboard • Data Source Areas of New Features / Enhancements
  6. • Time Series Clustering • Time Series Forecasting with Prophet

    - Monthly, Quarterly Seasonality Support • Prediction with Survival Models • Sample Size Setting Analytics
  7. Dynamic Time Warping is used to compare the similarity or

    calculate the distance between two time series data with different length and speed. Dynamic Time Warping
  8. If we apply the one-to-one match, shown in the top,

    the mapping is not perfectly synced up and the tail of the blue curve is being left out.
  9. DTW creates one-to-many matches so that the peaks and bottoms

    with the same pattern are perfectly matched, and there is no left out for both curves(shown in the bottom top).
  10. Calculating Distance in a Naive Way • Calculate the distance

    on each date and time point. • But, when the two lines have a lag the distance can be over- calculated.
  11. Create one-to-many matches so that the total distance can be

    minimized between the two time series data. Calculating Distance with Dynamic Time Warping (DTW)
  12. Prediction with Survival Models - Survival Random Forest / Cox

    Regression Now, you can predict the probability of survival for each individual by using the model - Survival Random Forest and Cox Regression - you have created under the Analytics view.
  13. Sample Size Setting You can set the sample size easier

    now. You no longer need to open the property dialog!
  14. • Renaming the Column Names for Y-Axis • Summarize Table

    / Table: Column Header Formatting • Table: Text Wrapping and Width Adjustment • Auto Scaling for Numeric Columns at X-Axis Visualization with Charts
  15. You can change it to ‘As Number’ to make all

    the unique values have their own bars.
  16. This auto-categorizing is convenient especially when you assign numeric columns

    with many unique values such as Income, Sales, etc.
  17. Now, if the number of unique values is less than

    10 it won’t automatically categorize.
  18. With Exploratory Server, you can Share, Schedule, and Interact with

    all your insights - Data, Chart, Analytics, Dashboard, Notes, and Slides. Exploratory Server
  19. • Instead of monitoring them one by one, can I

    see them all together? • How much of the allocated quota I have used so far this month? Problems