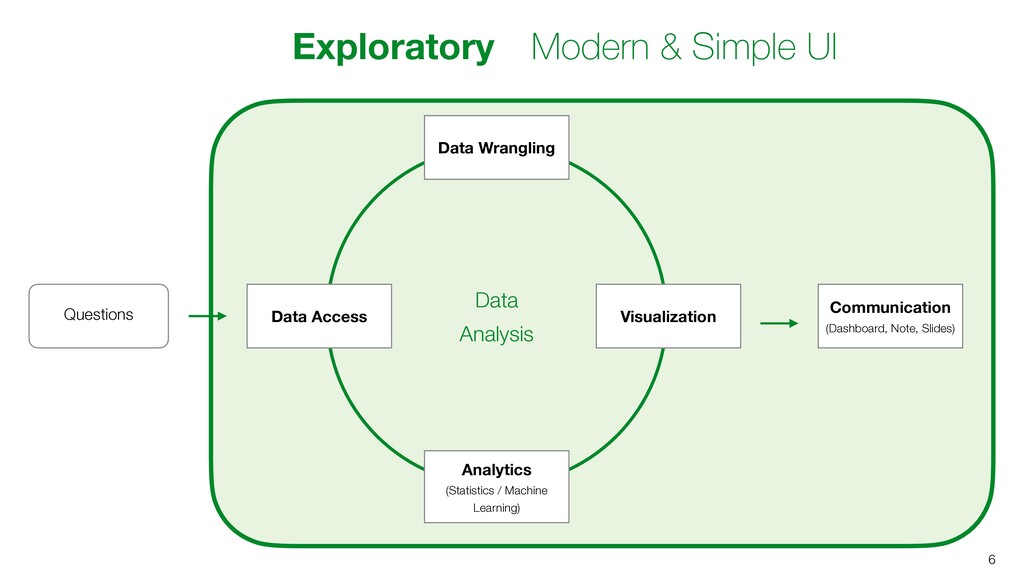
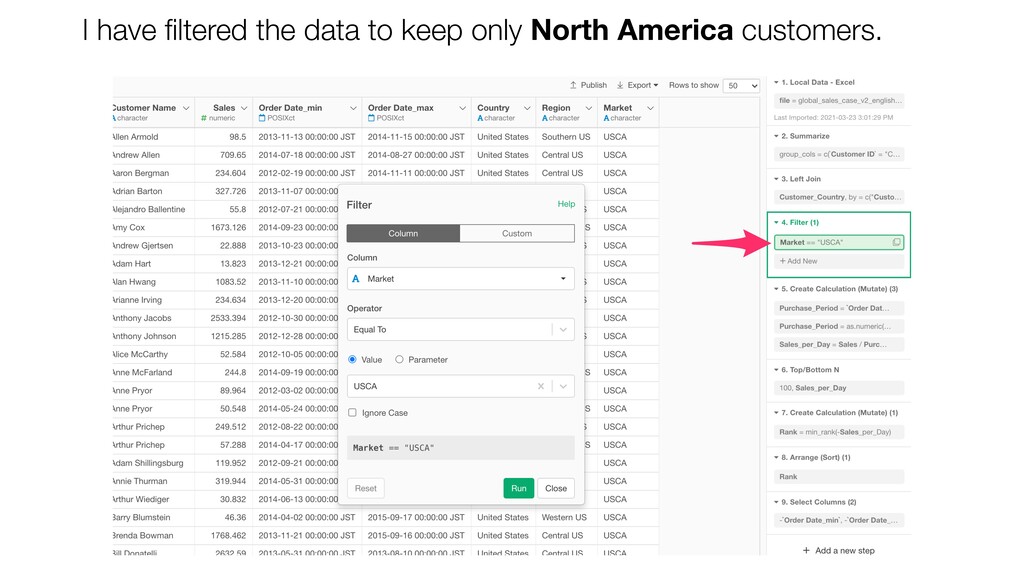
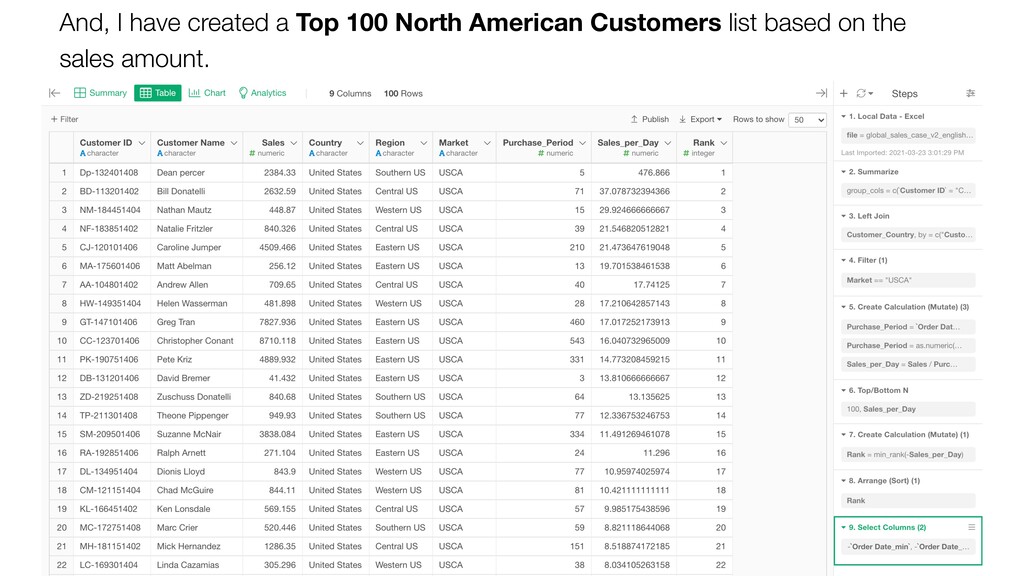
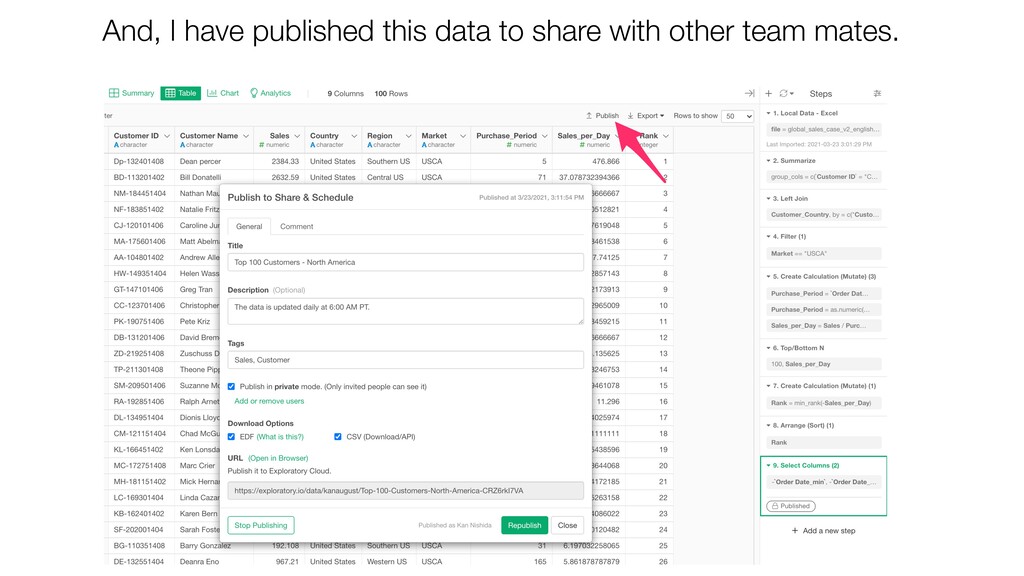
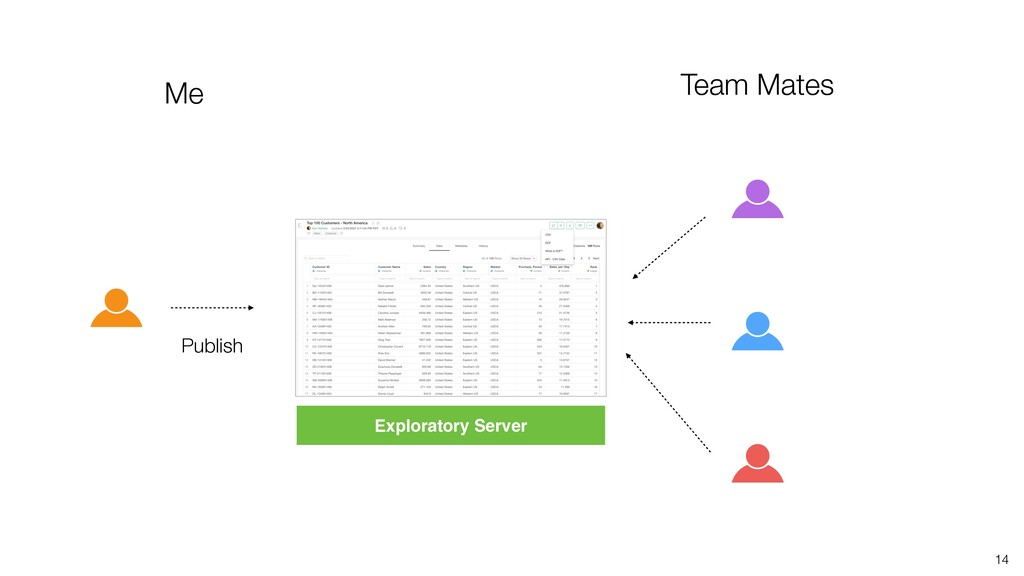
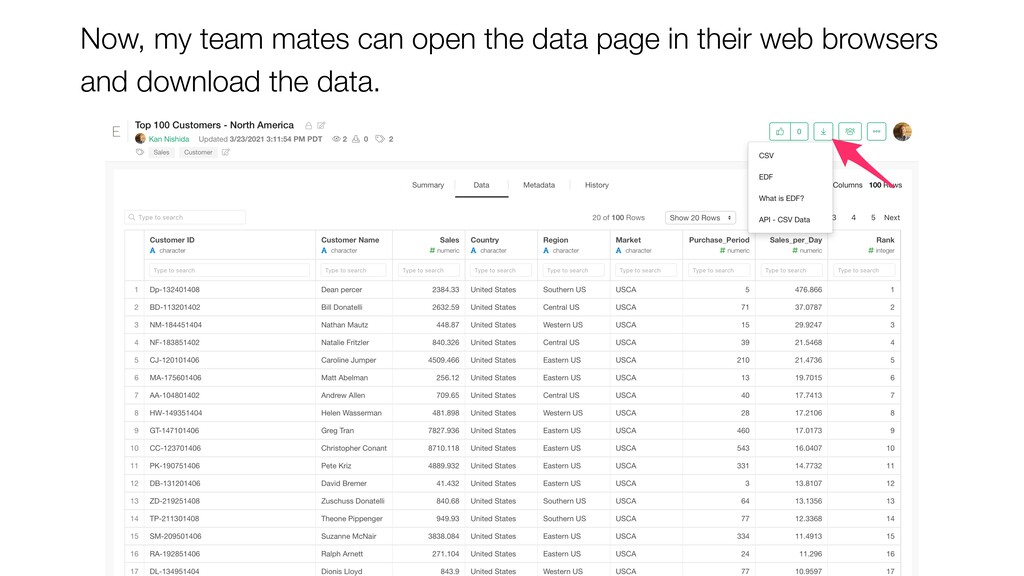
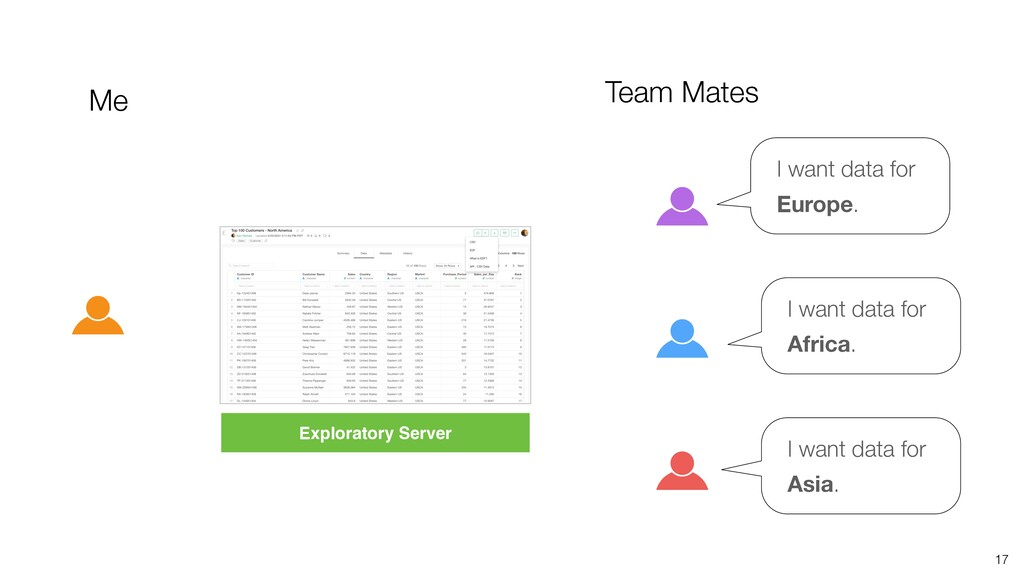
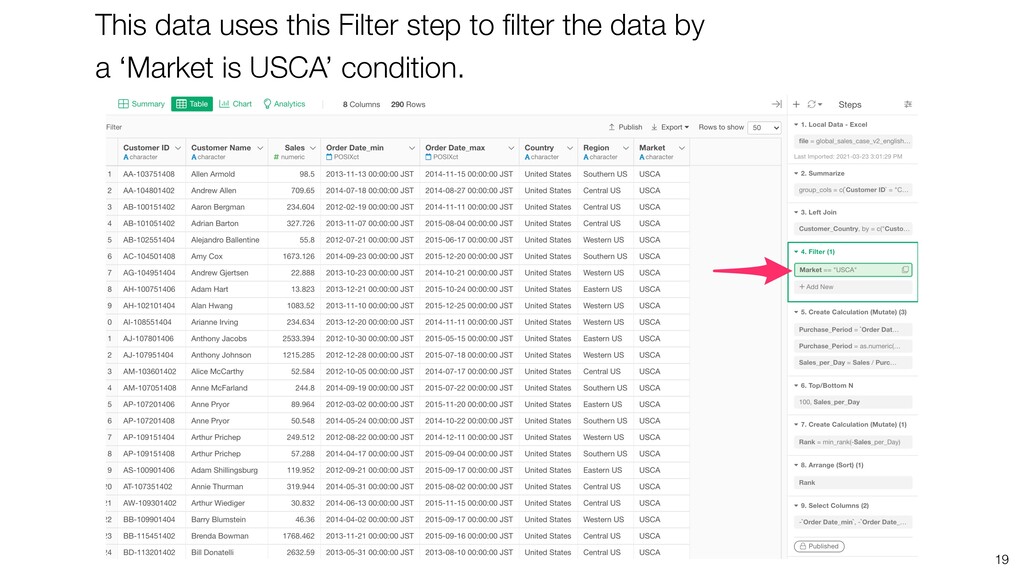
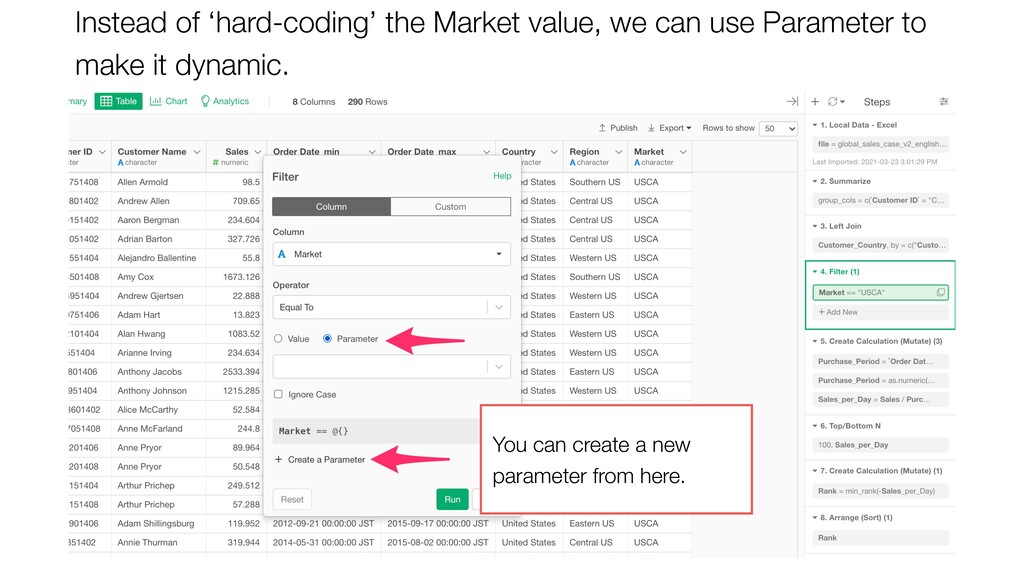
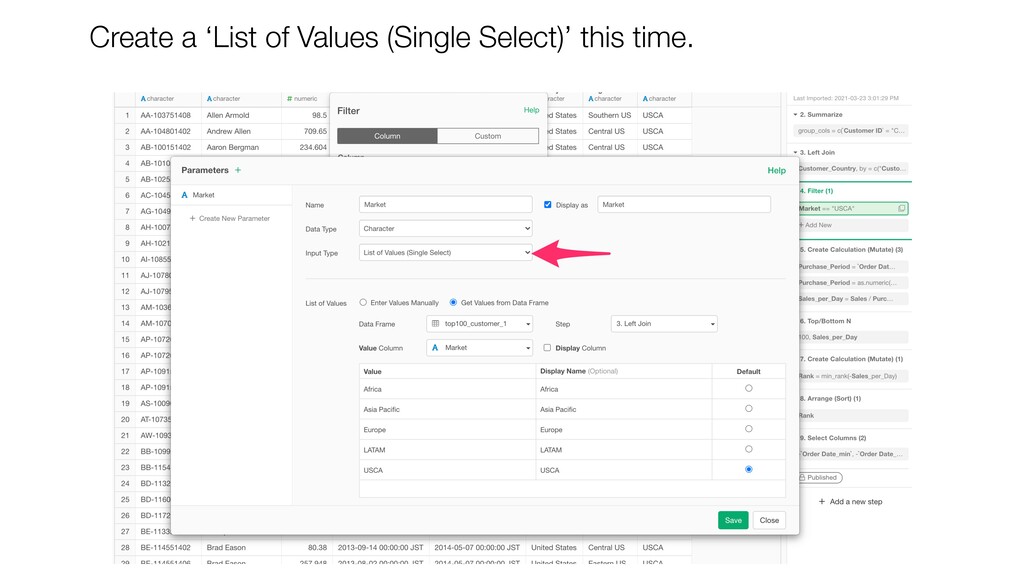
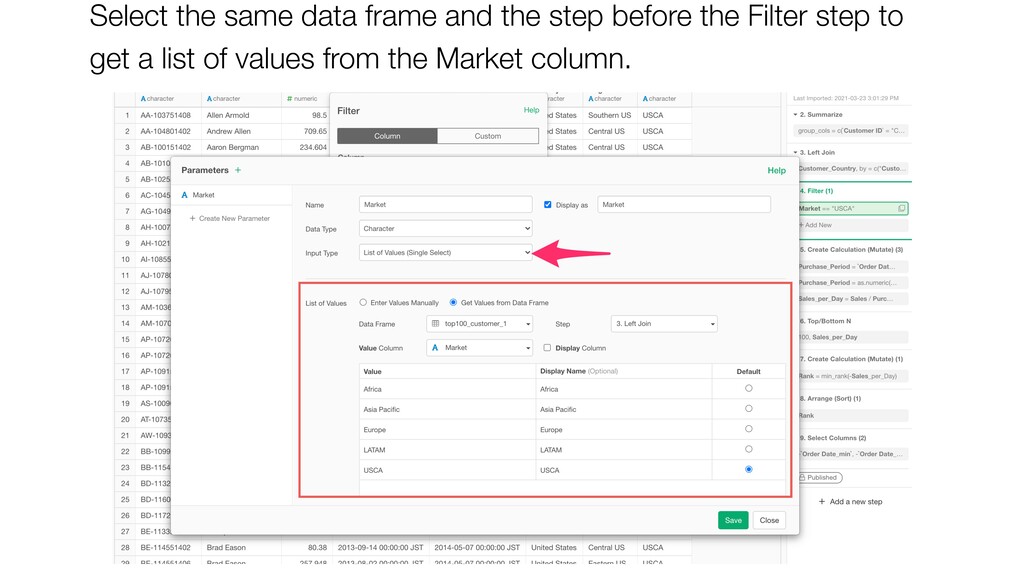
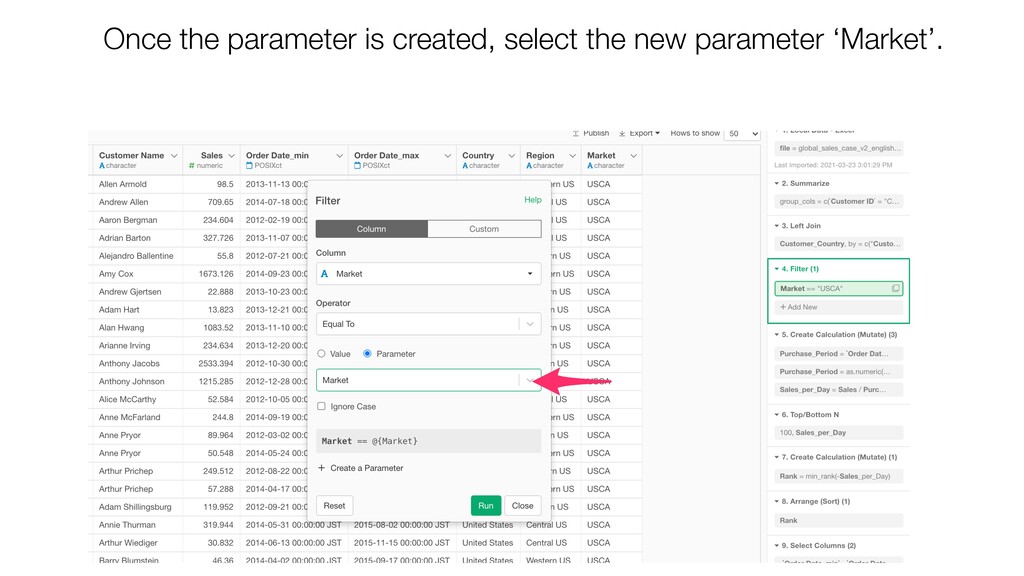
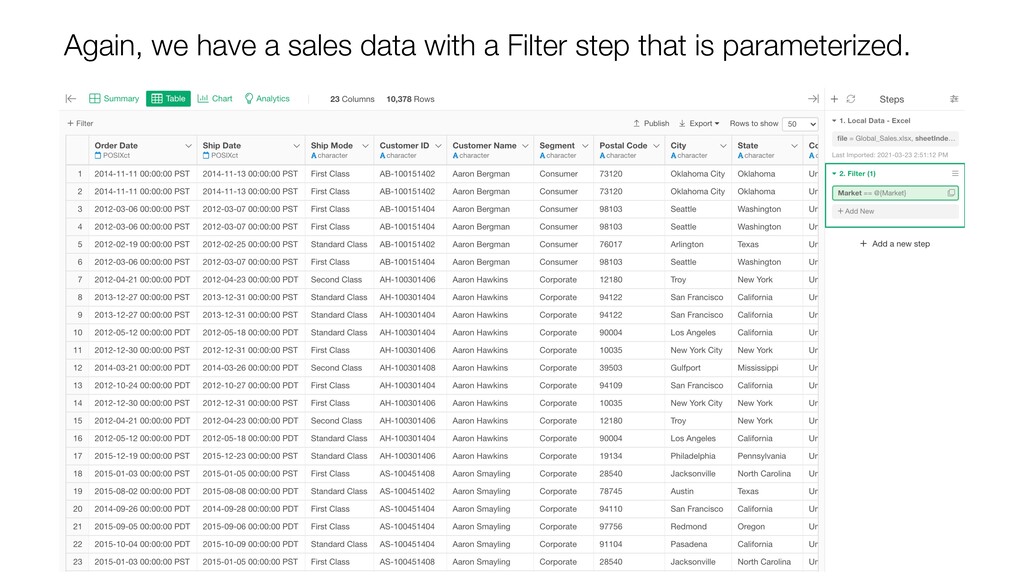
The Parameter feature is one of the strong features in Exploratory. It makes your chart, analytics, dashboard, notes, slides, and data interactive in a very flexible way. In this seminar, Kan will introduce the basics and demonstrate how to use the Parameter in the following scenarios.
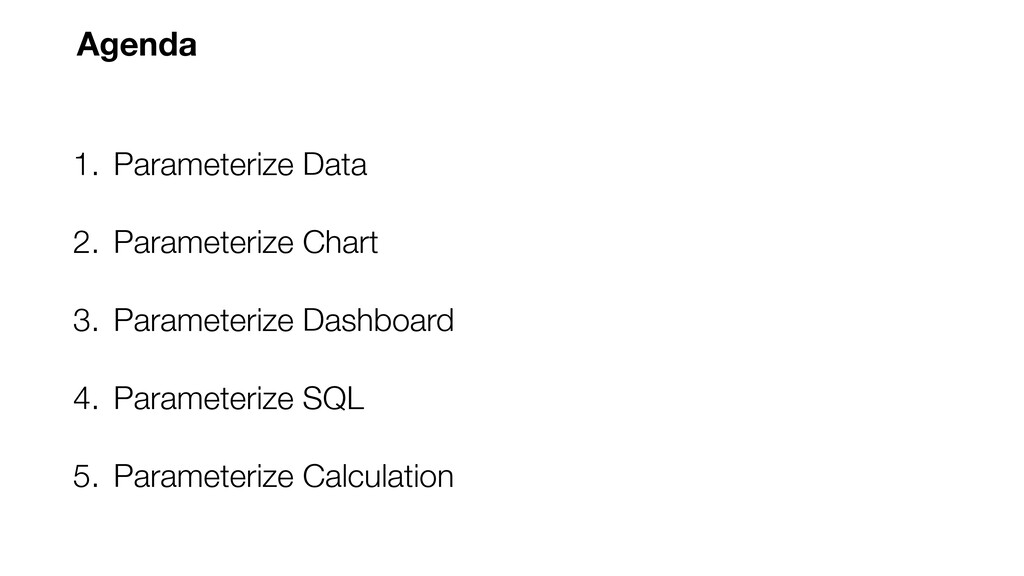
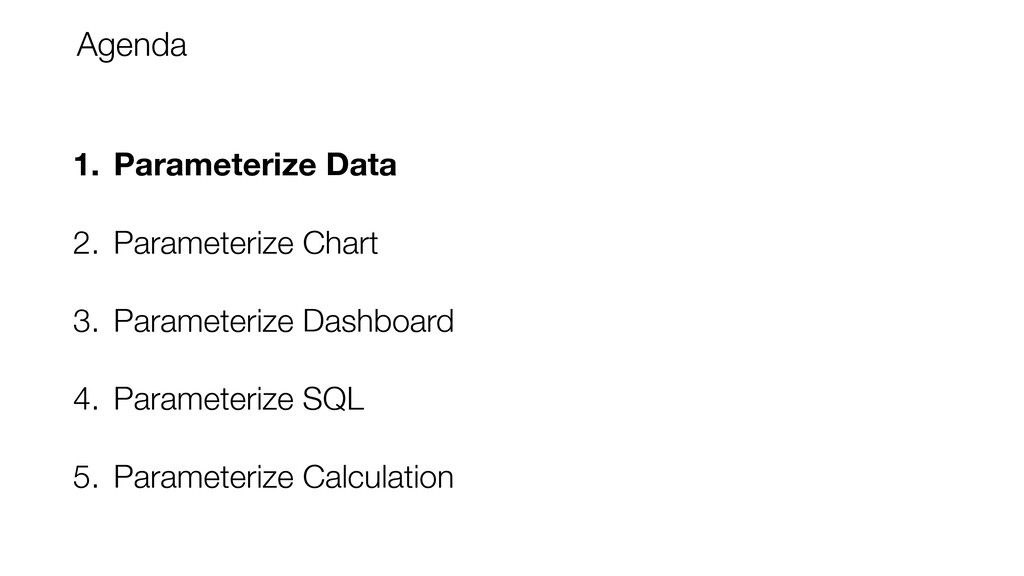
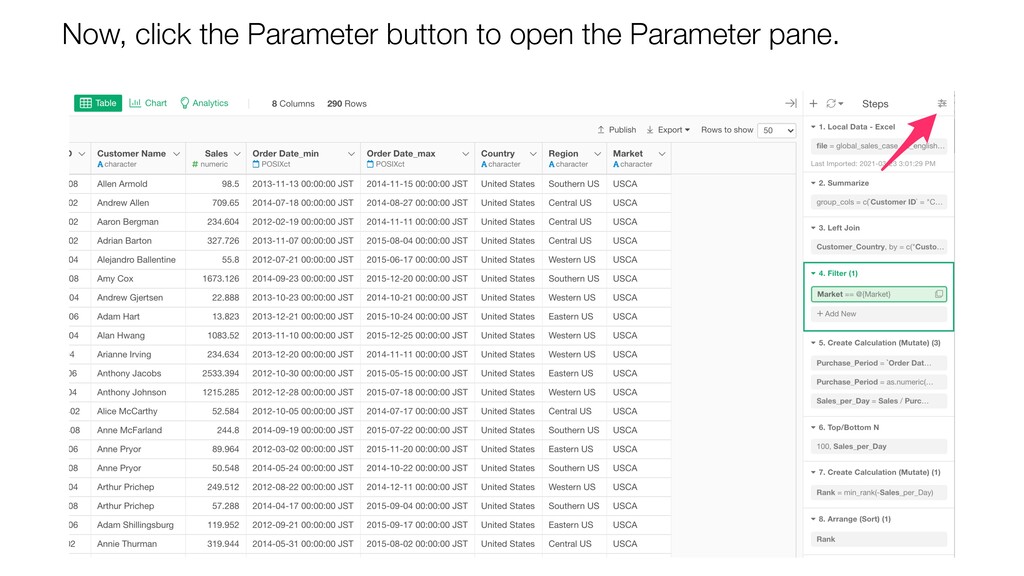
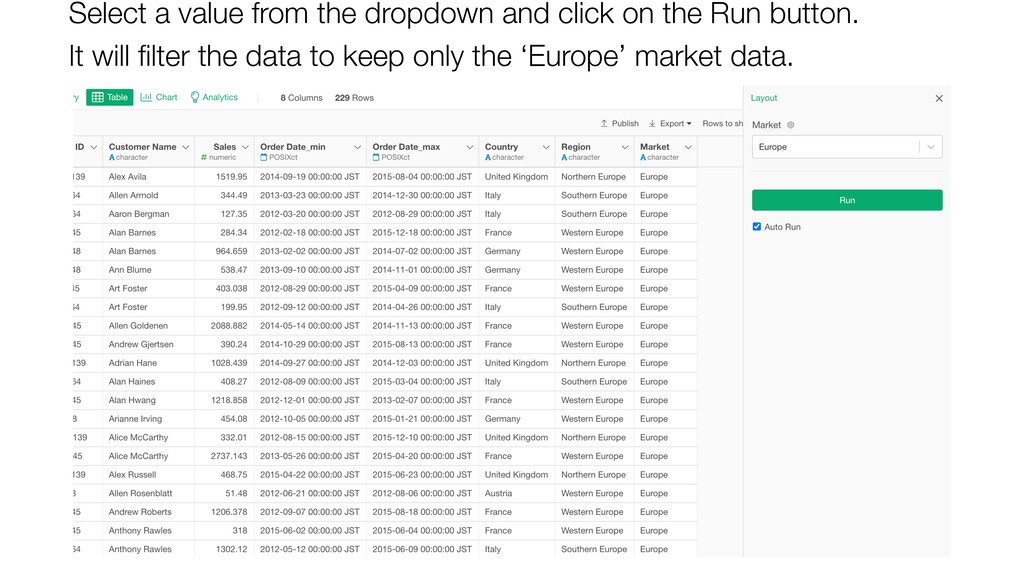
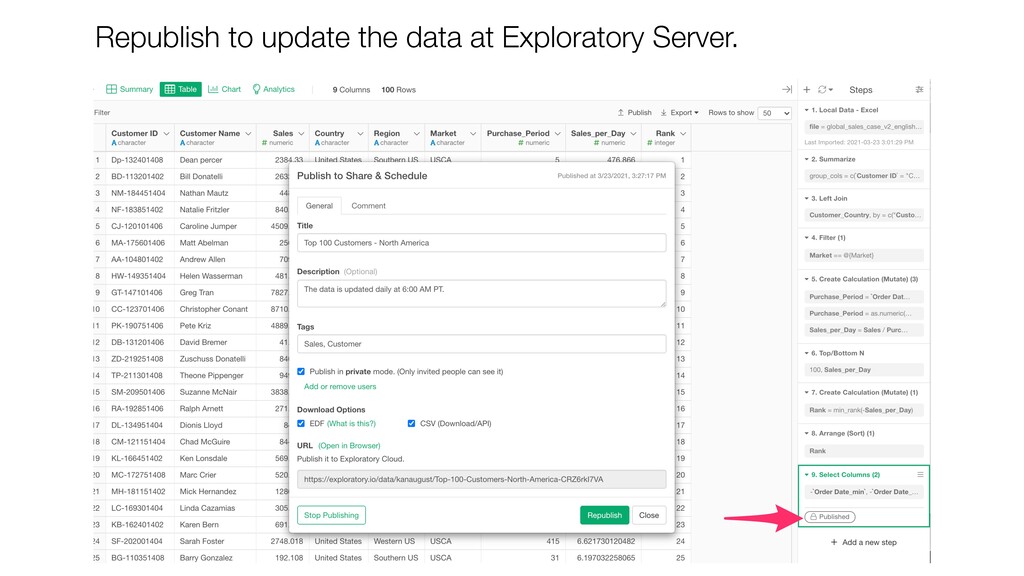
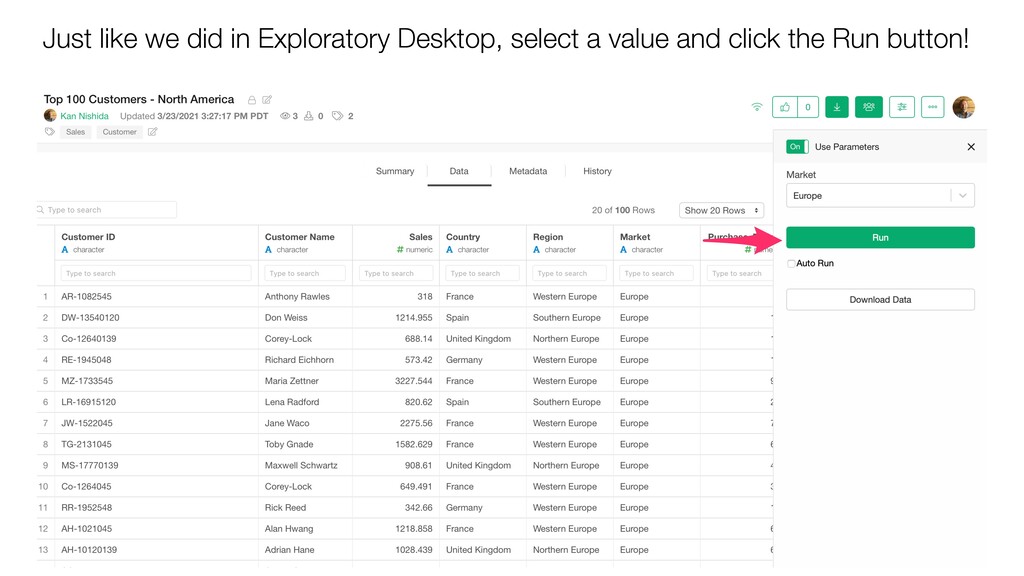
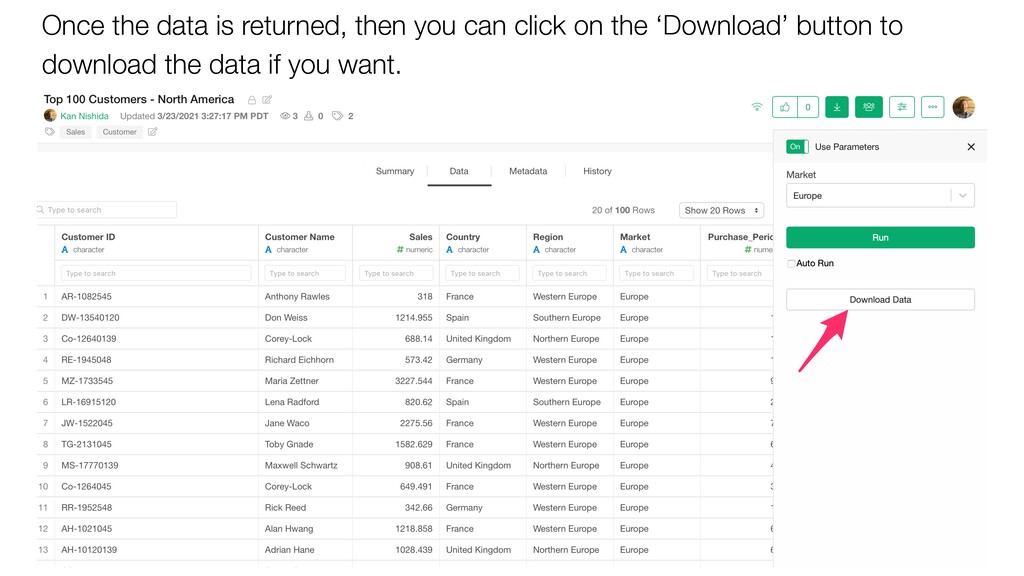
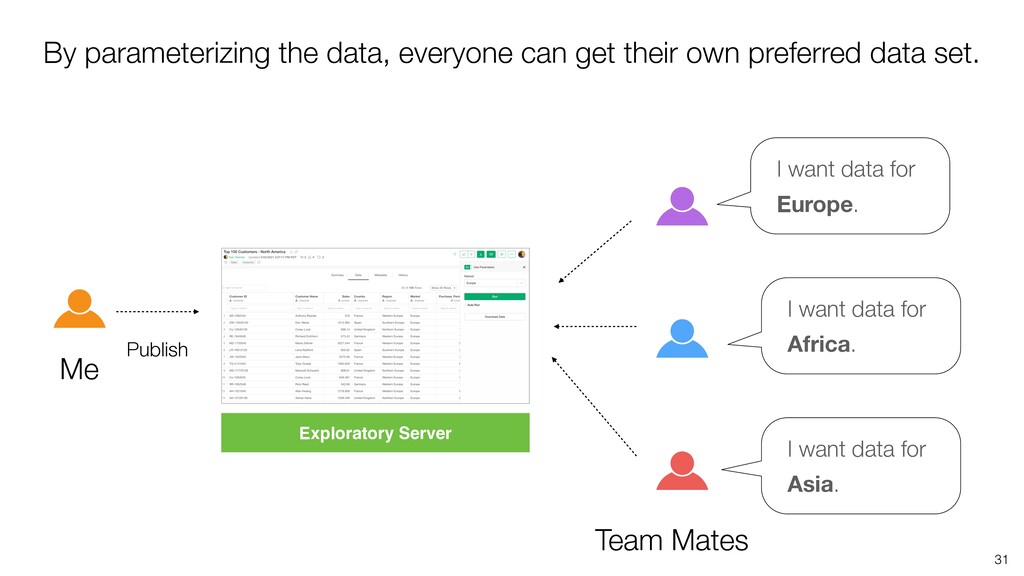
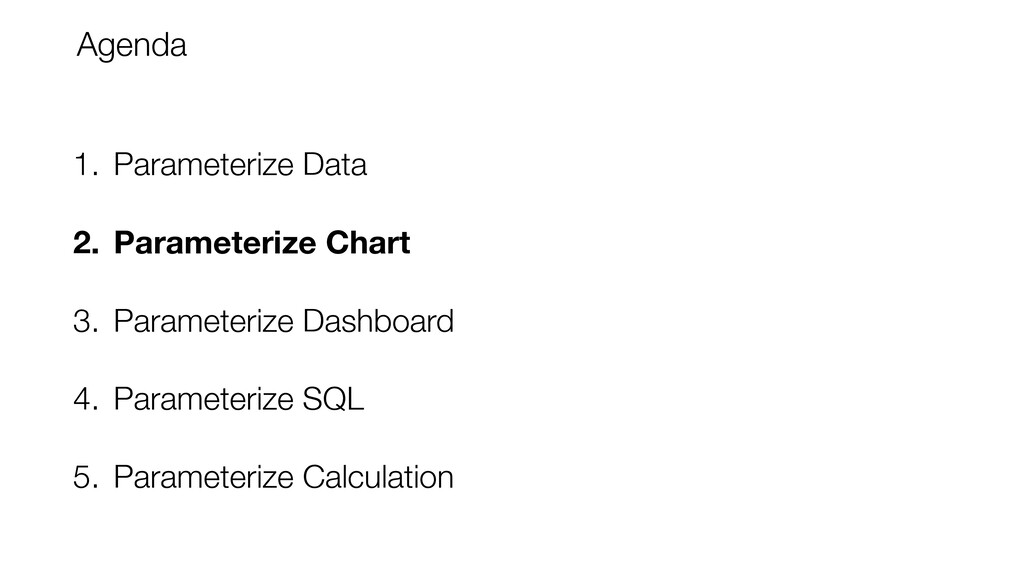
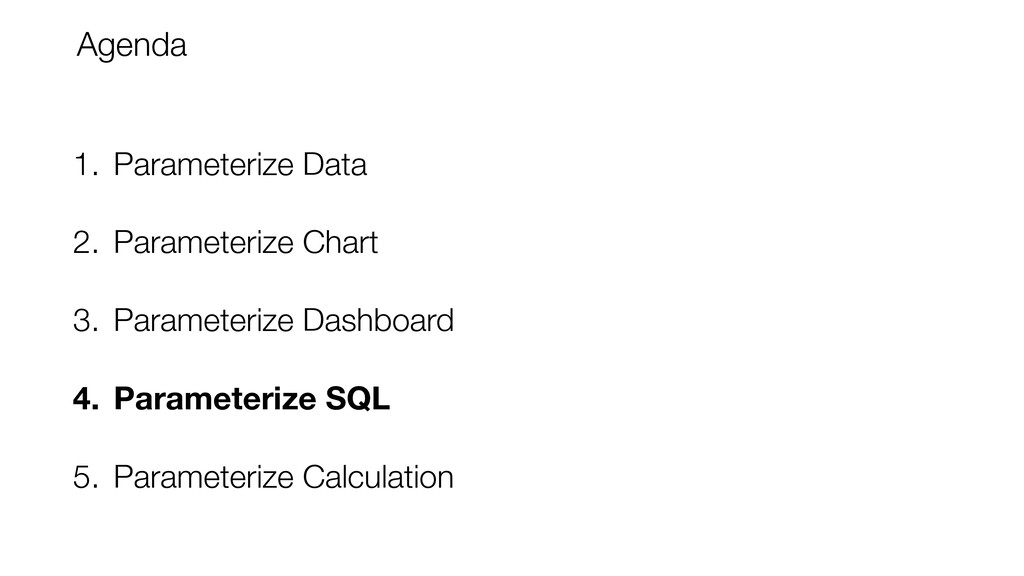
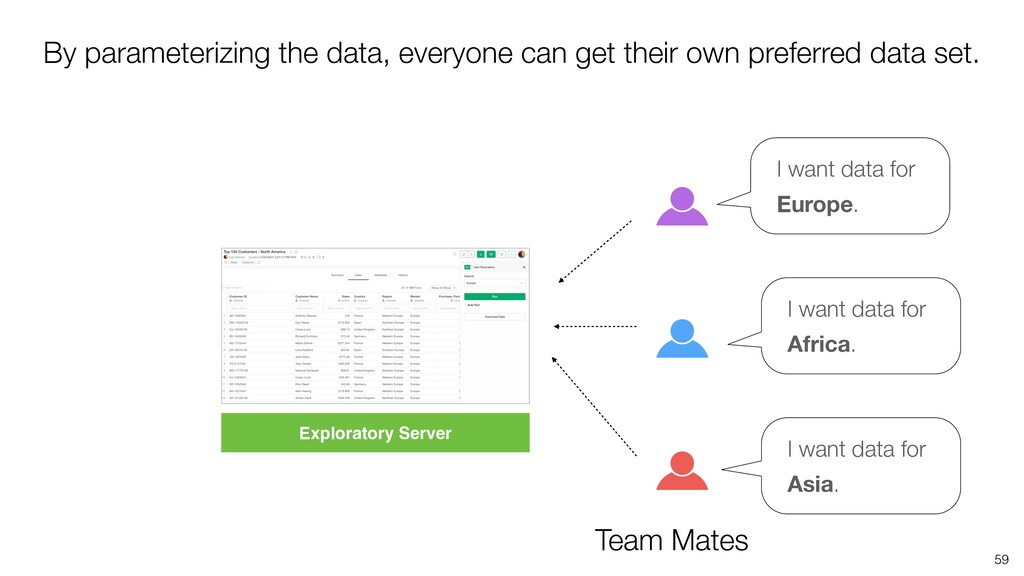
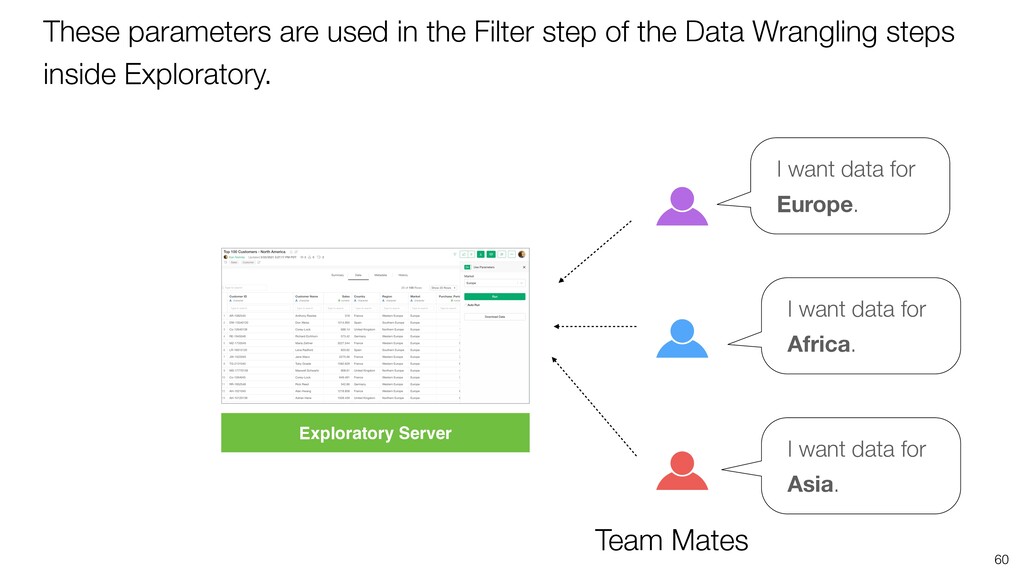
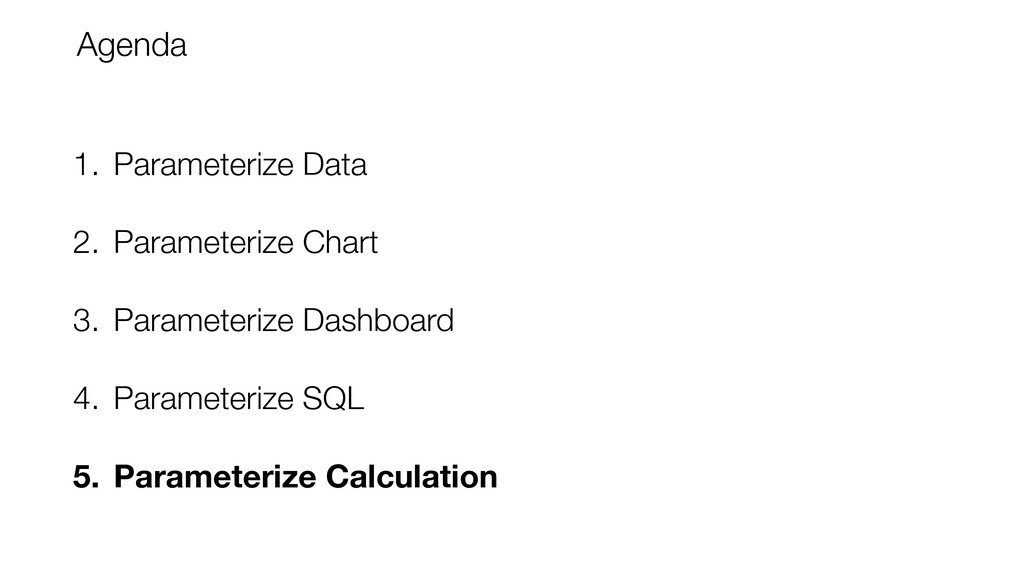
* Parameterize Data
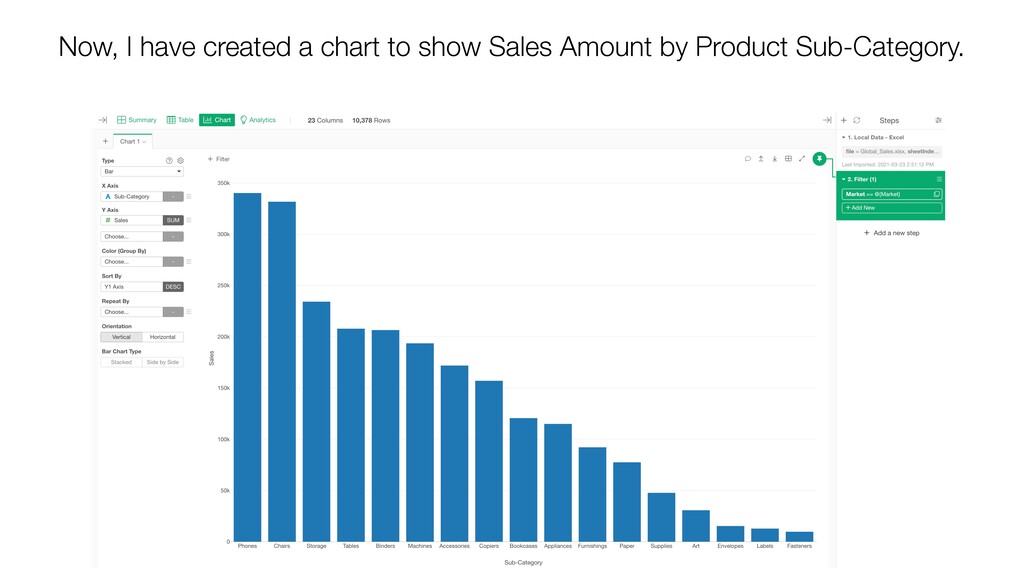
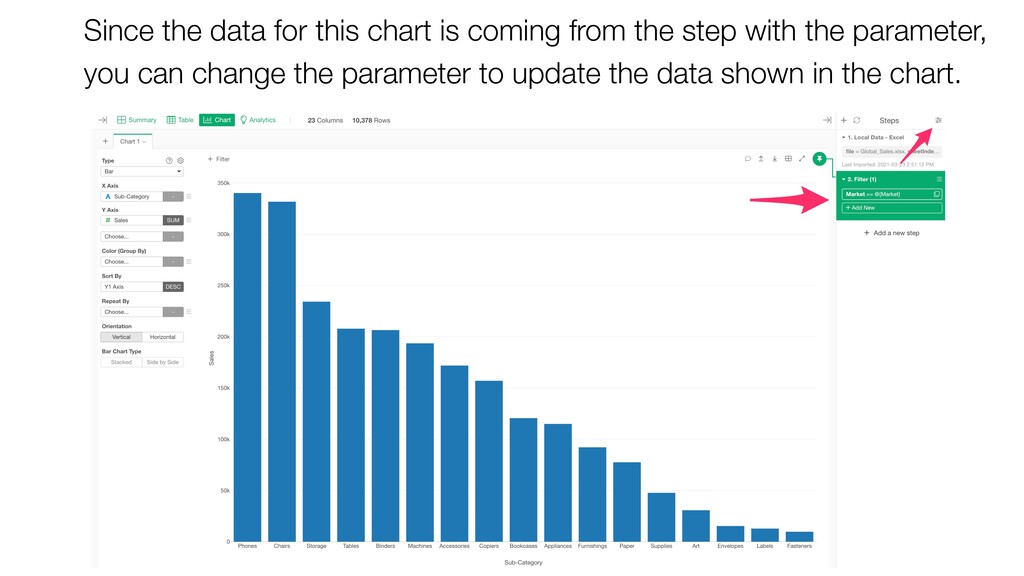
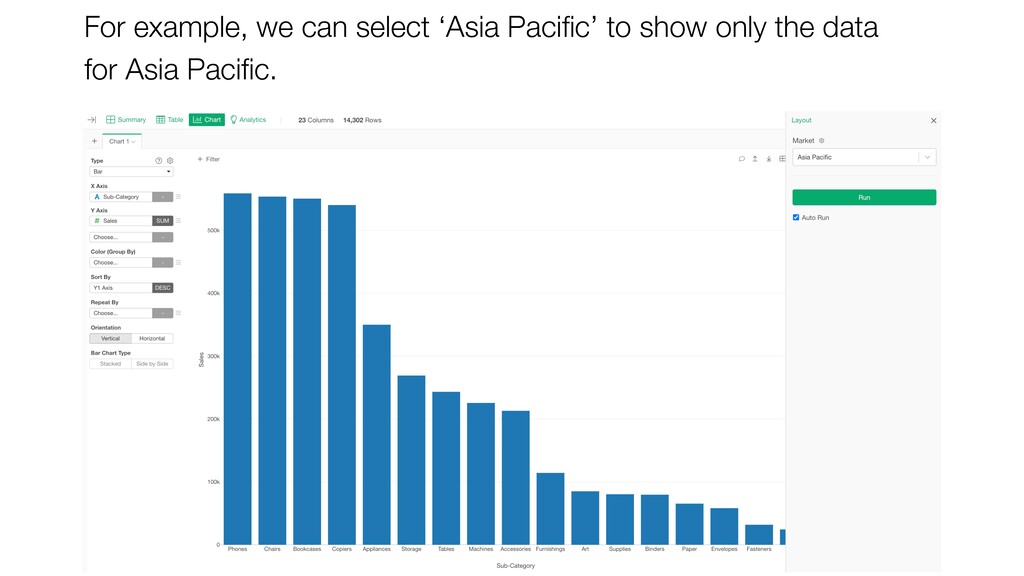
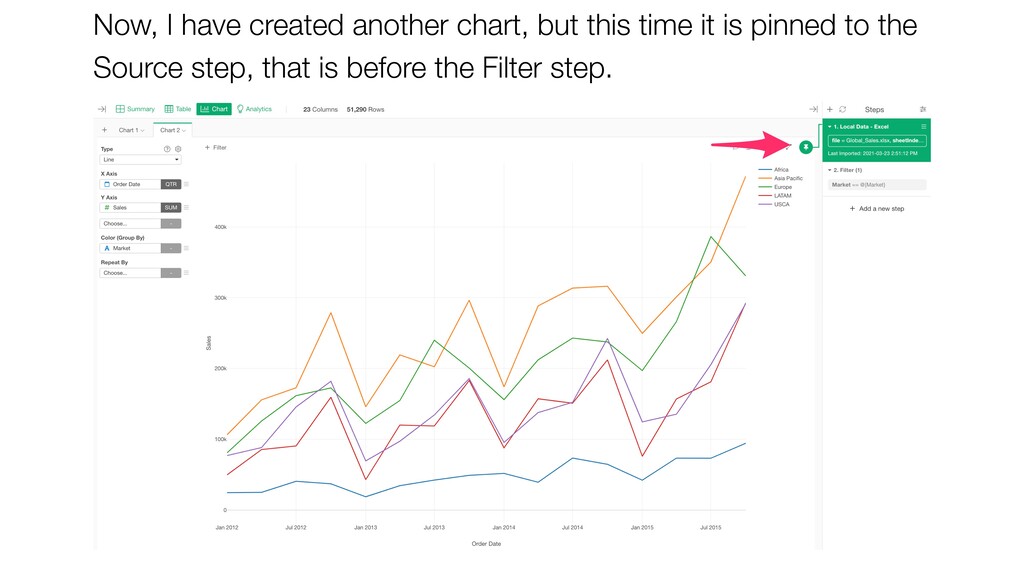
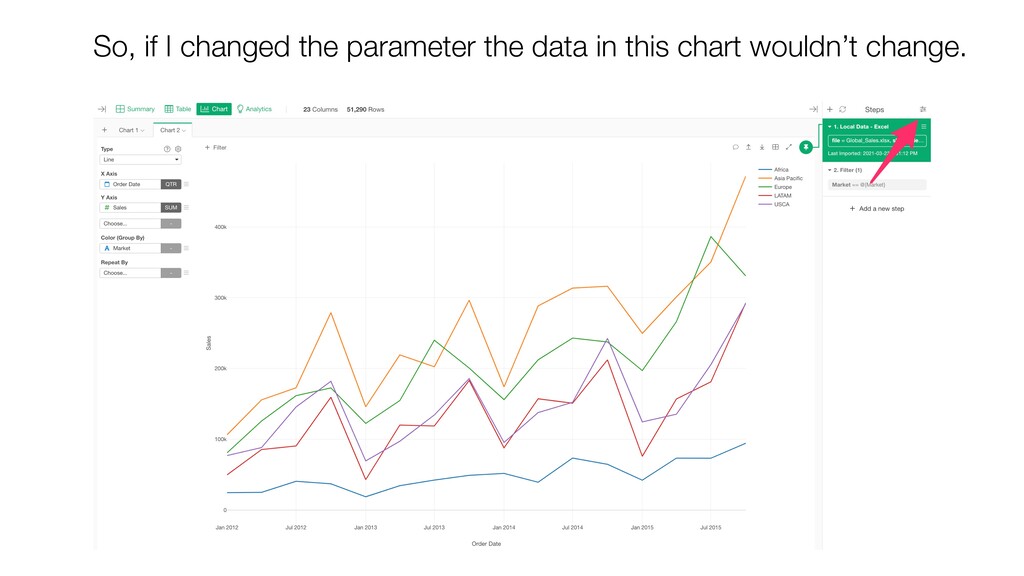
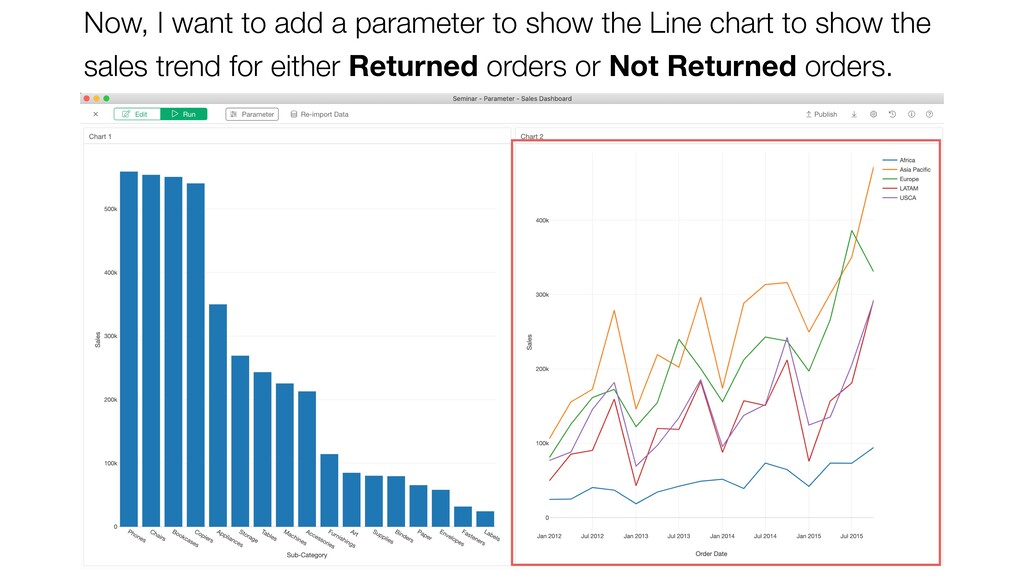
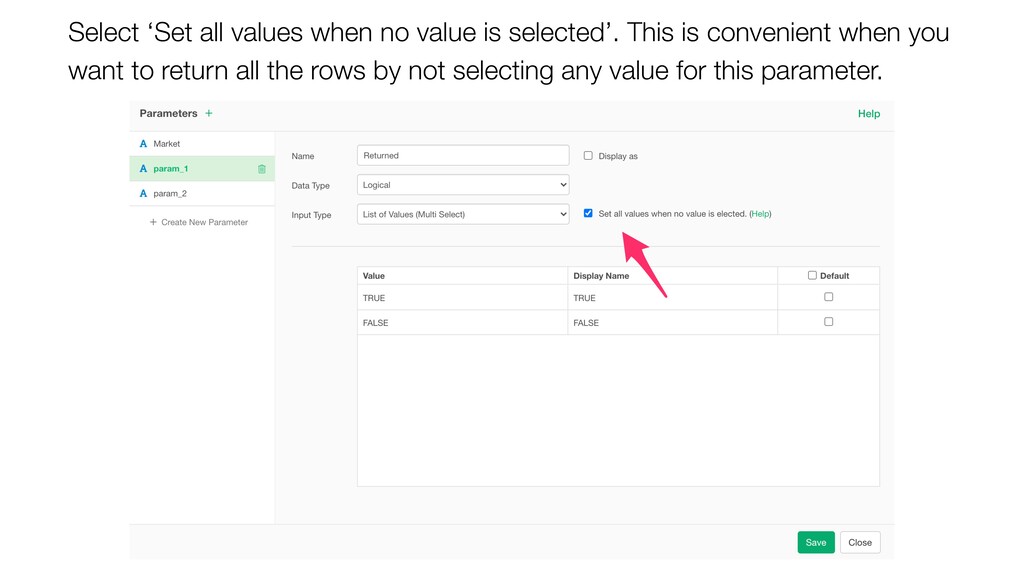
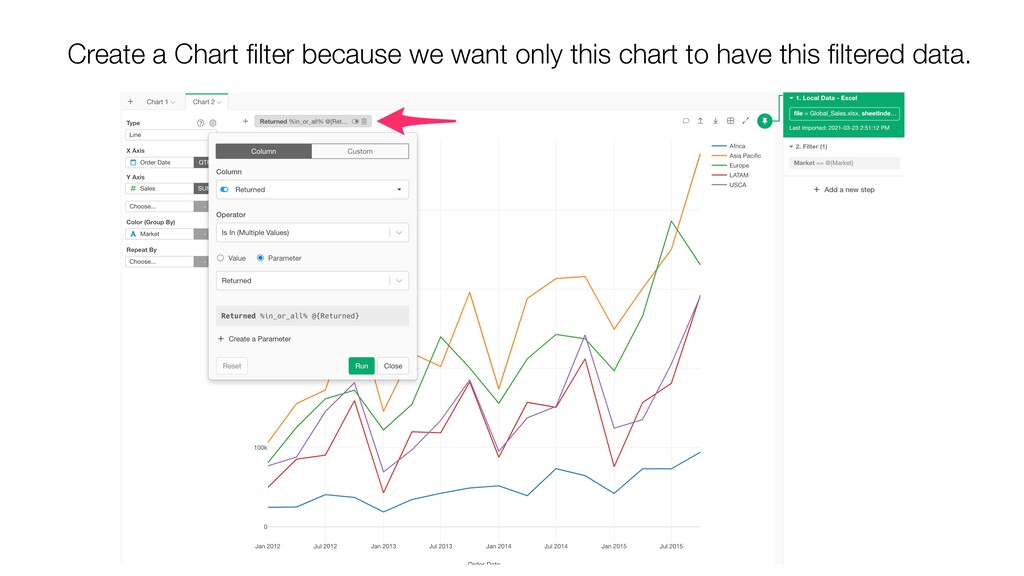
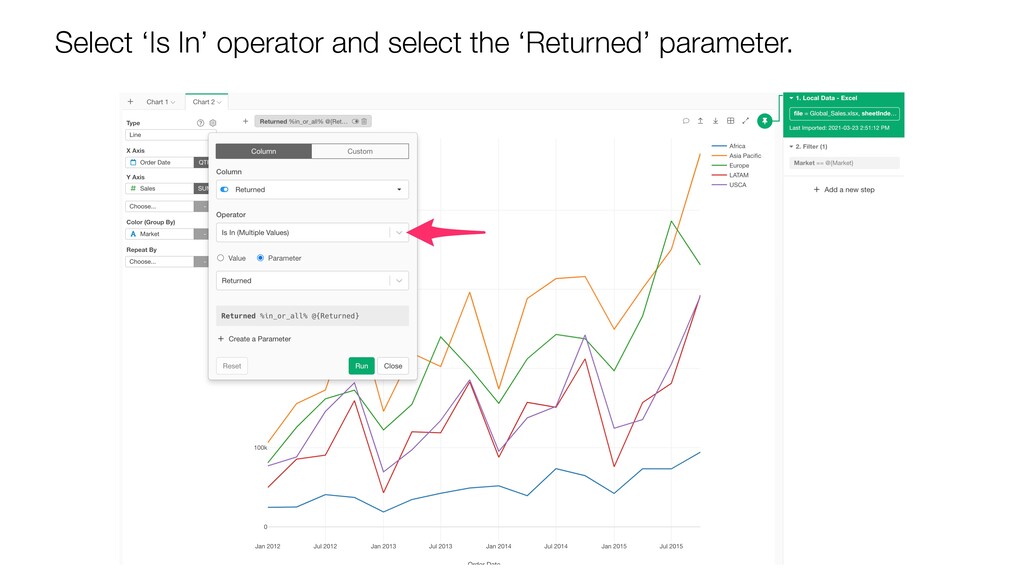
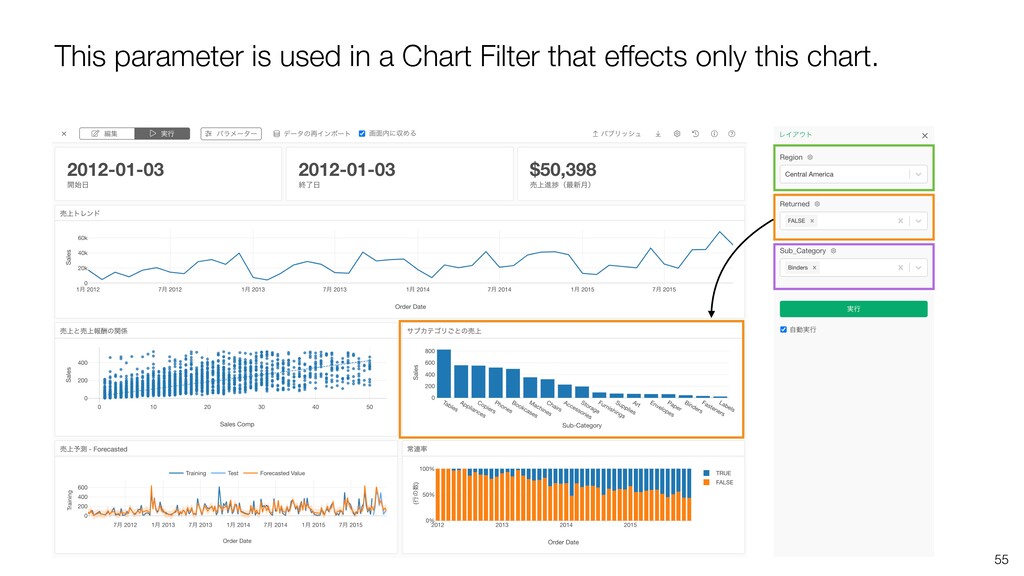
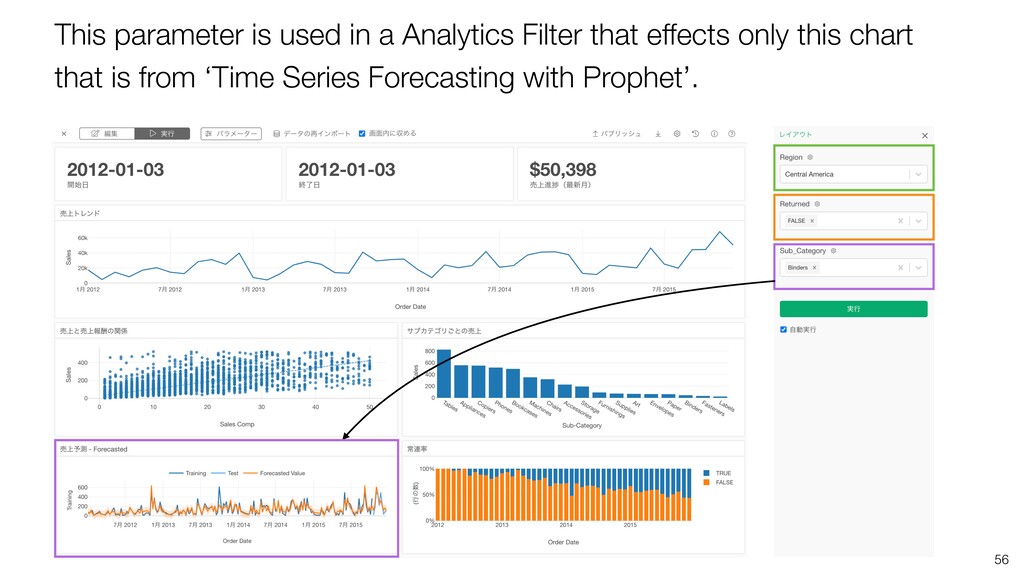
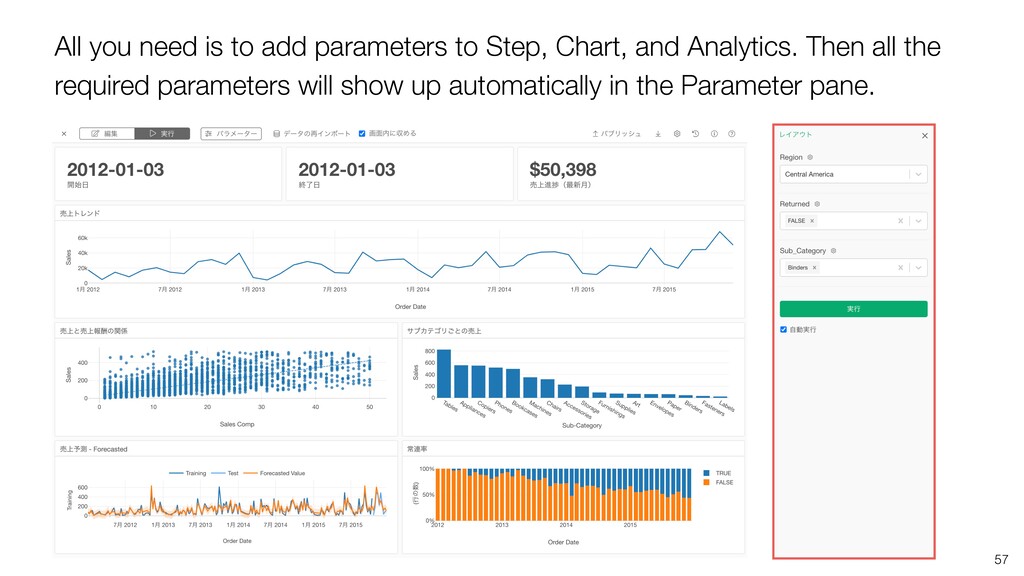
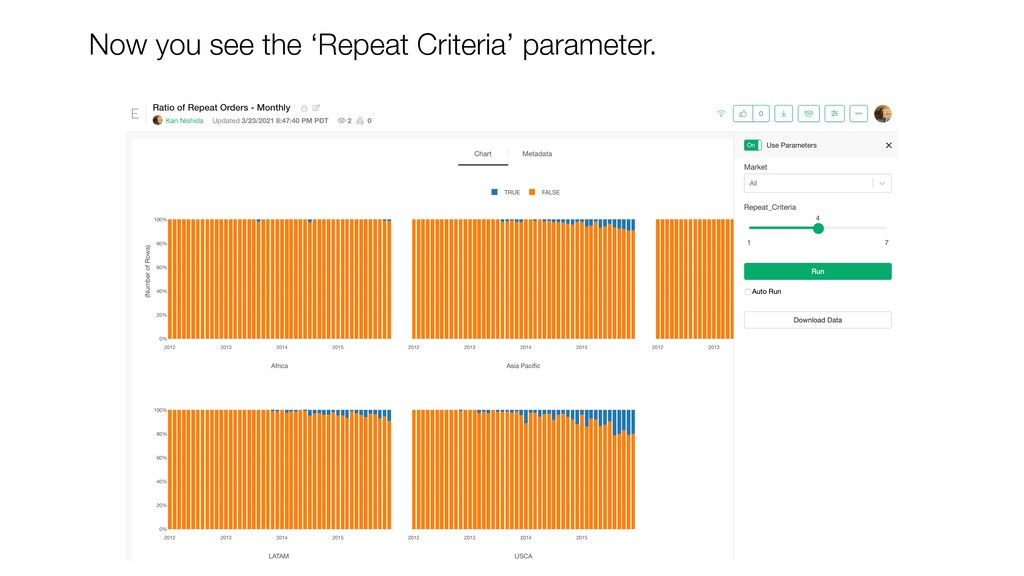
* Parameterize Chart
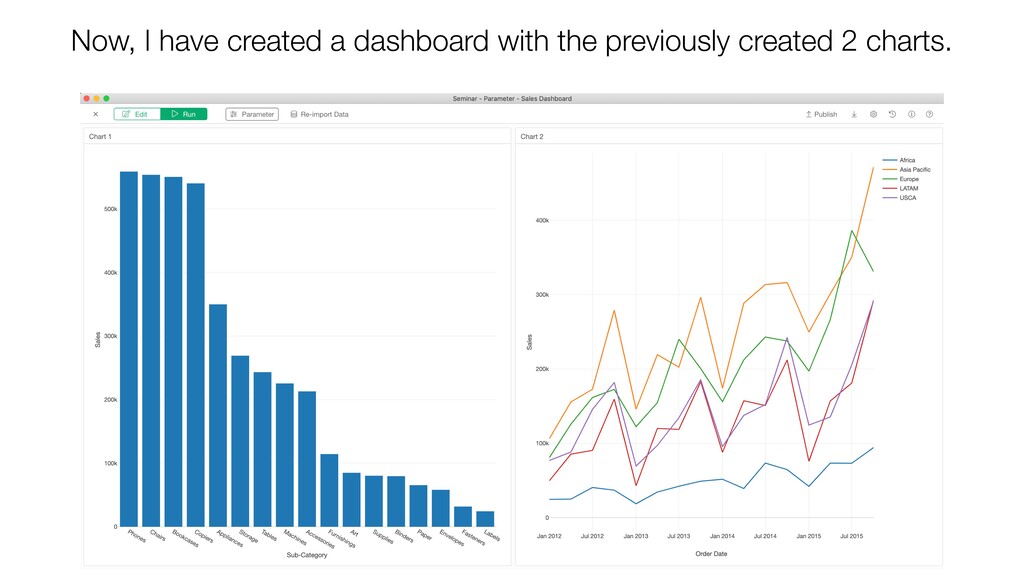
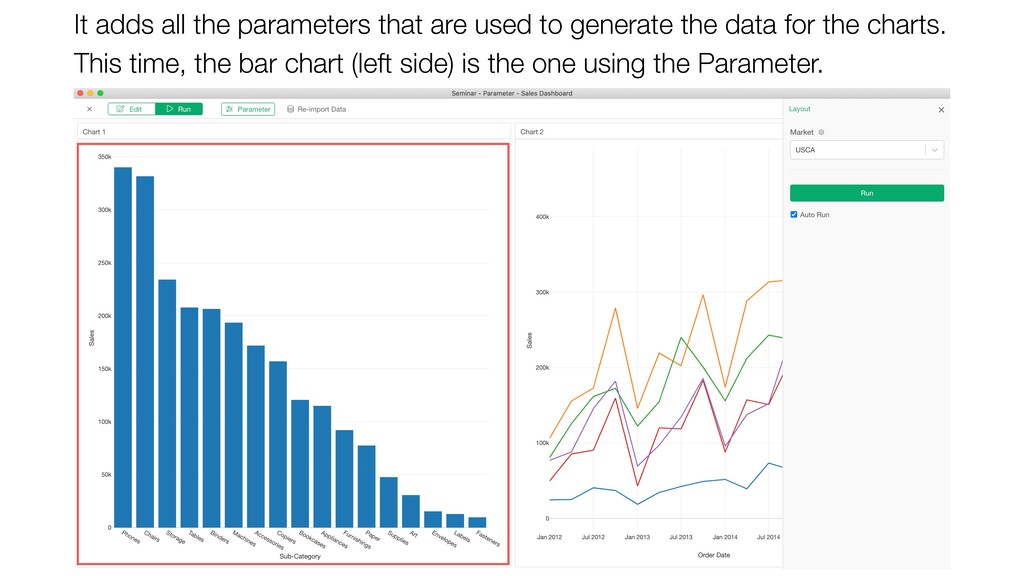
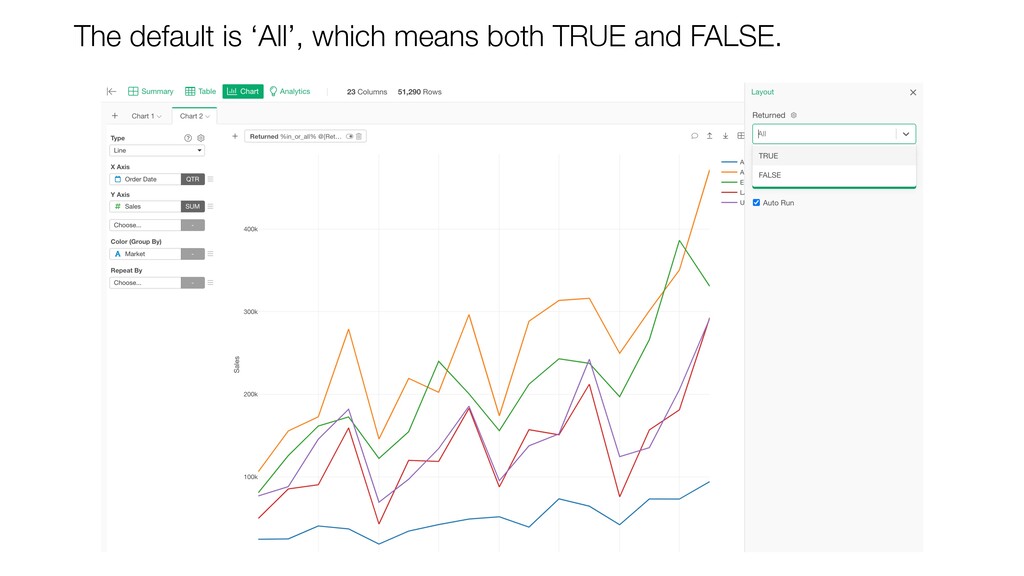
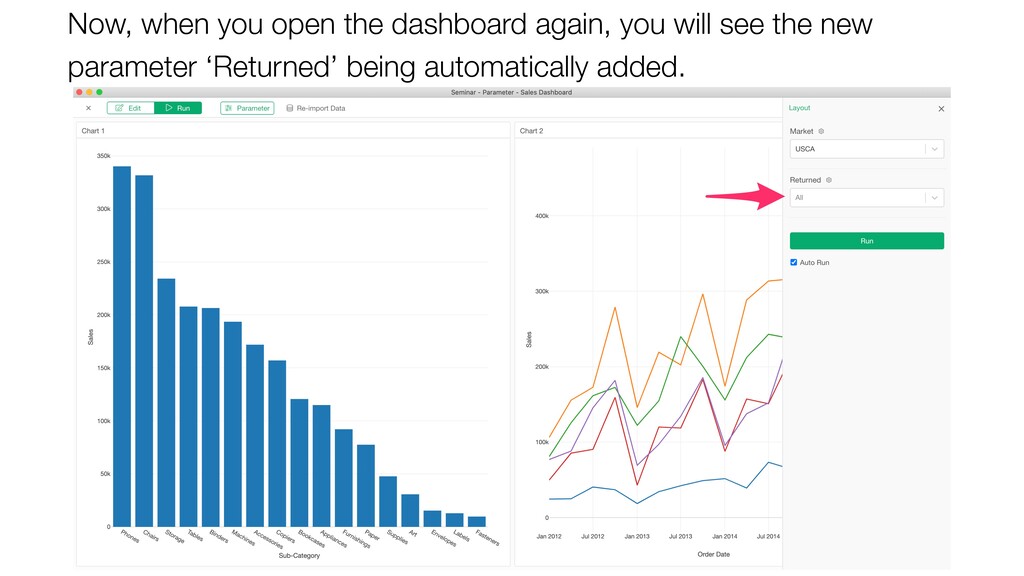
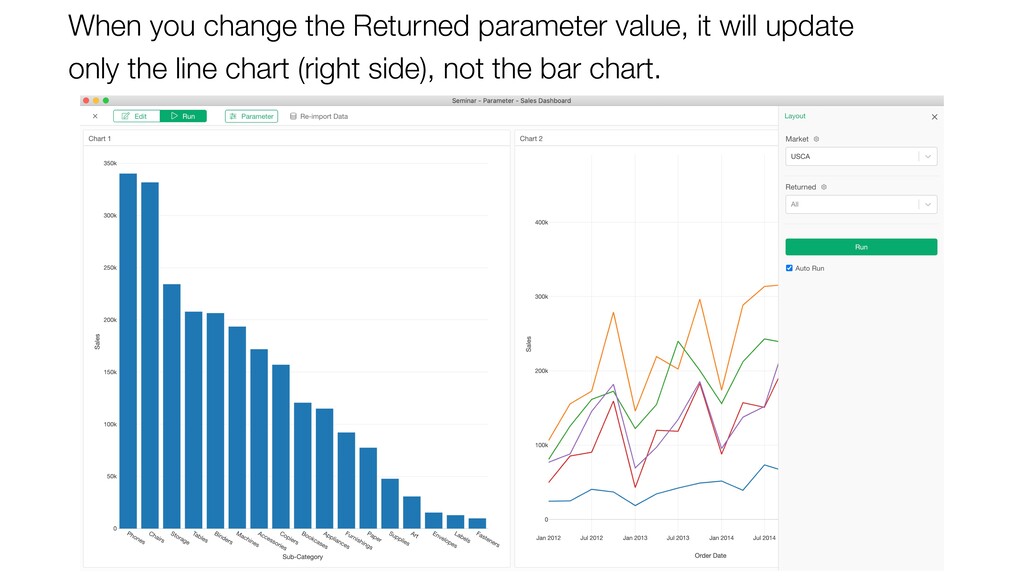
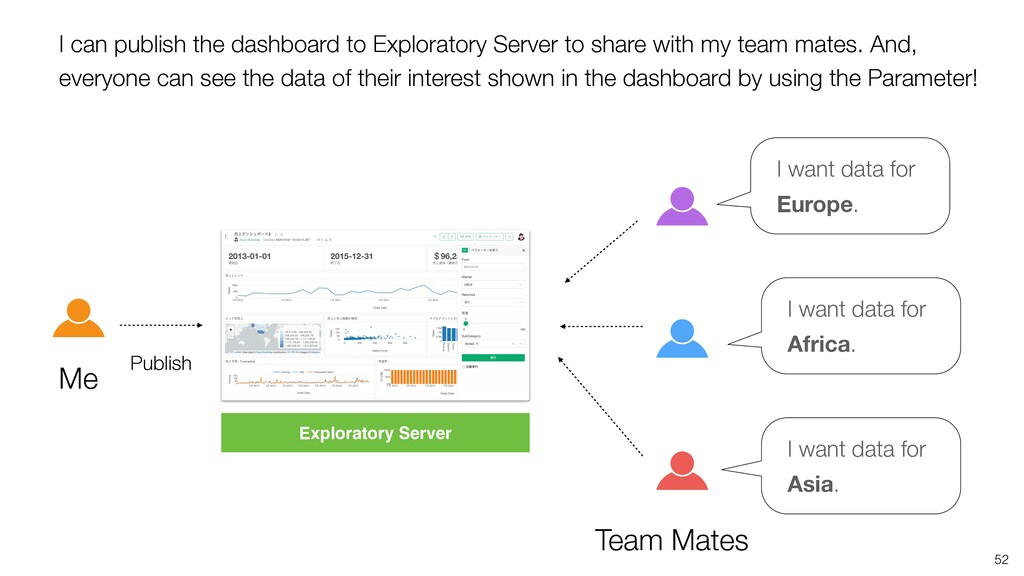
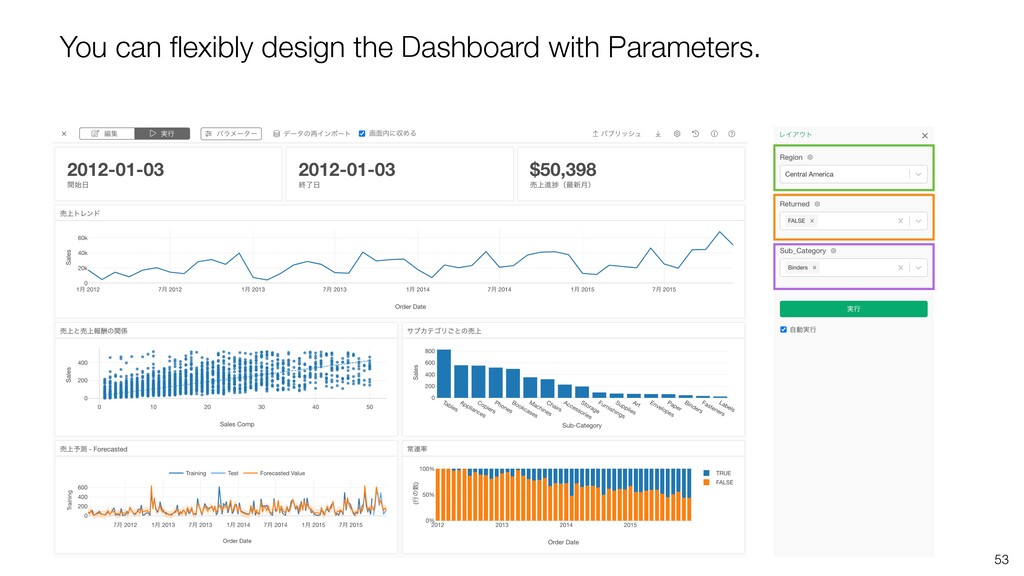
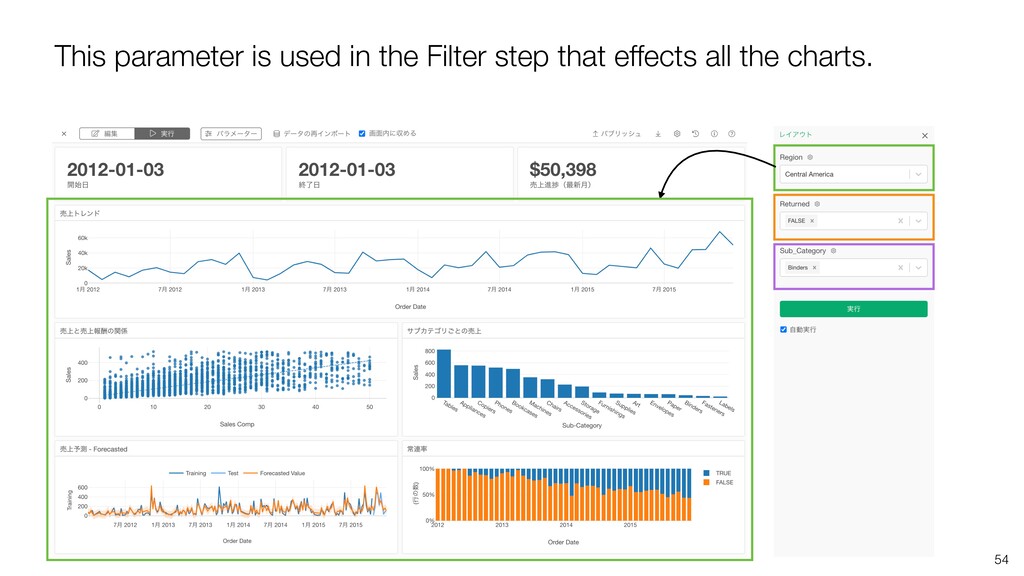
* Parameterize Dashboard
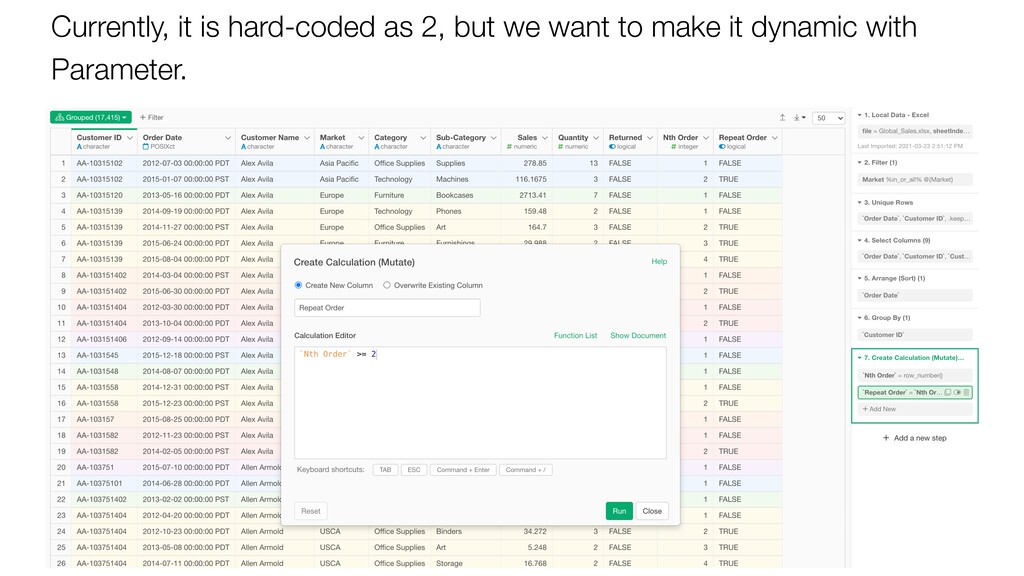
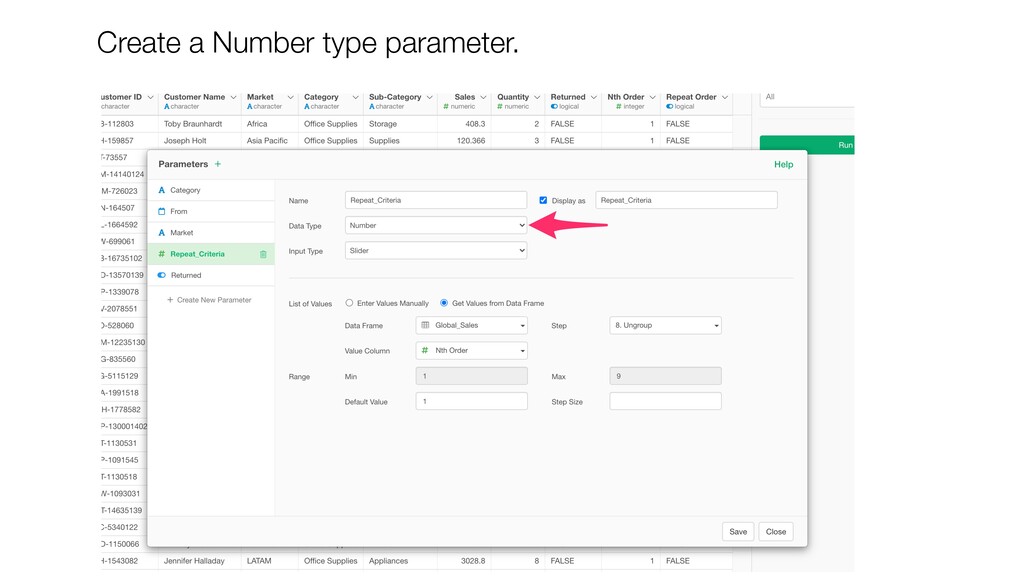
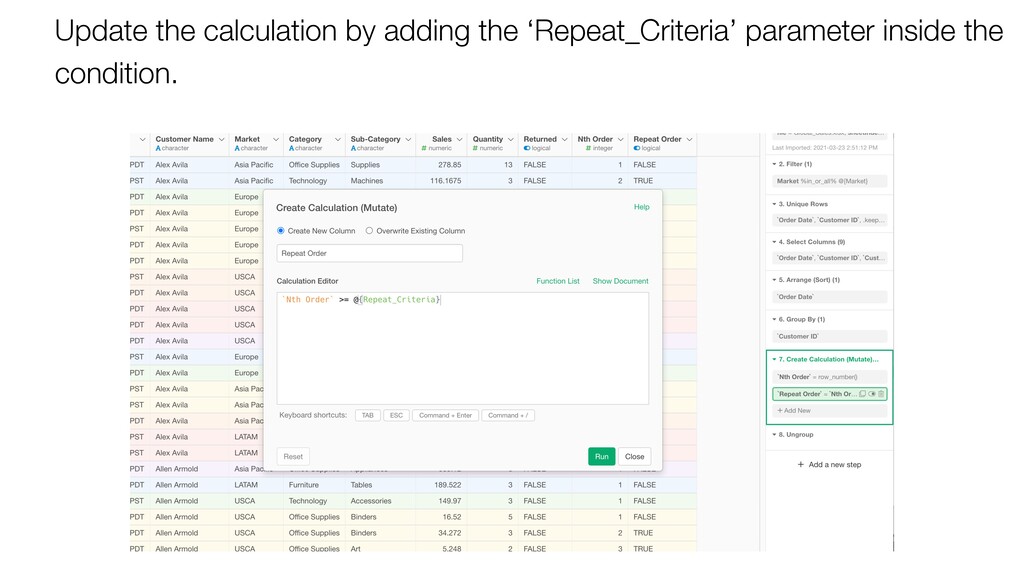
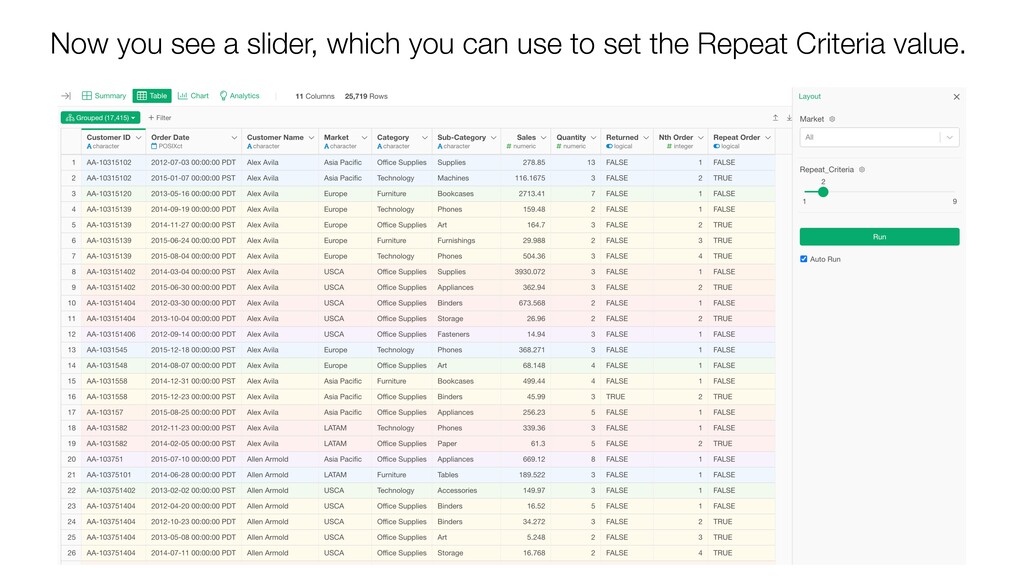
* Parameterize Calculations
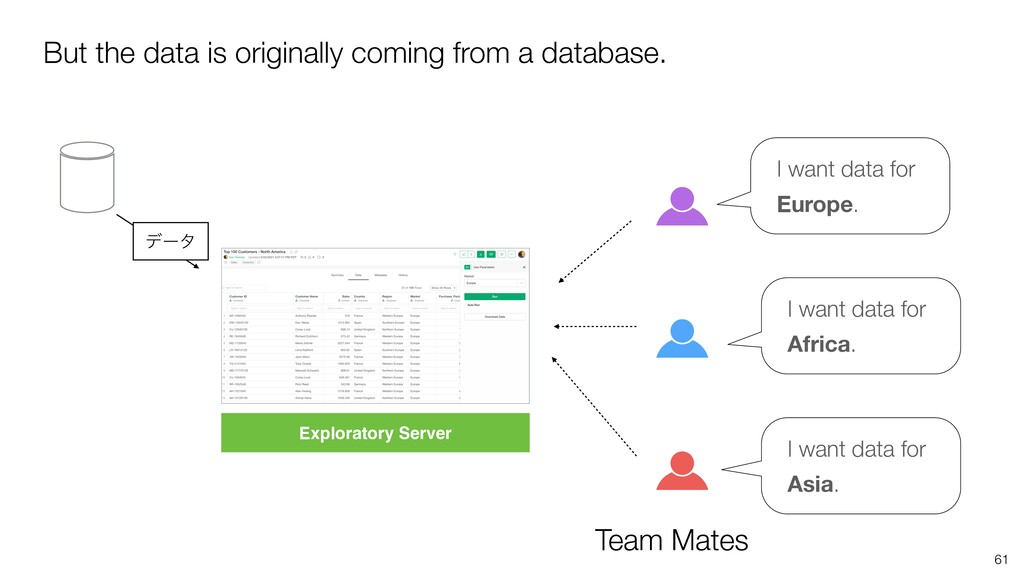
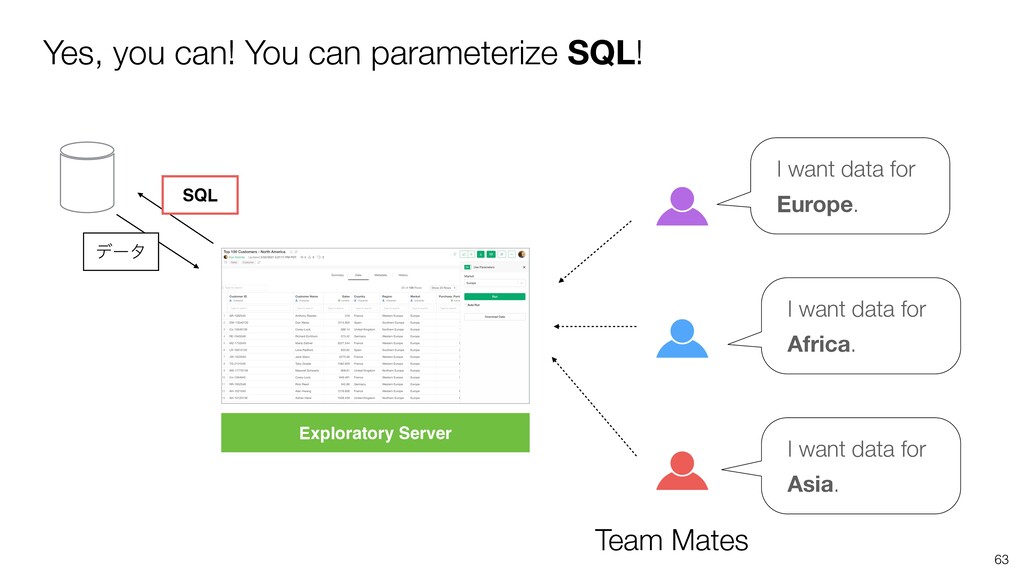
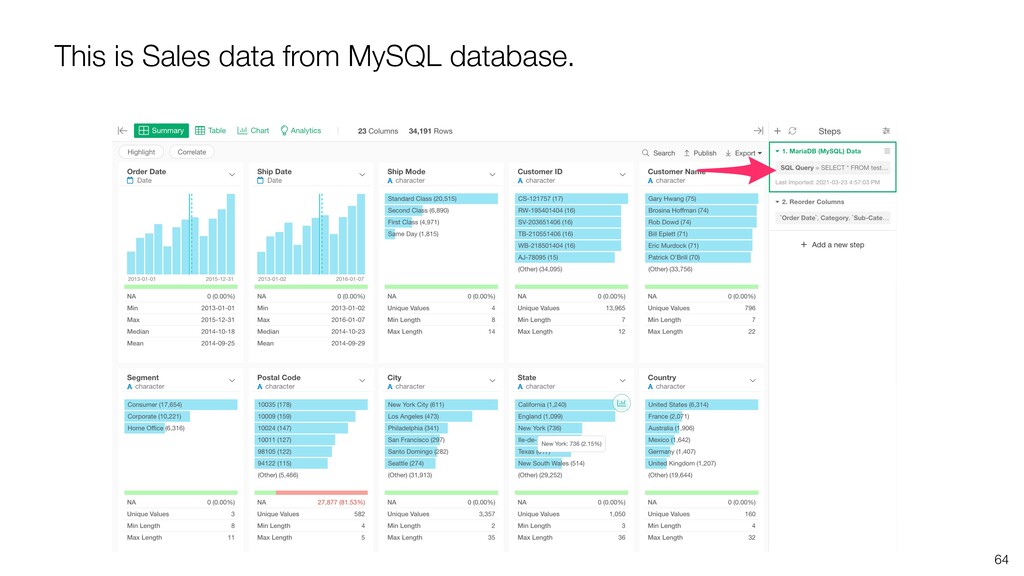
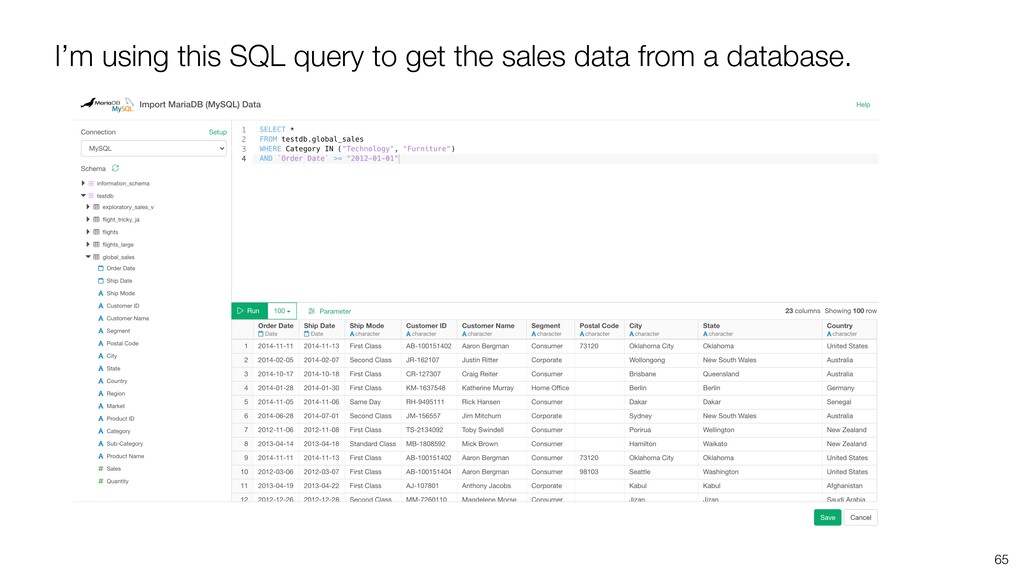
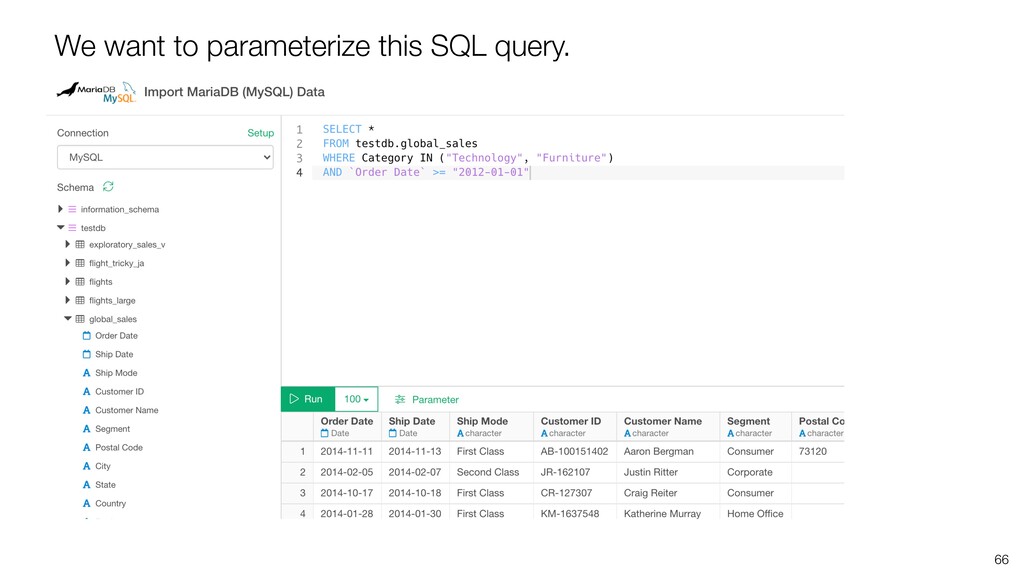
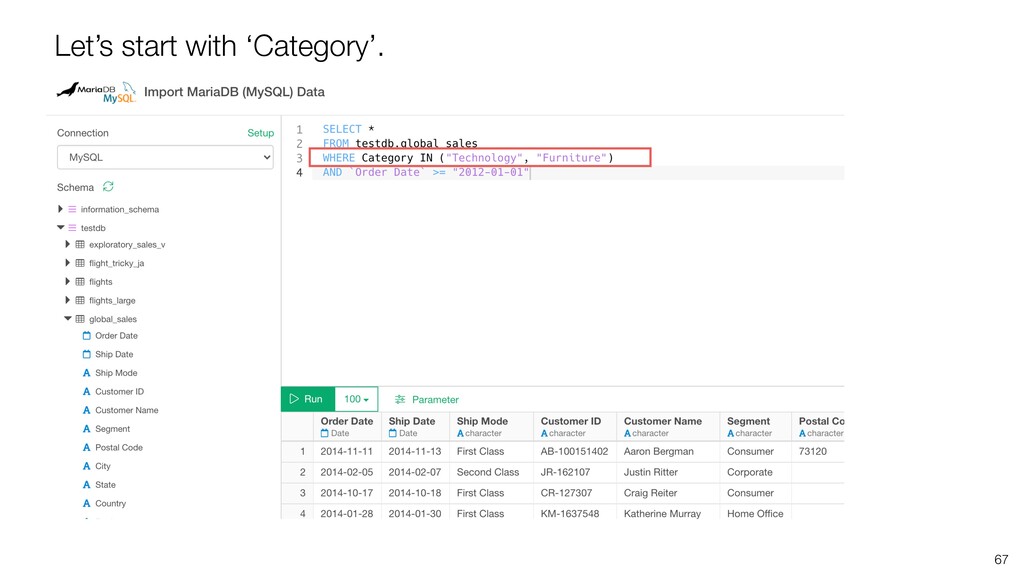
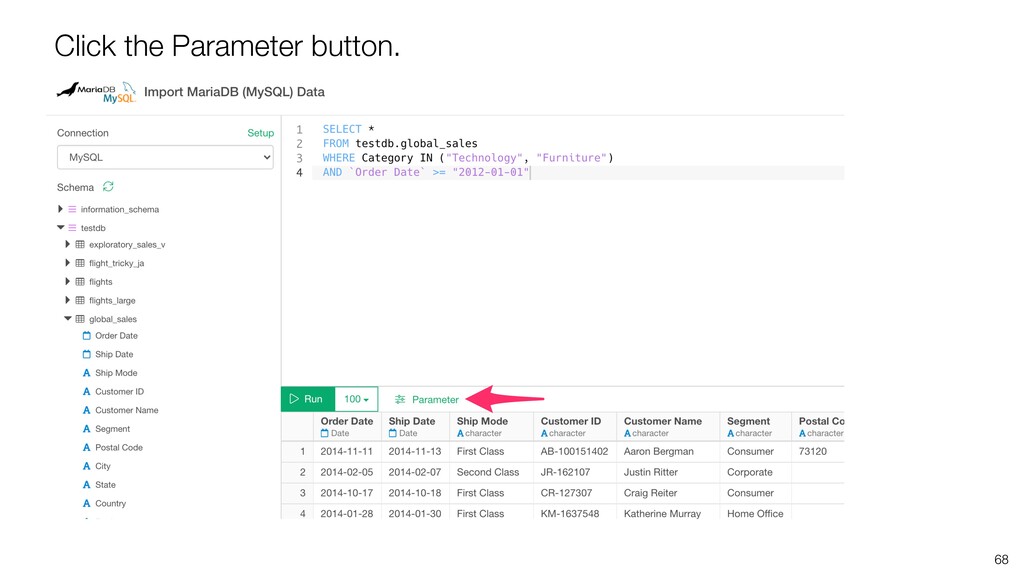
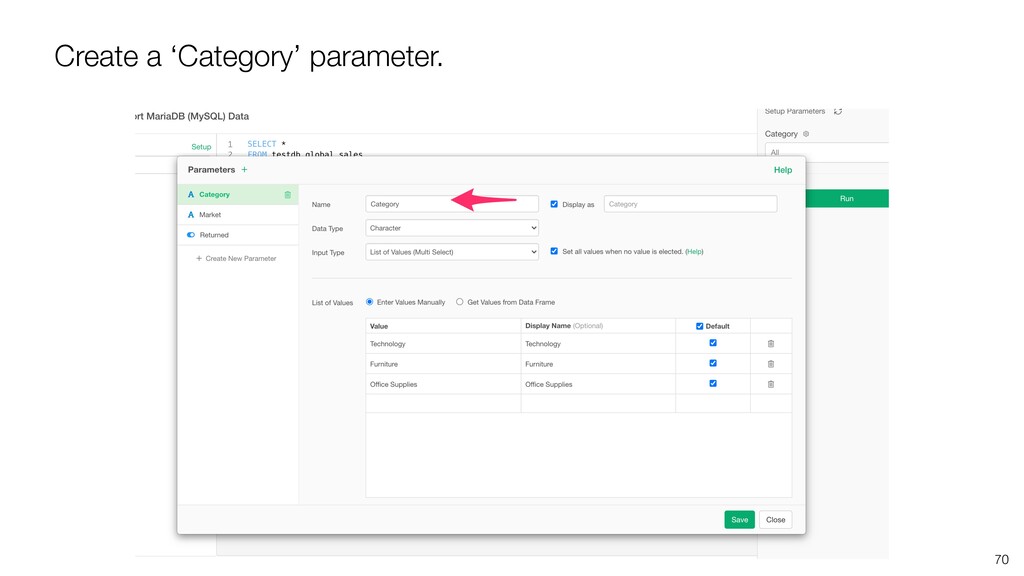
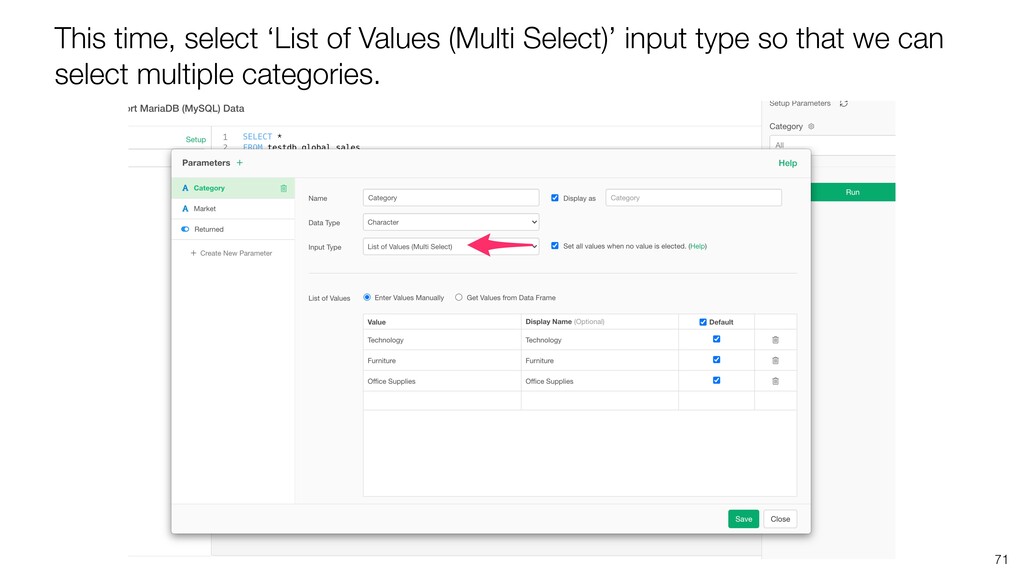
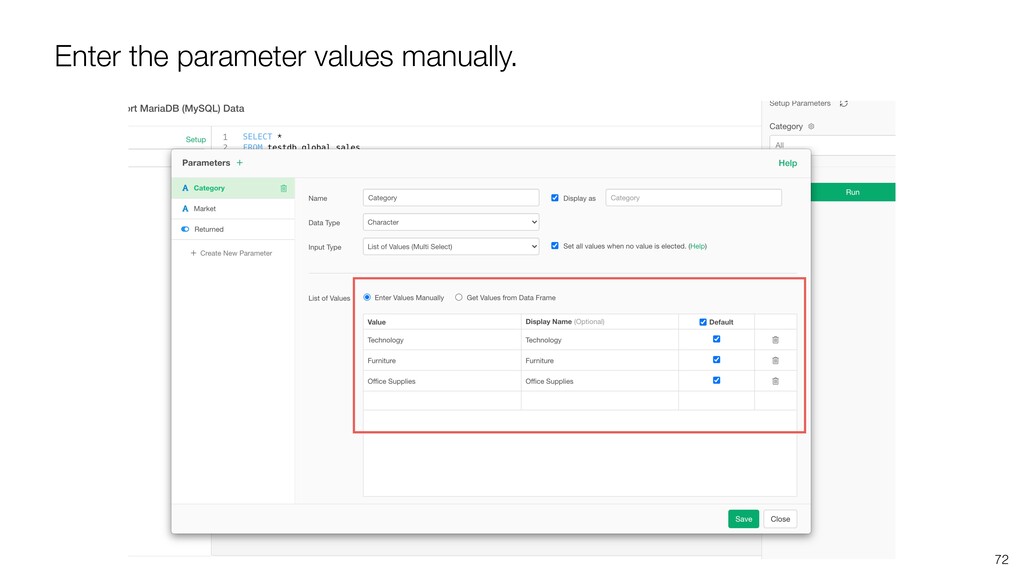
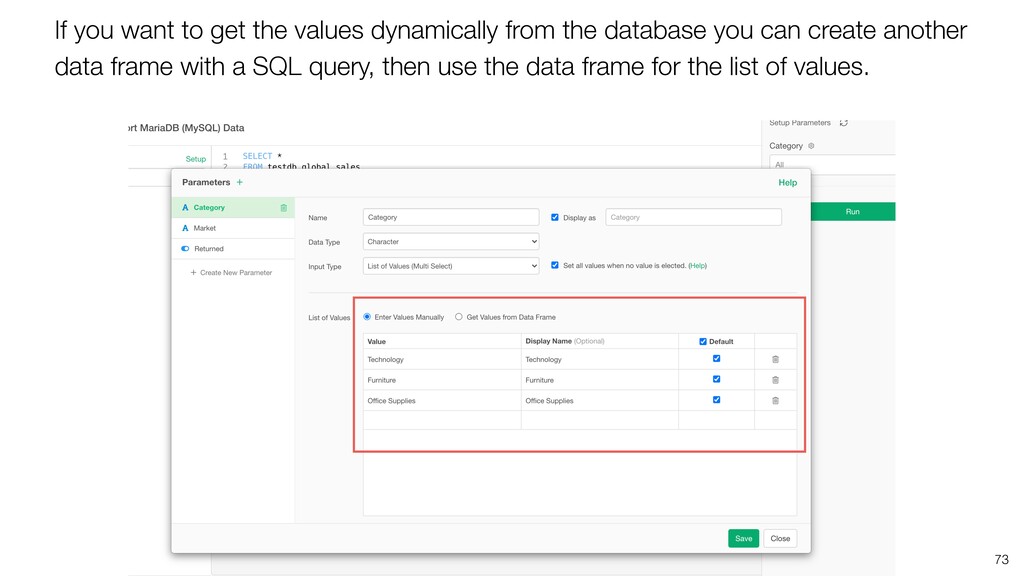
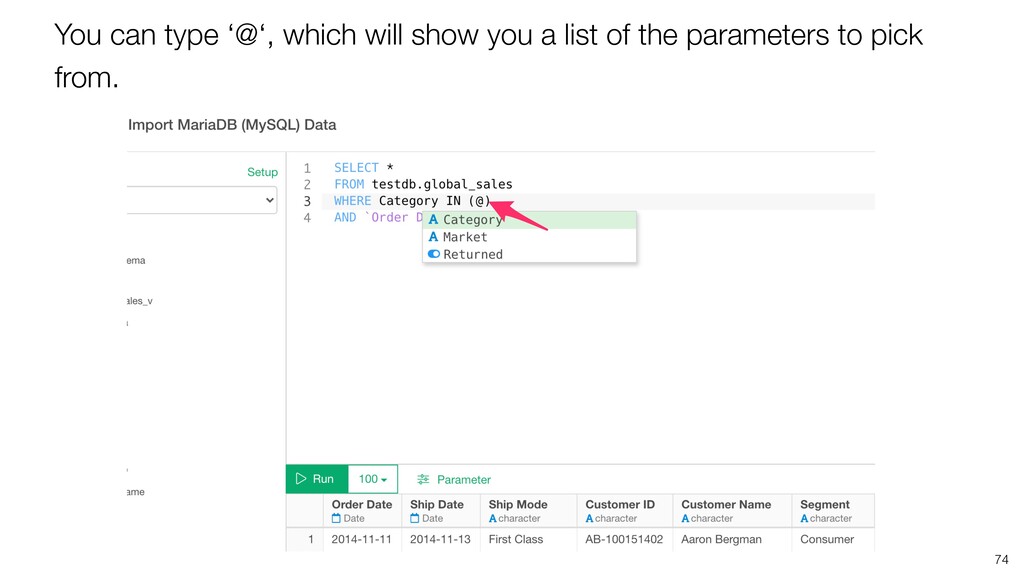
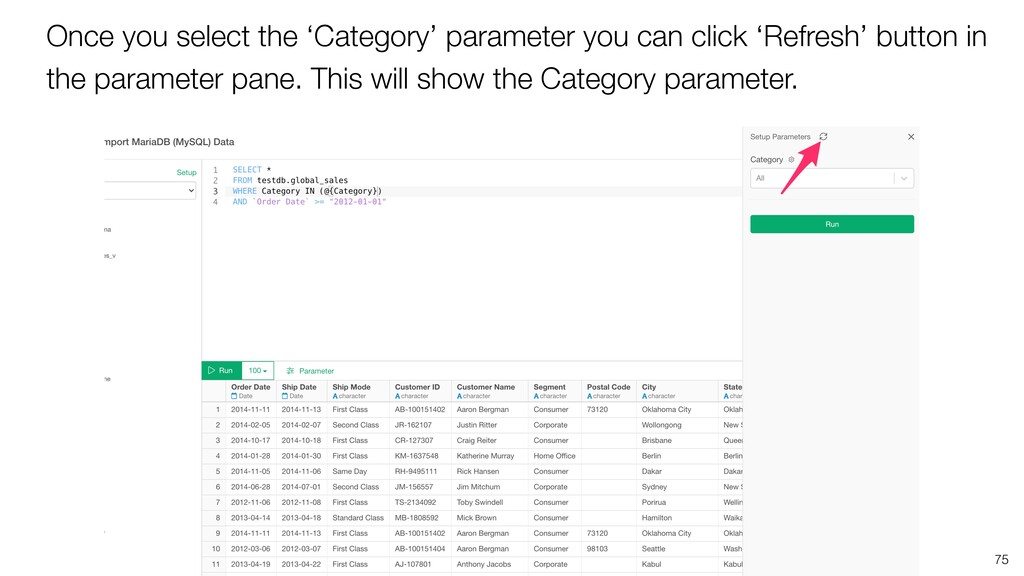
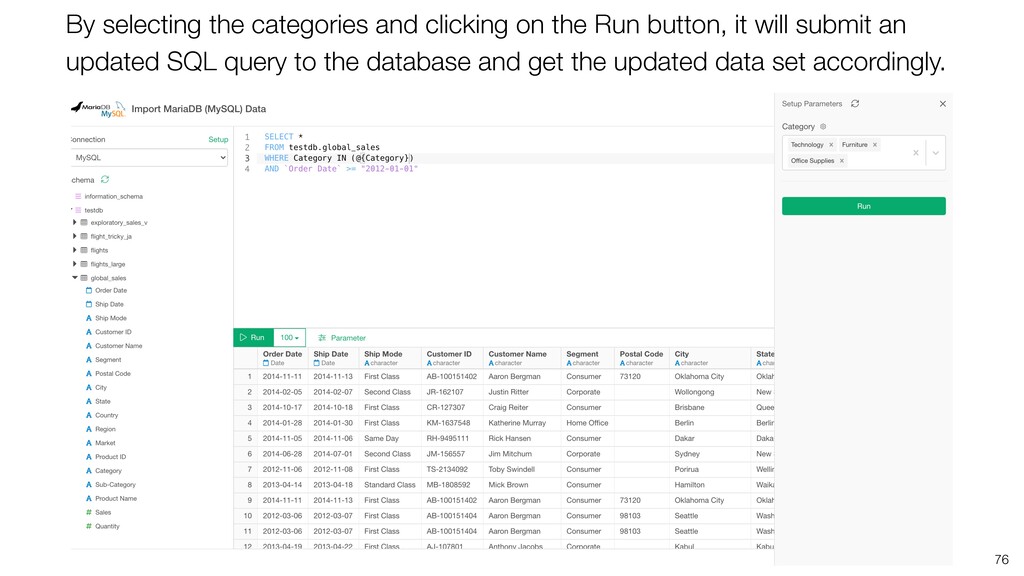
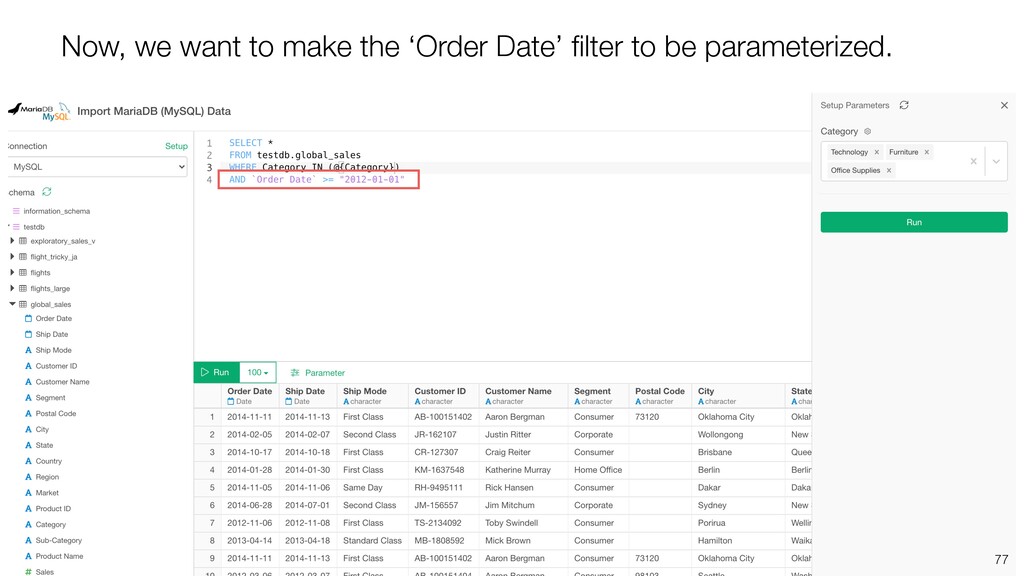
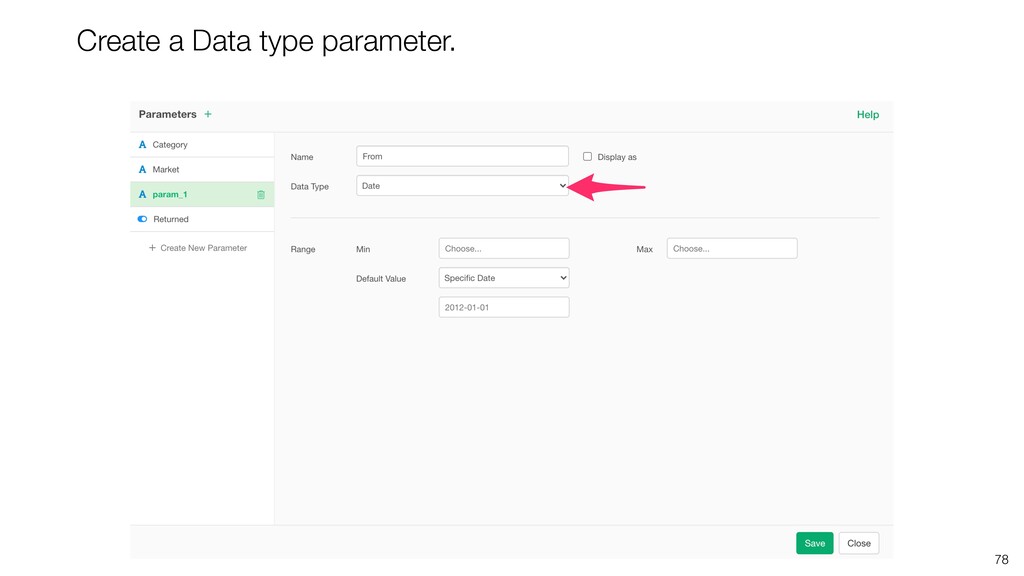
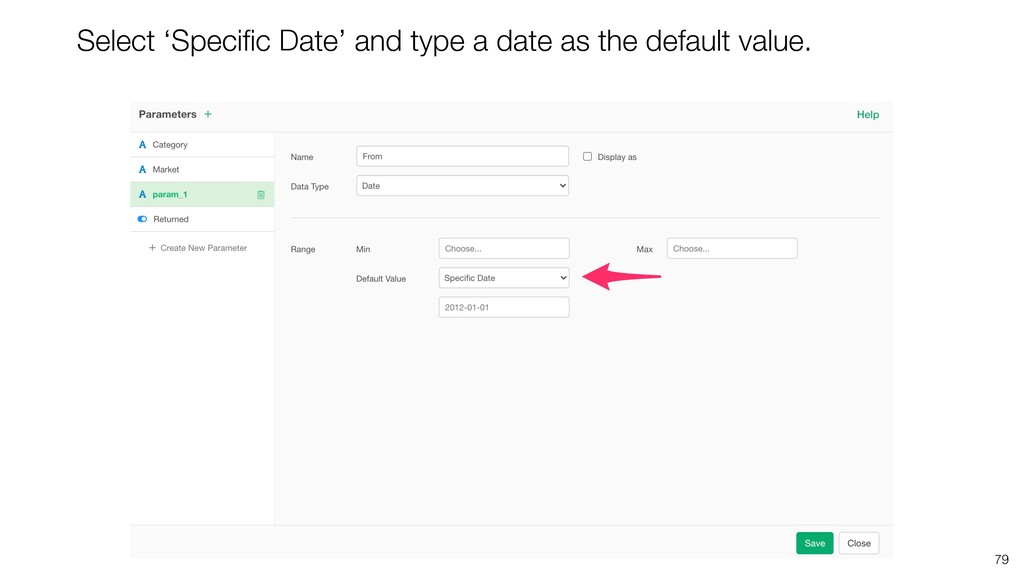
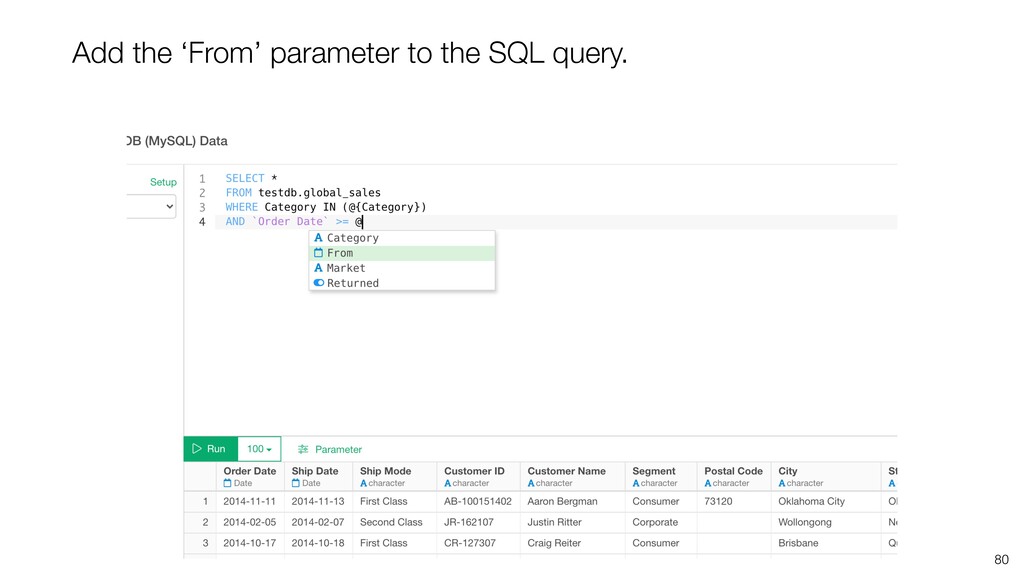
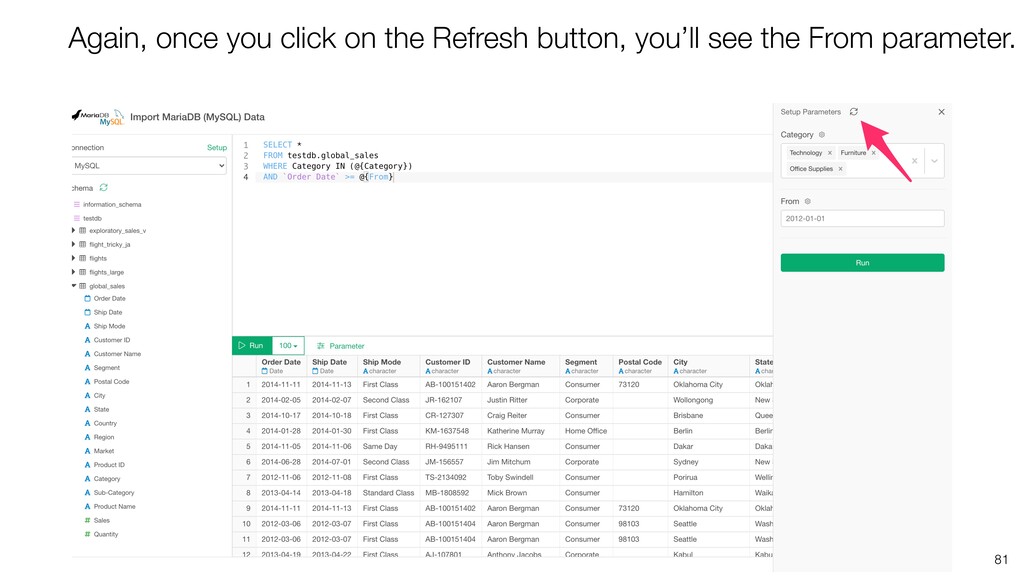
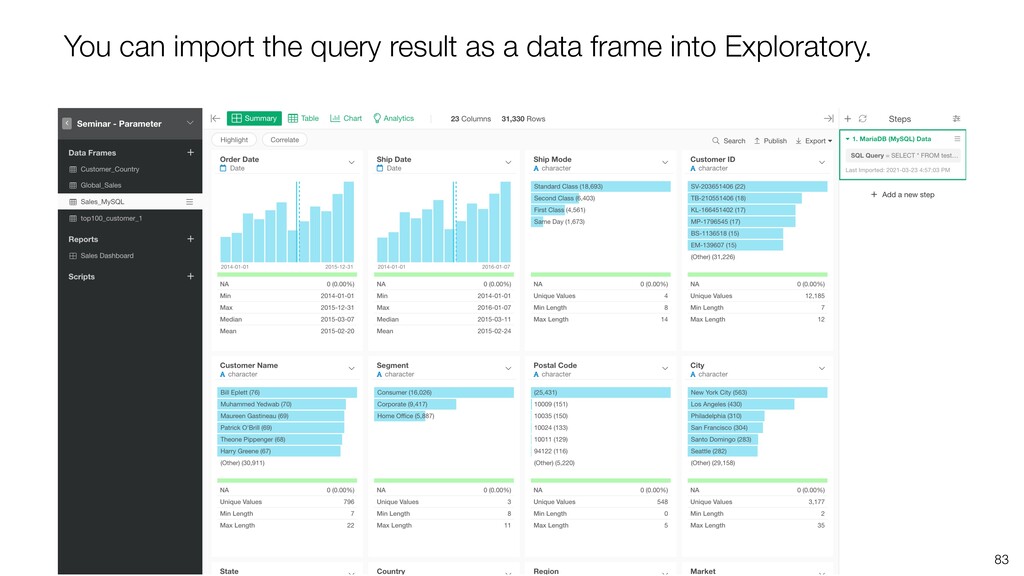
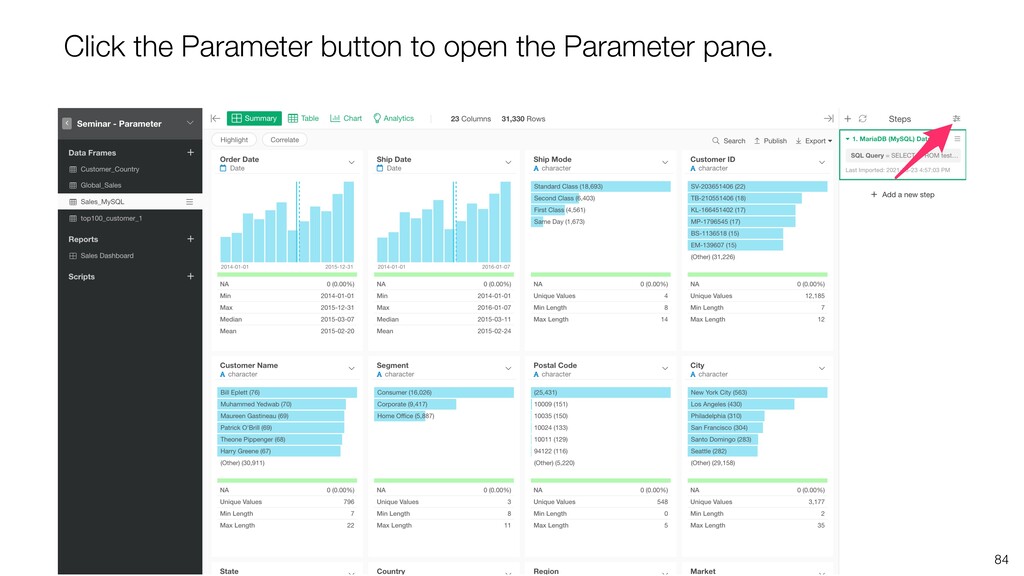
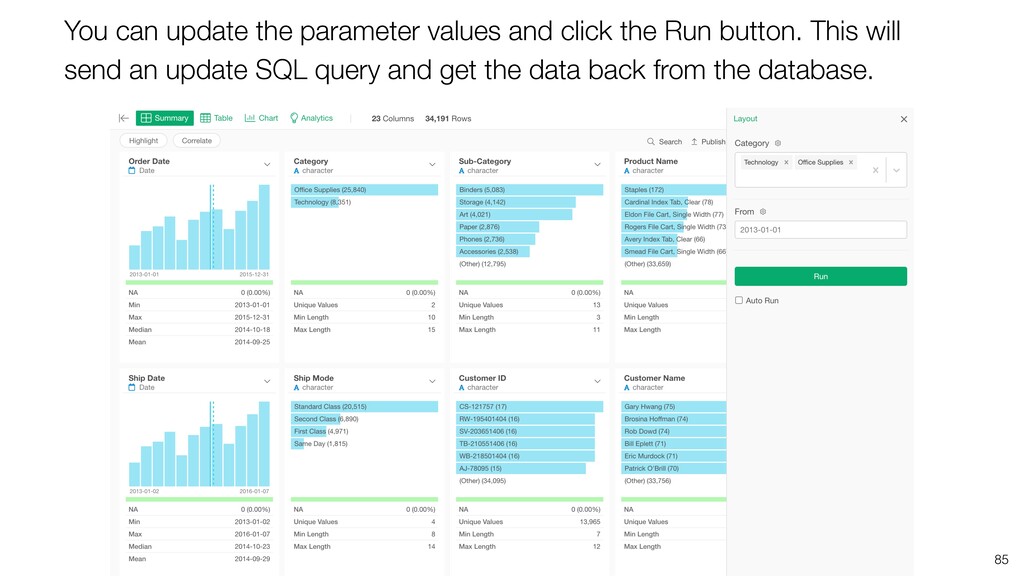
* Parameterize SQL Queries
![Information Email [email protected] Website https://exploratory.io Twitter @ExploratoryData Seminar https://exploratory.io/online-seminar](https://files.speakerdeck.com/presentations/3dae23fd532141798f268bb83d8a4074/slide_107.jpg)