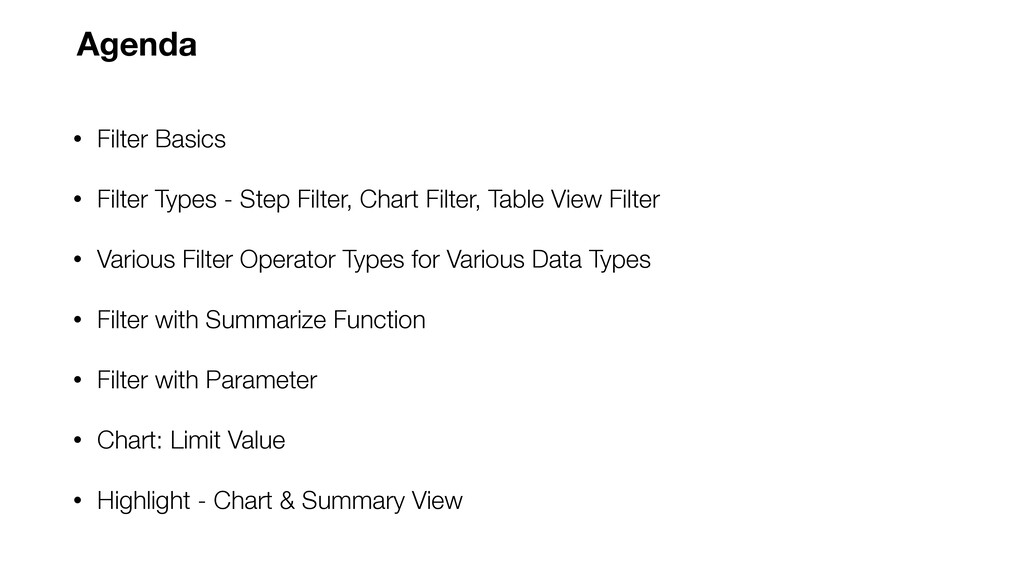
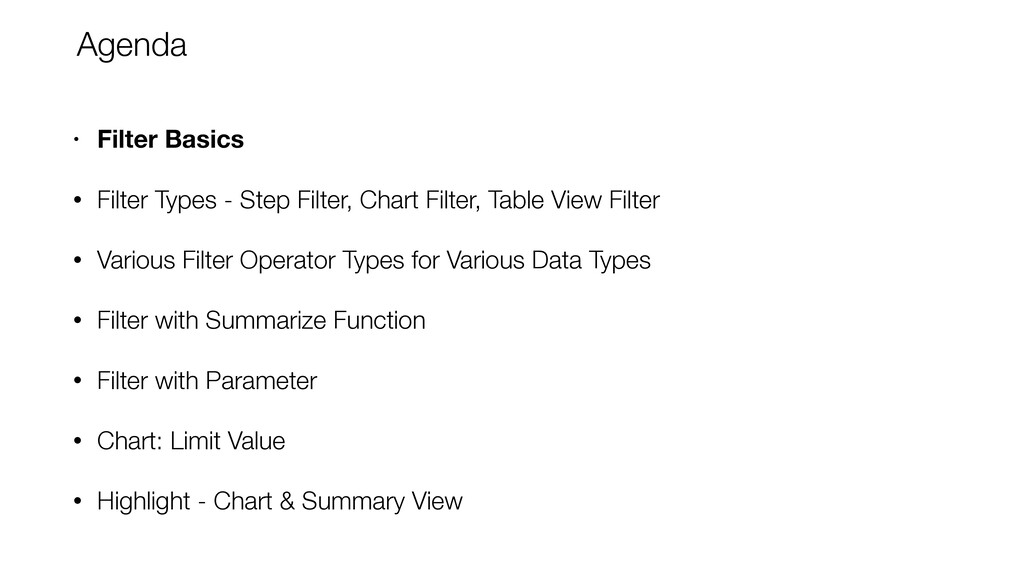
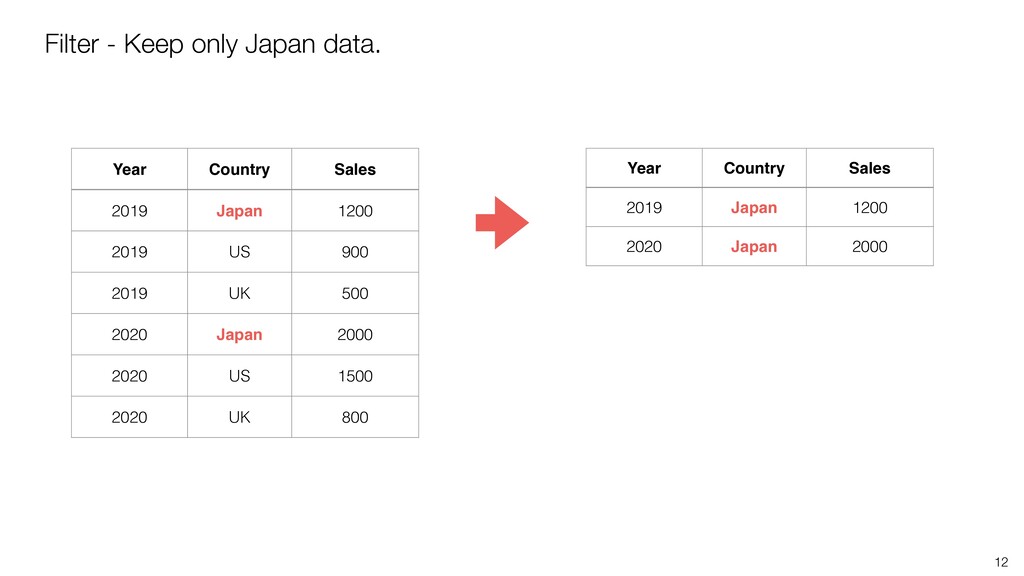
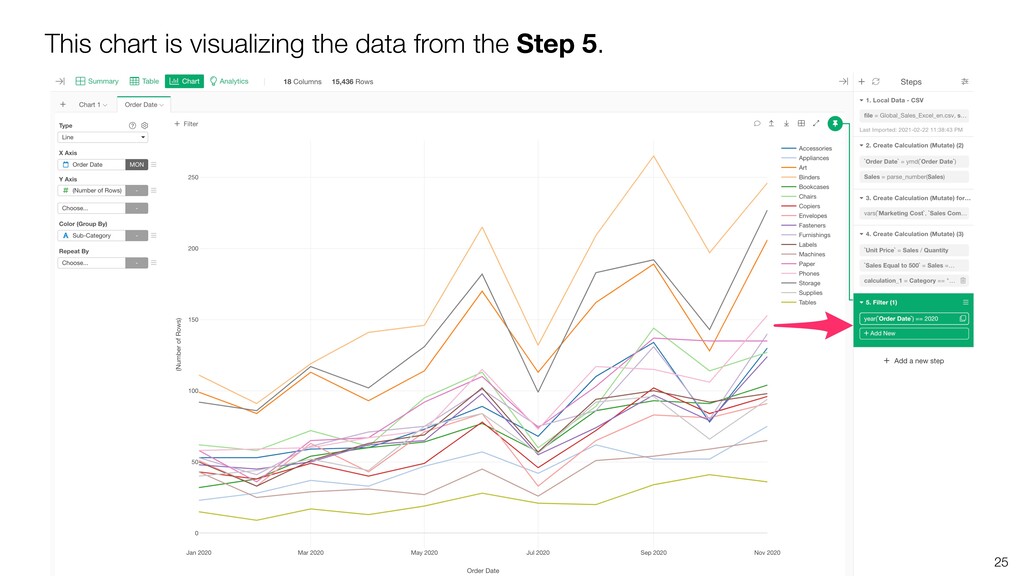
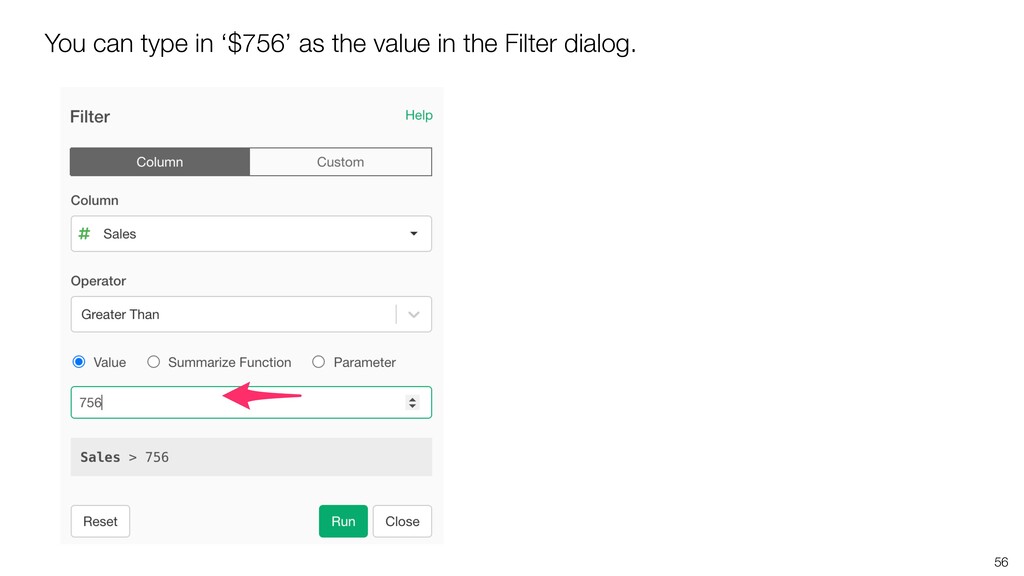
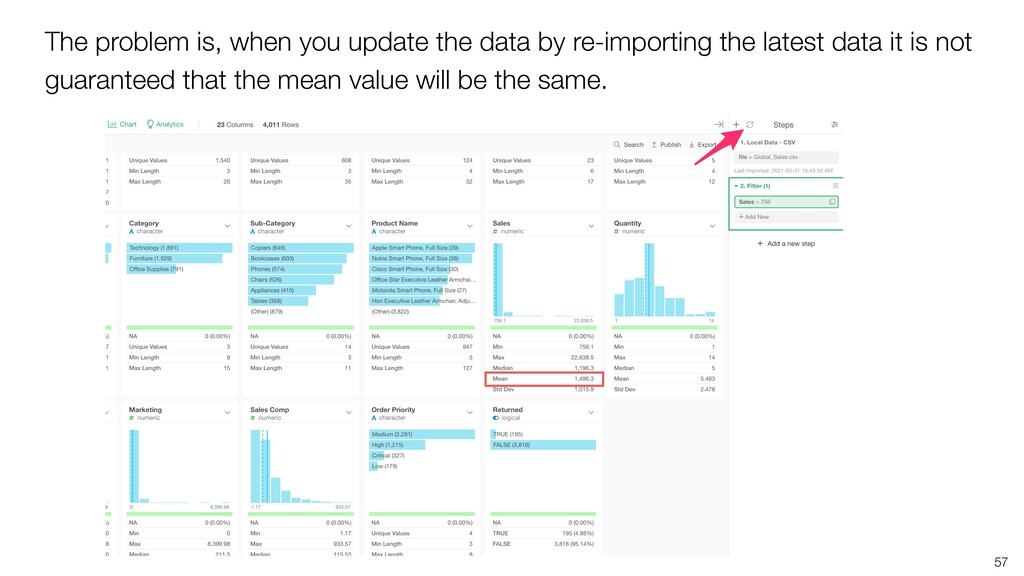
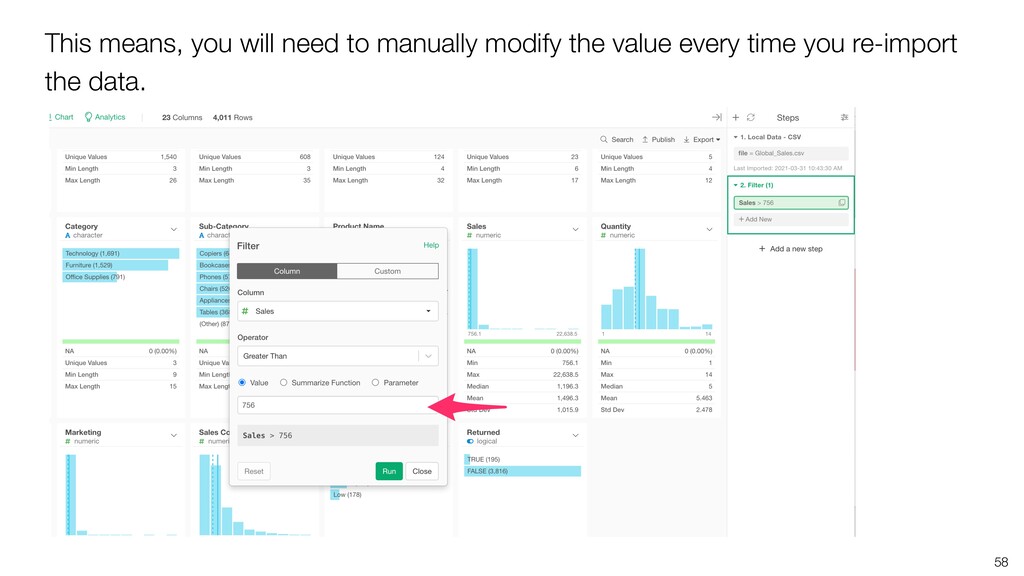
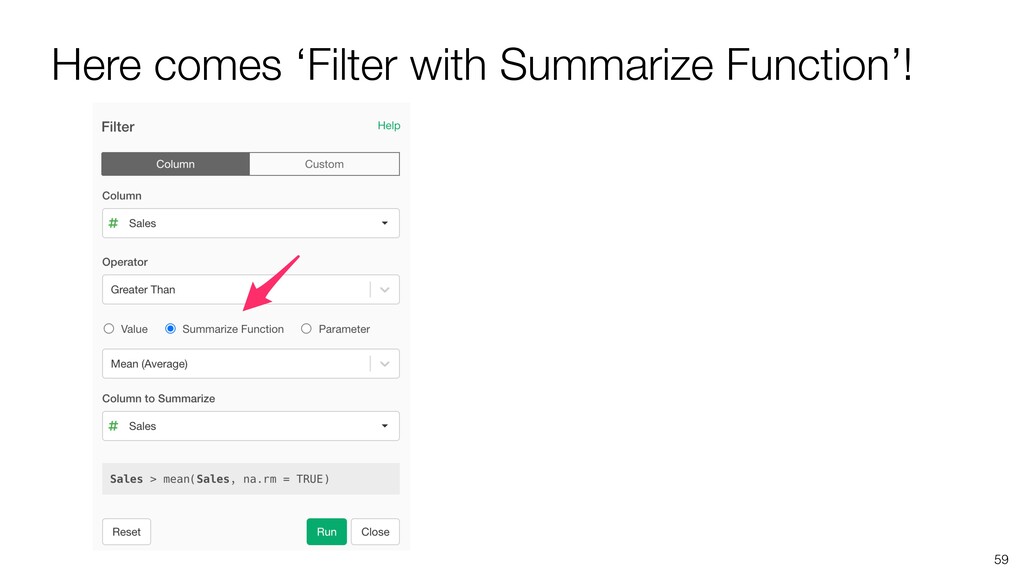
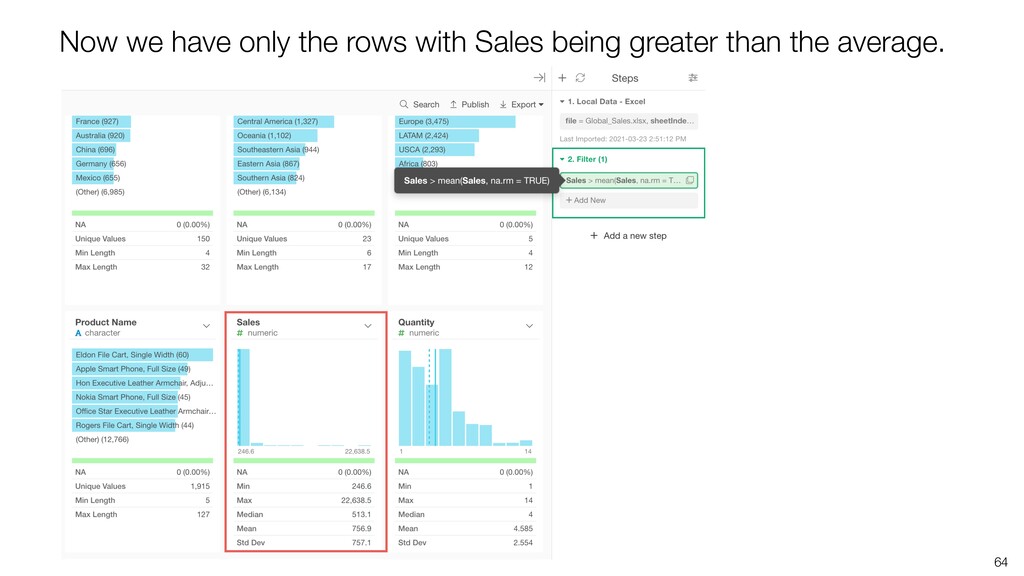
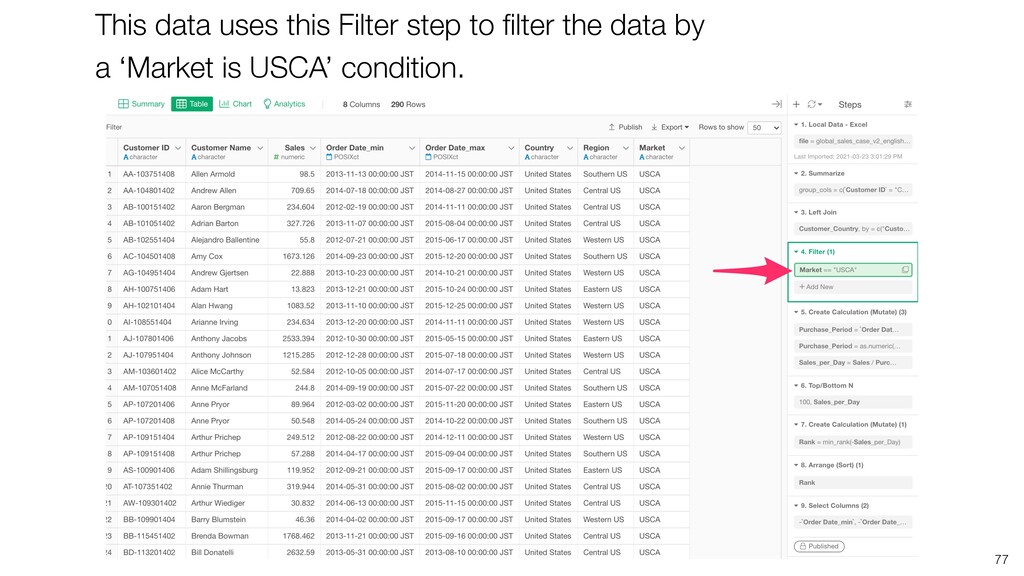
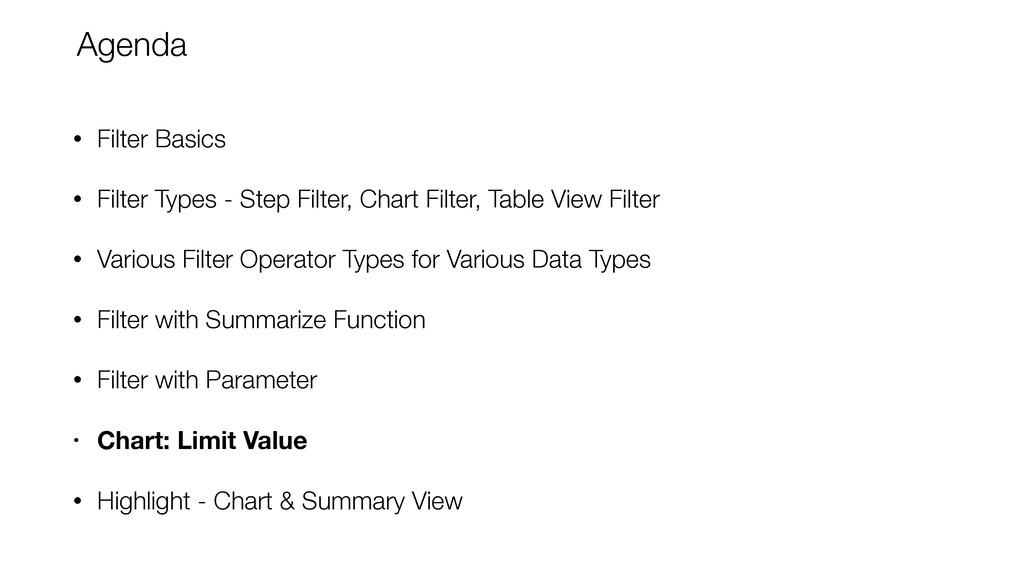
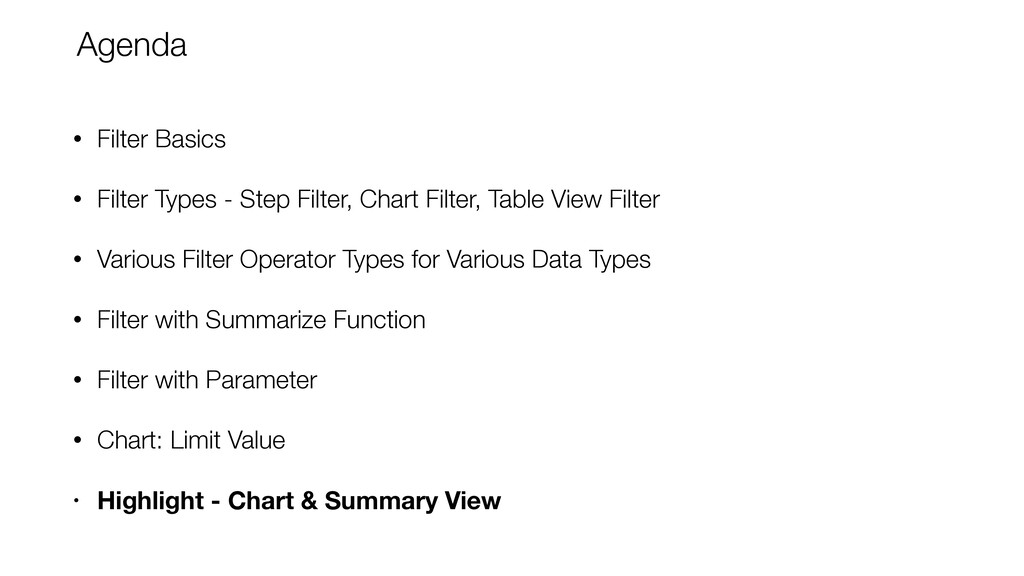
There are various Filter types in Exploratory such as Step Filter, Chart Filter, Table View Filter, etc. In this seminar, Kan will introduce all things related to filtering the data in Exploratory and discuss when and how you want to use them.
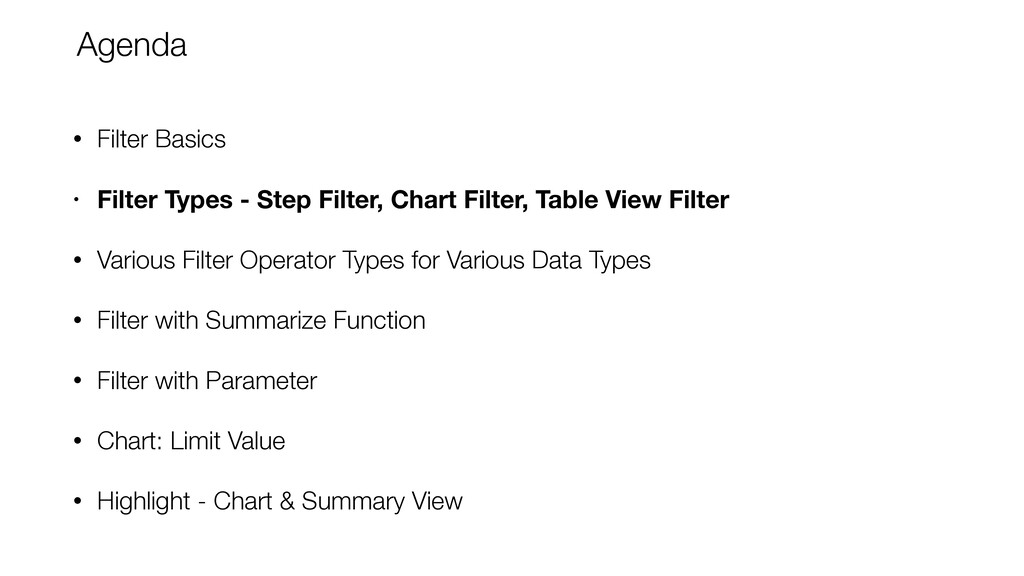
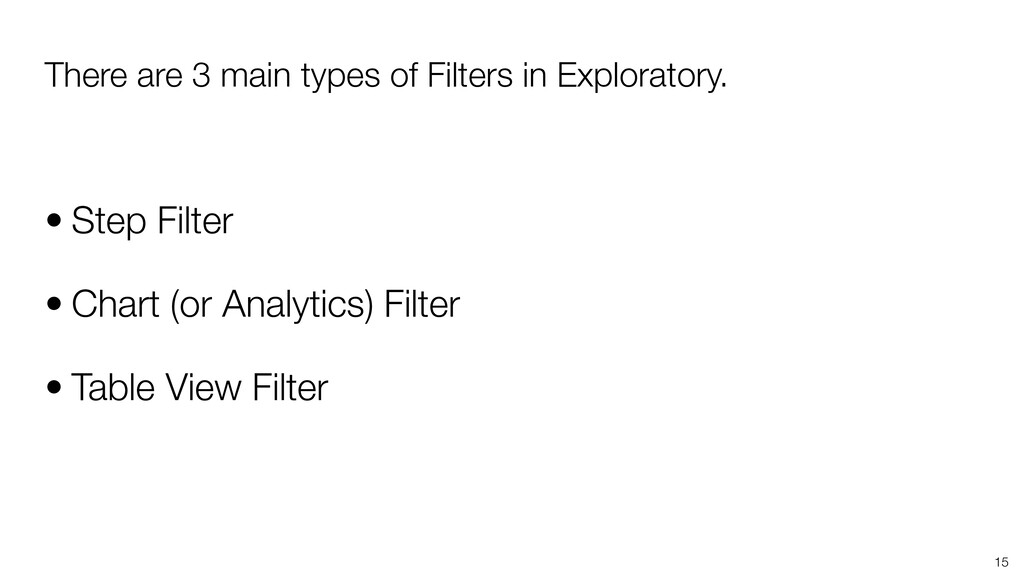
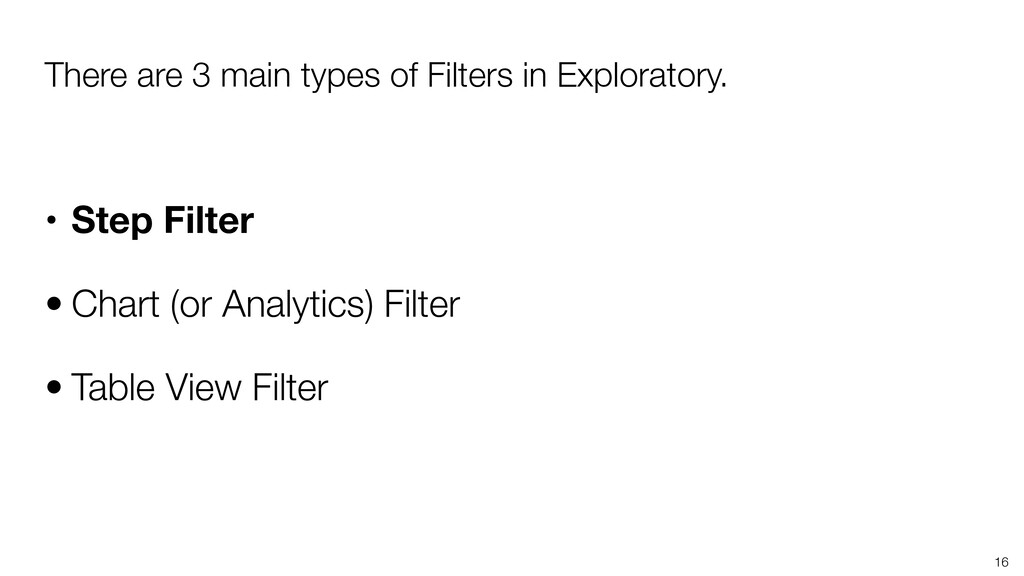
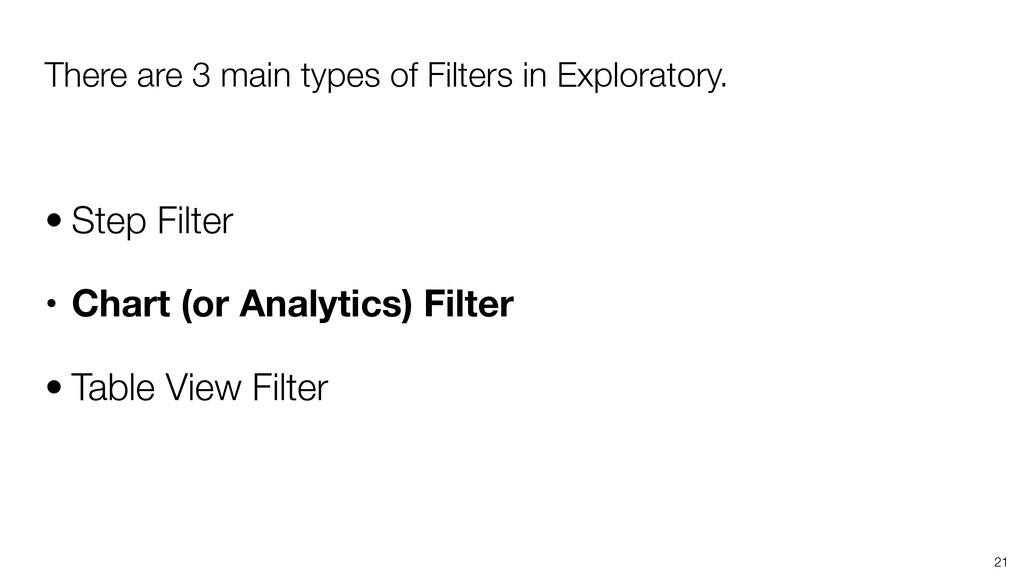
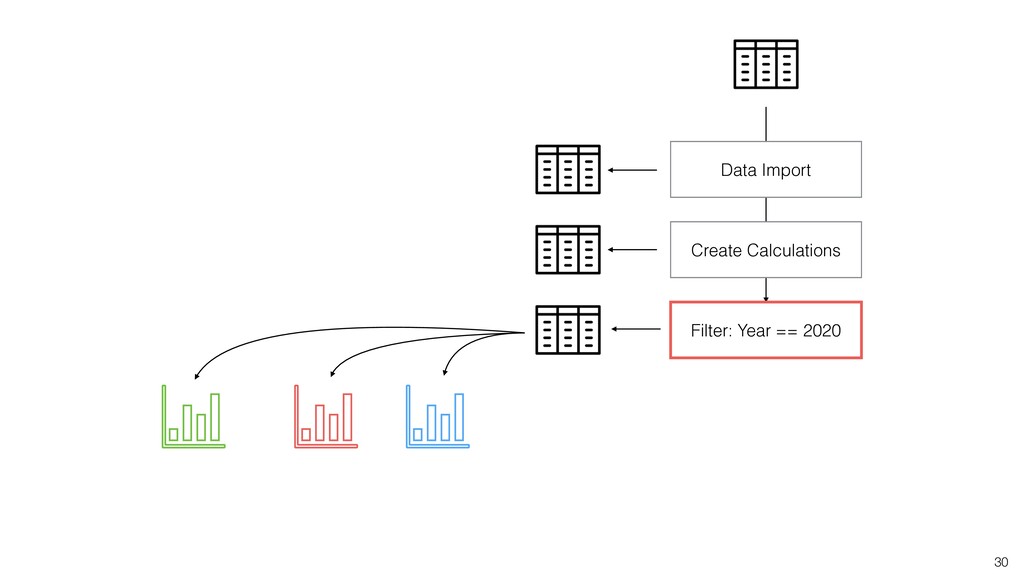
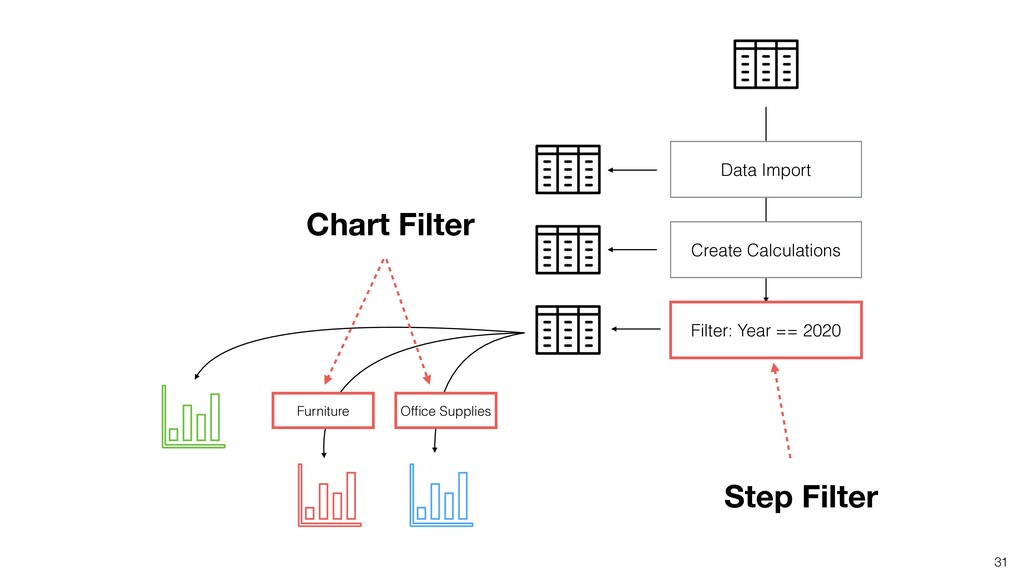
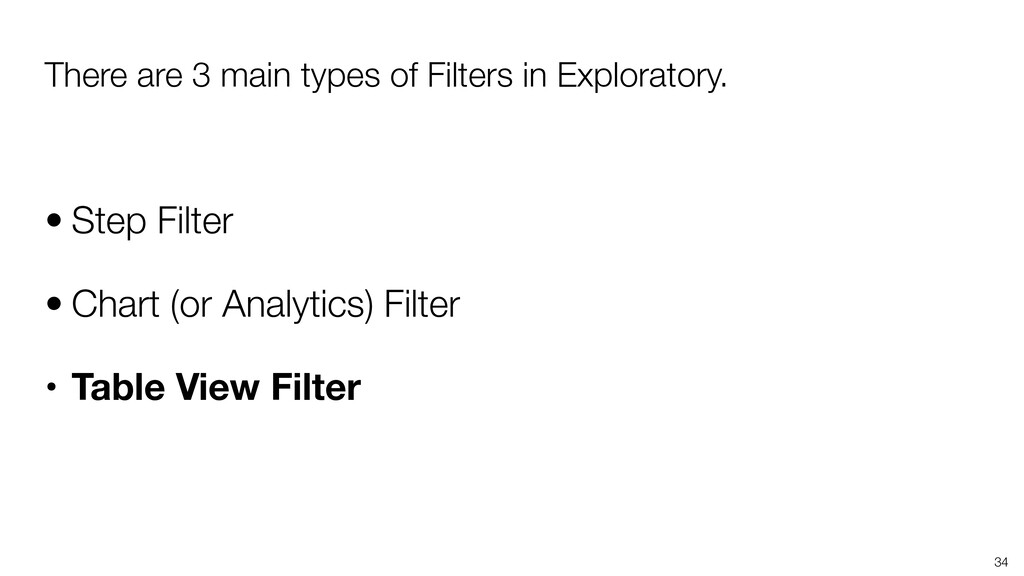
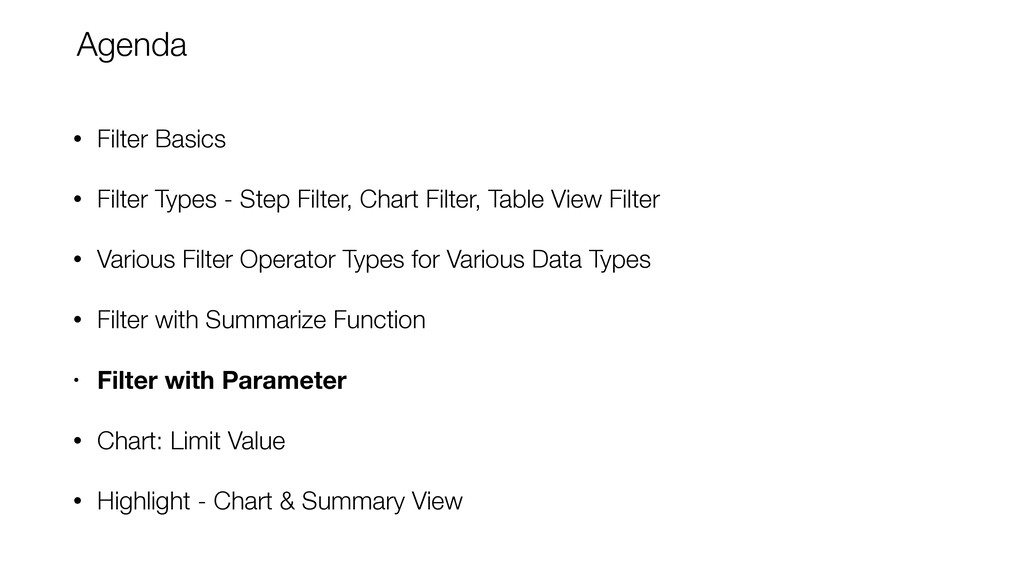
* Step Filter
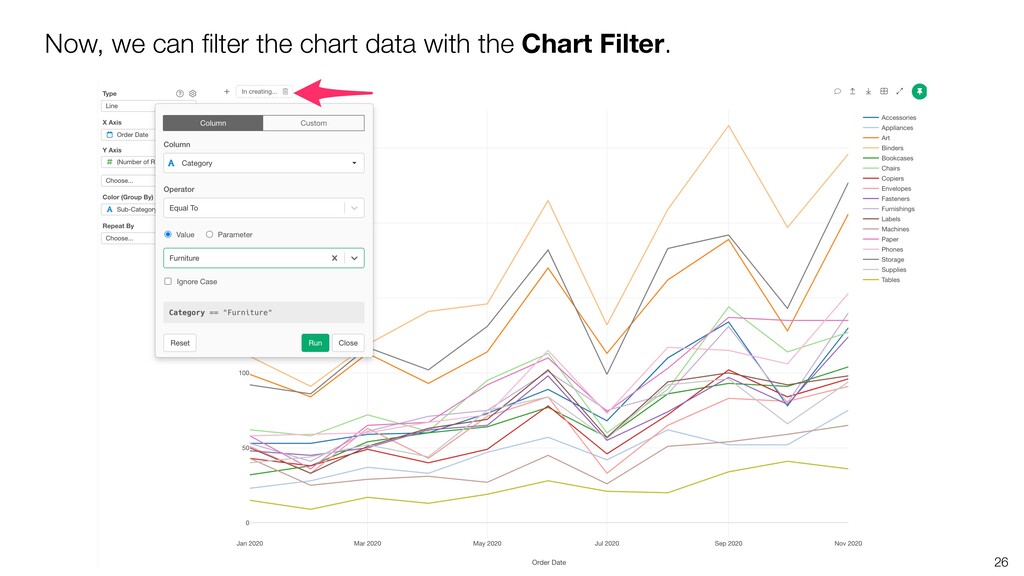
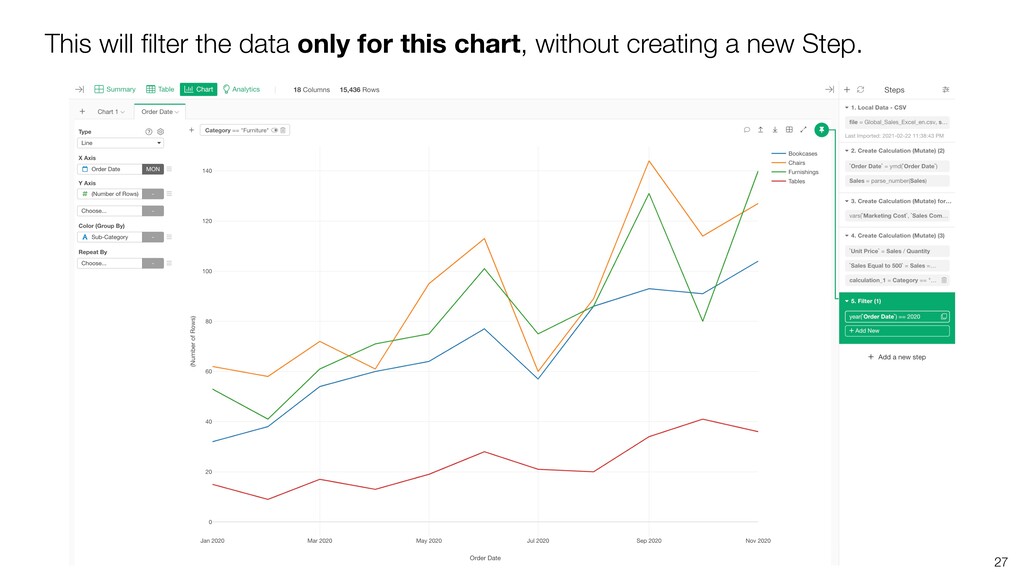
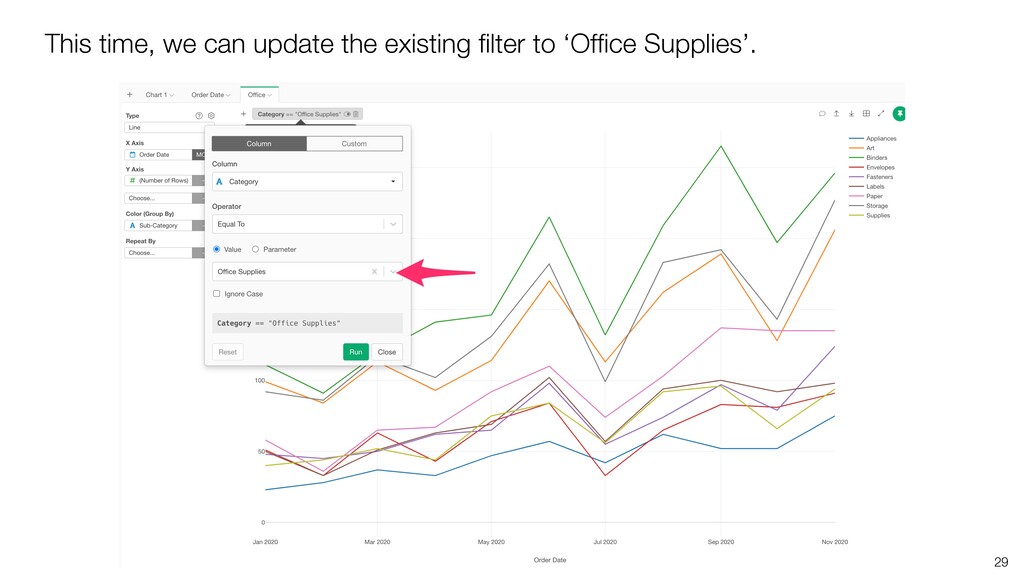
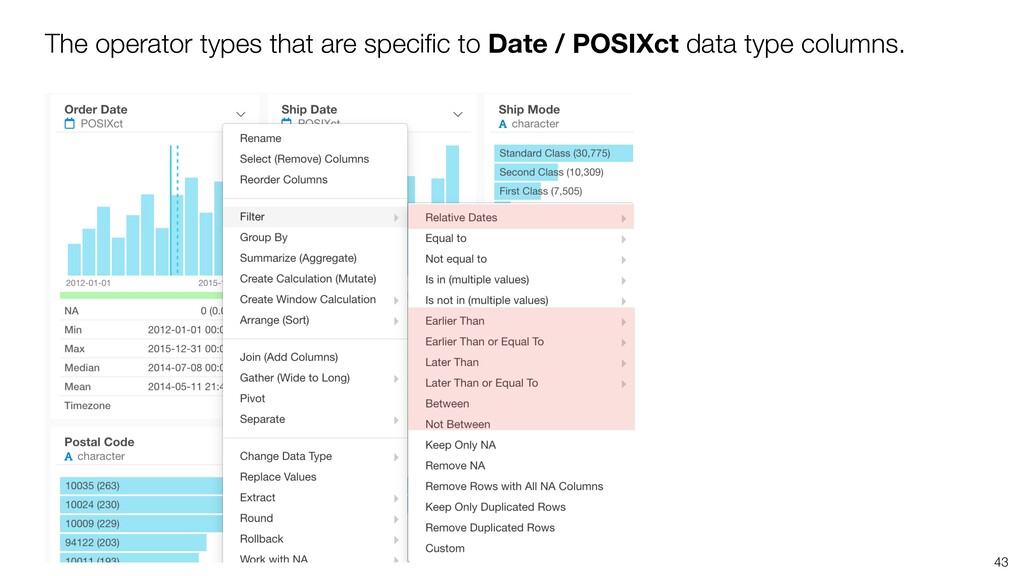
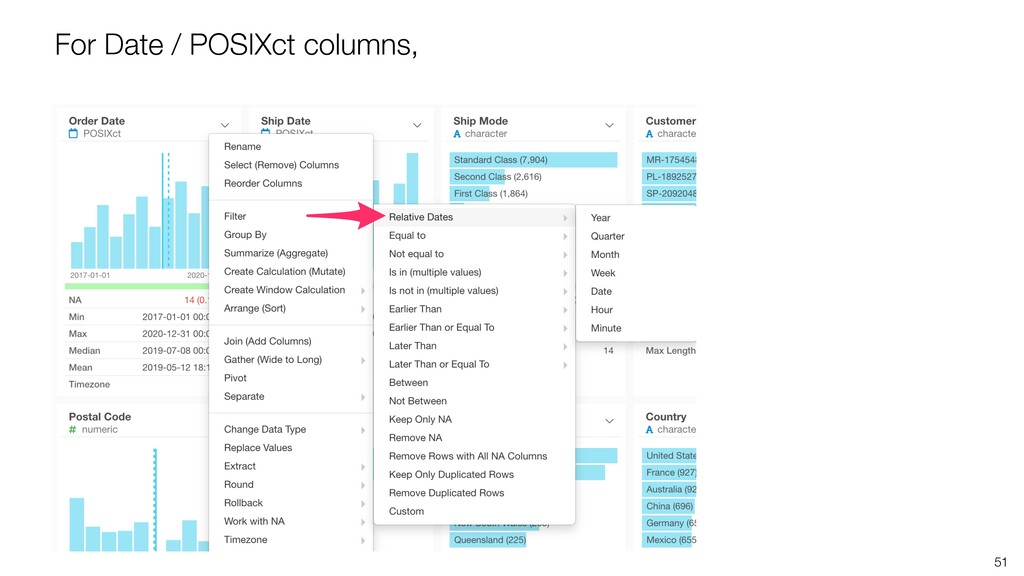
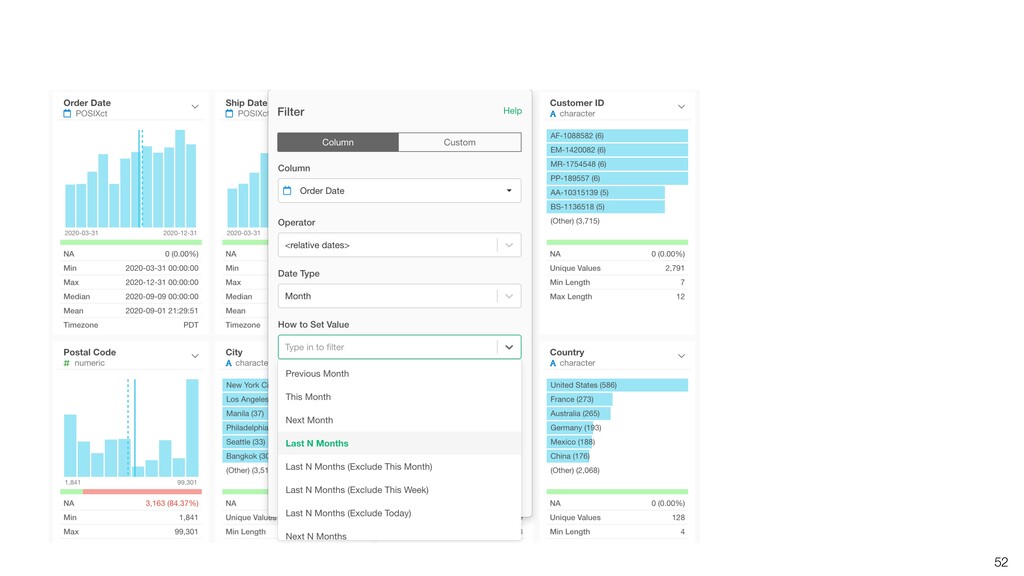
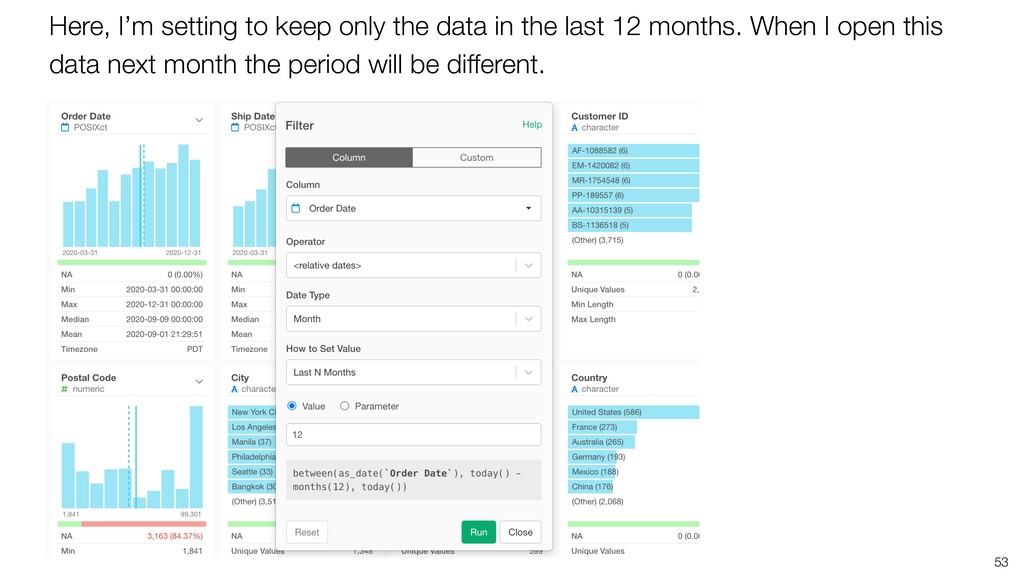
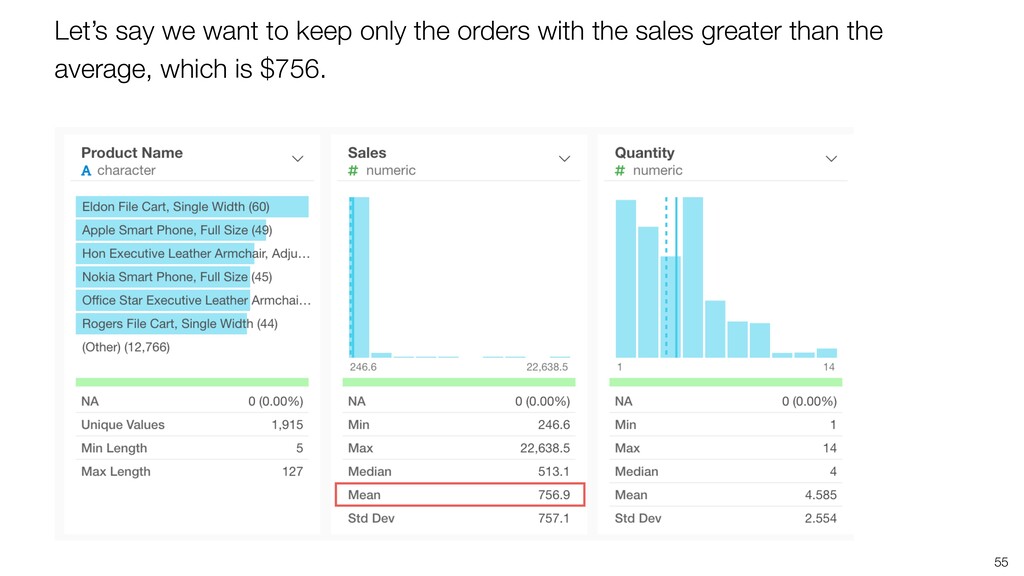
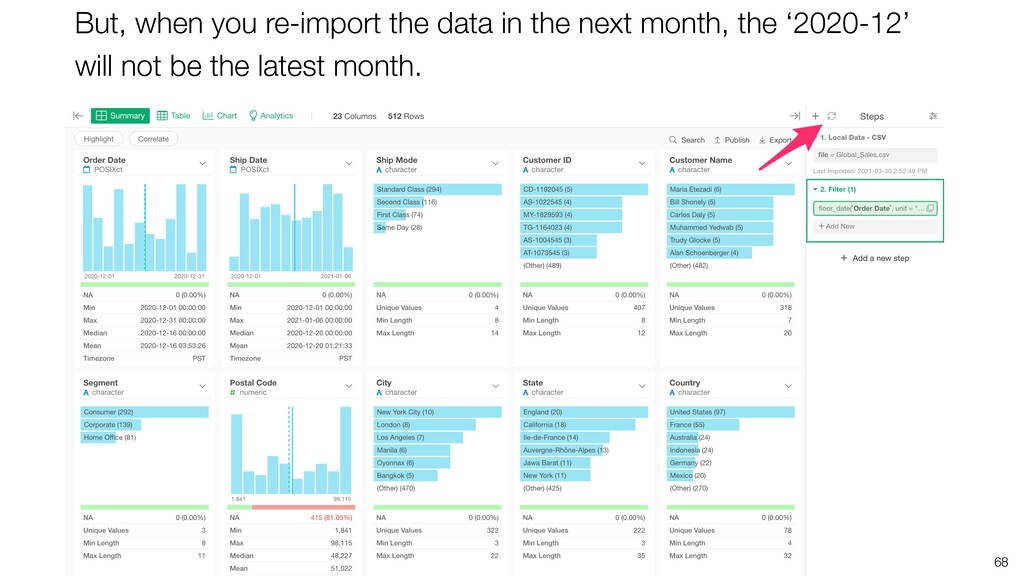
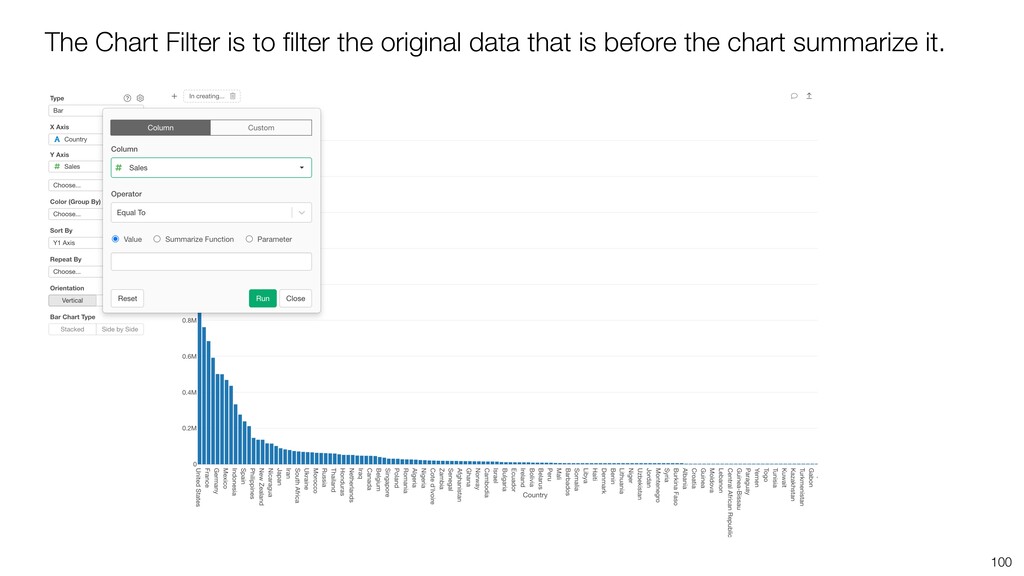
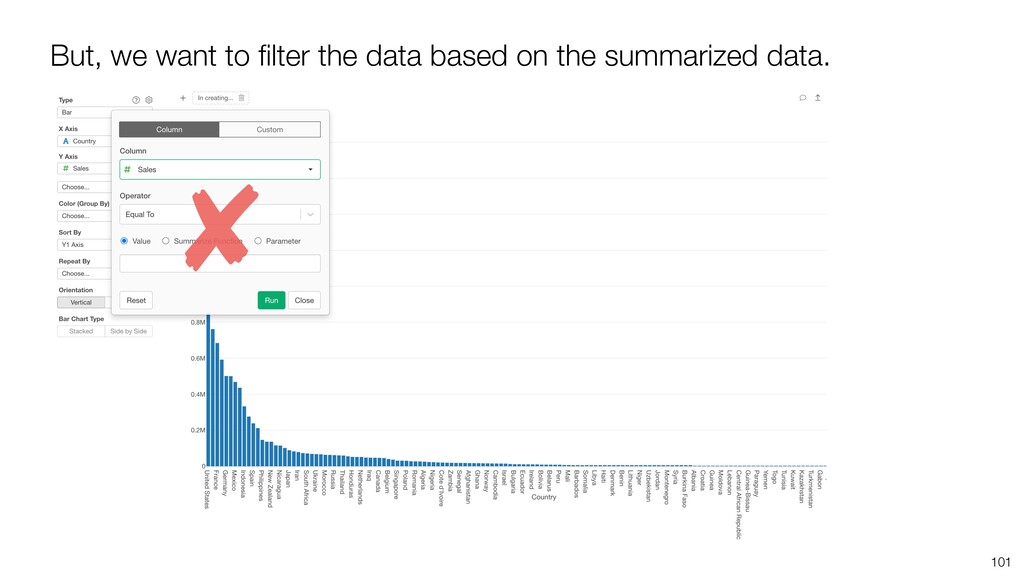
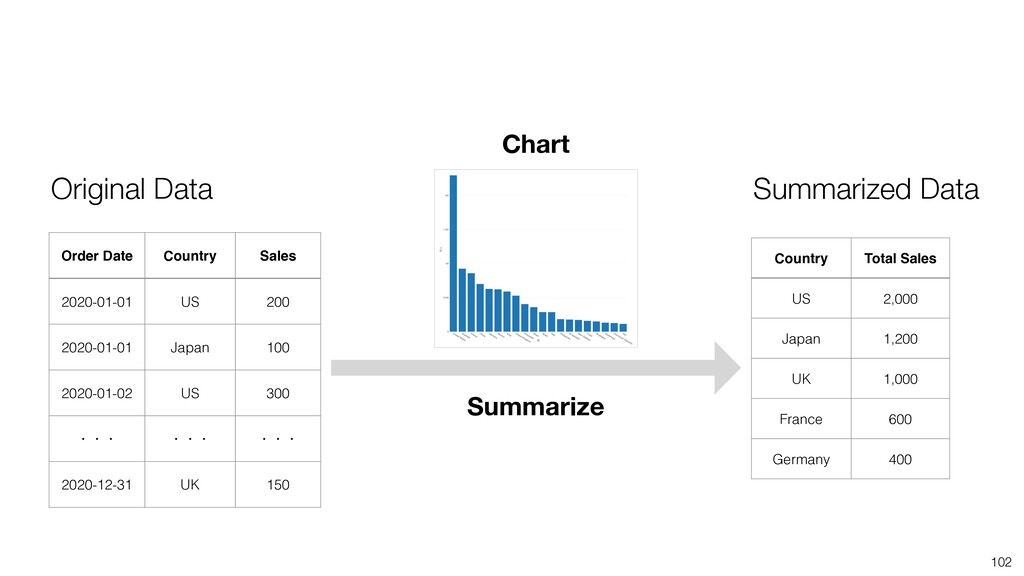
* Chart / Analytics Filter
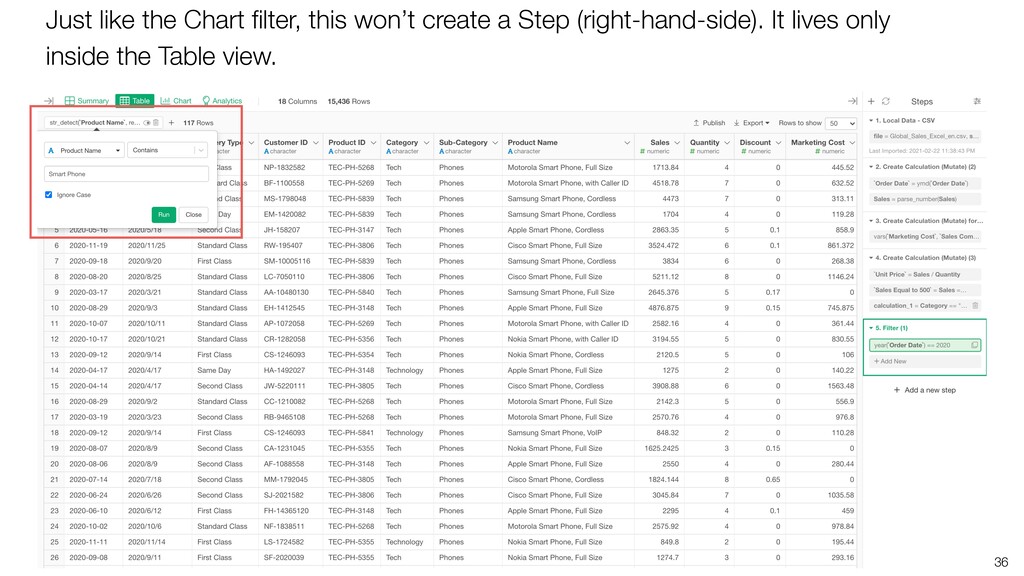
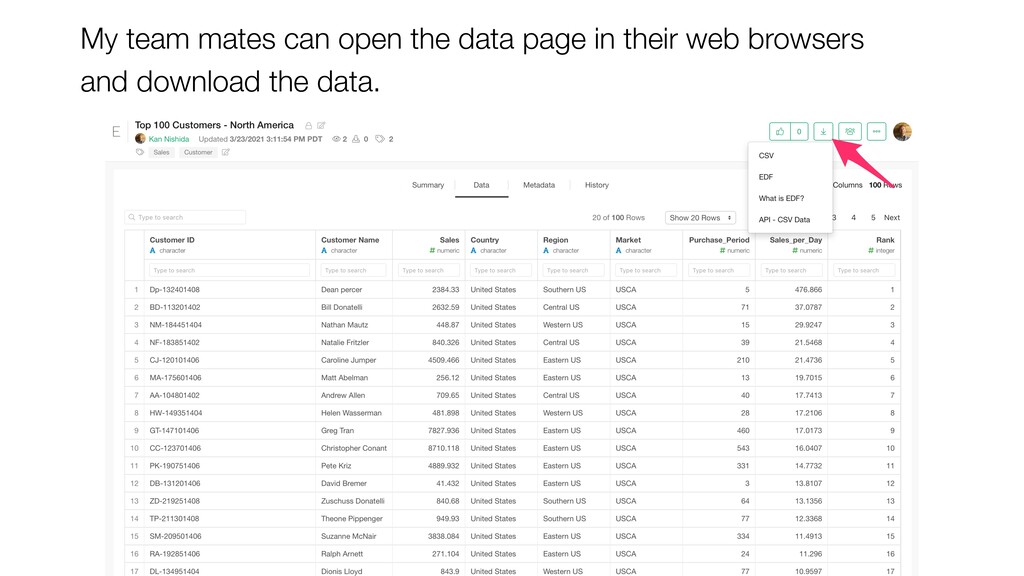
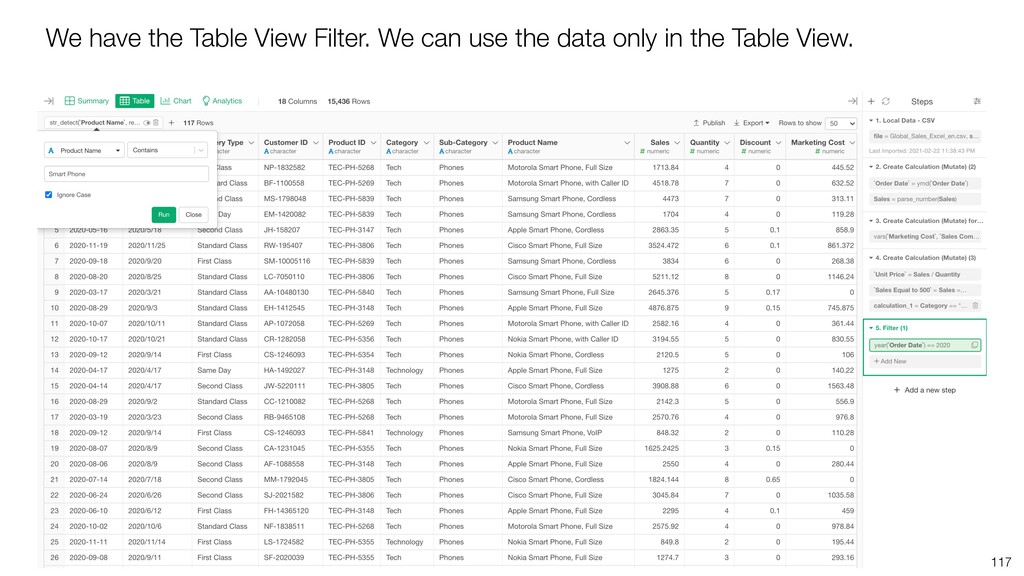
* Table View Filter
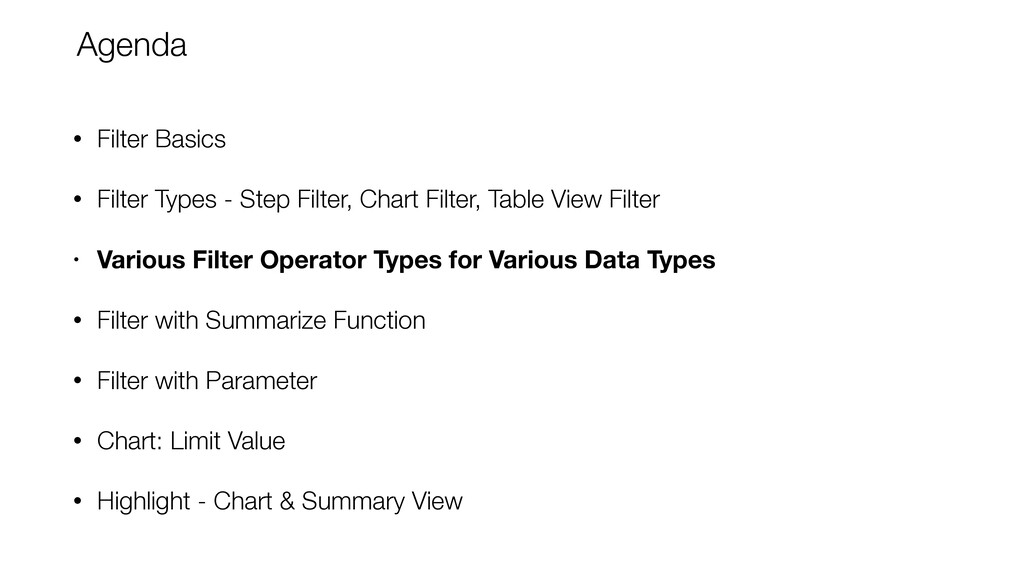
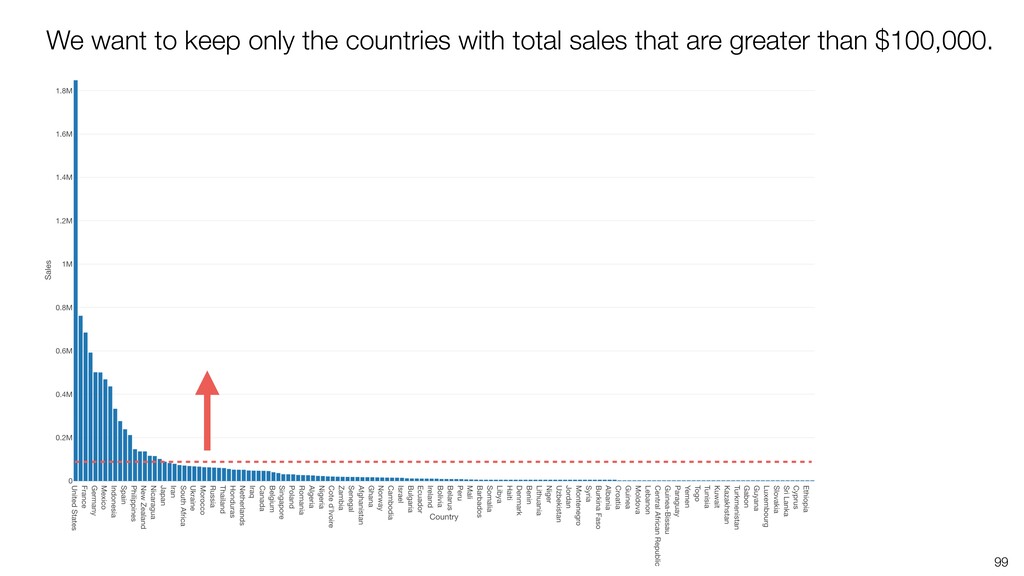
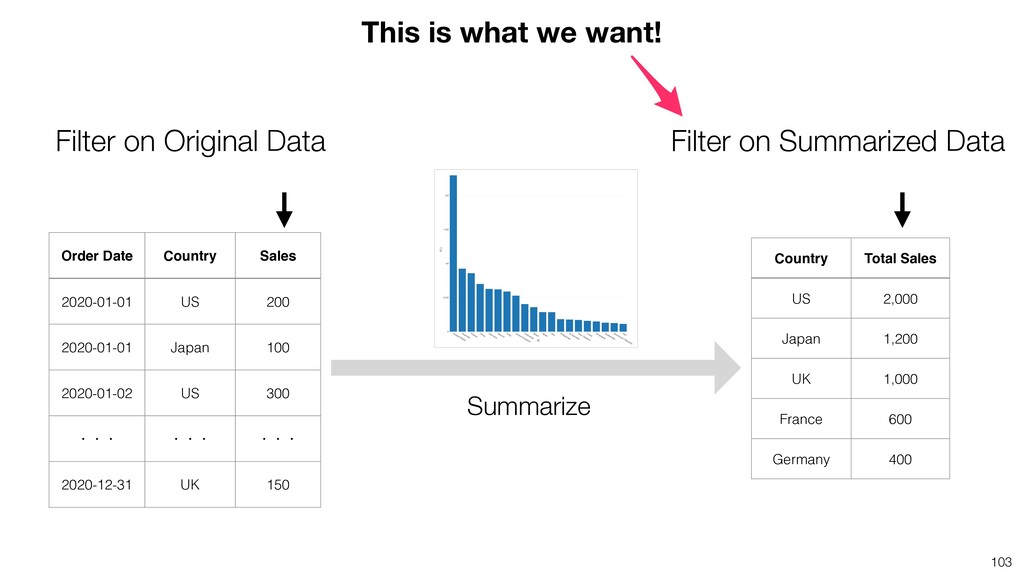
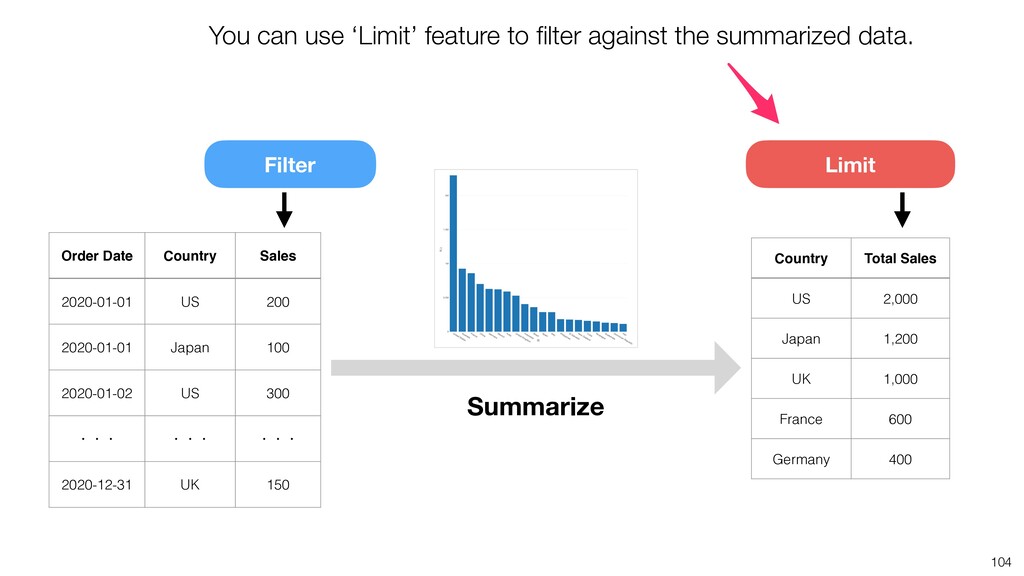
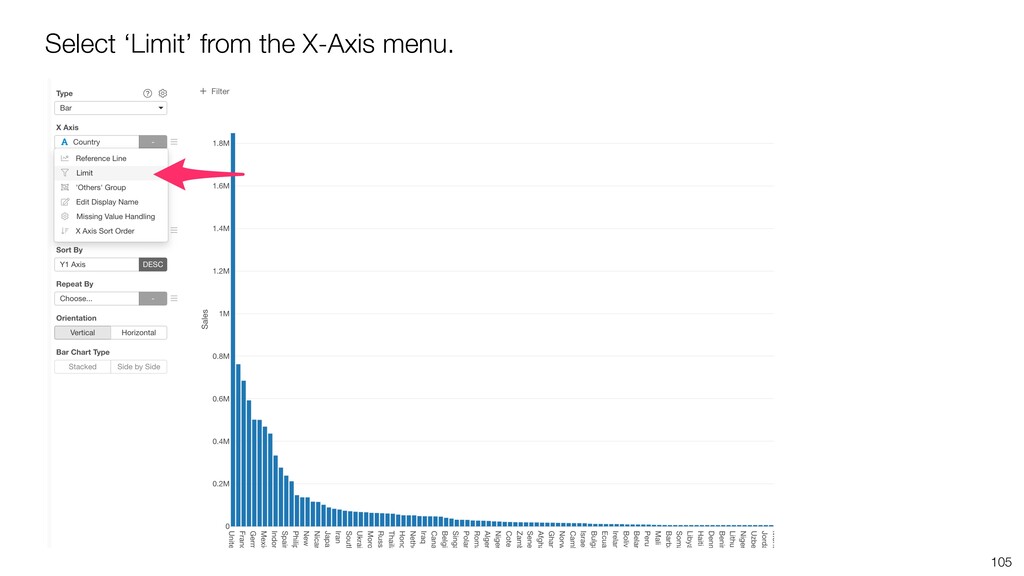
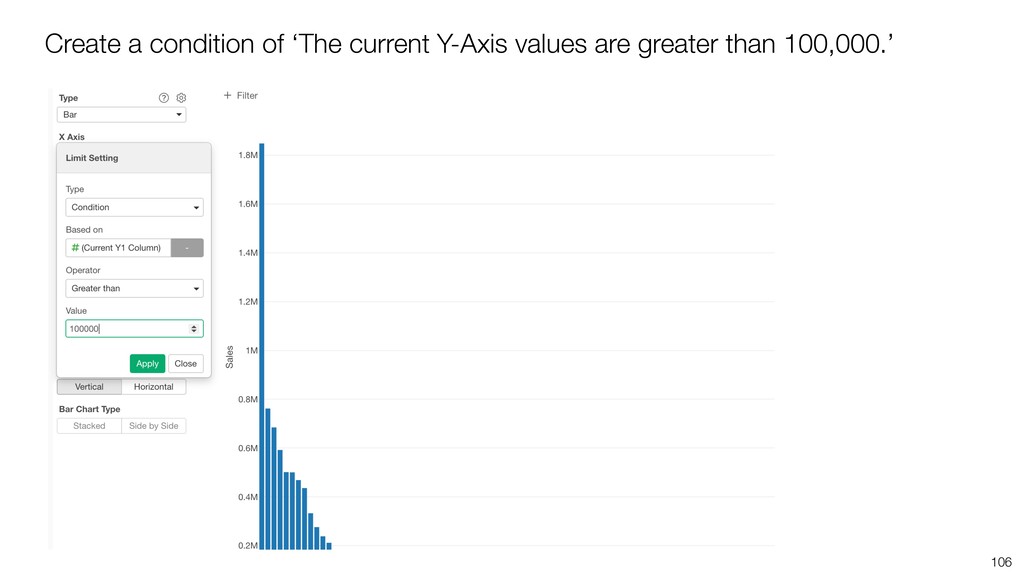
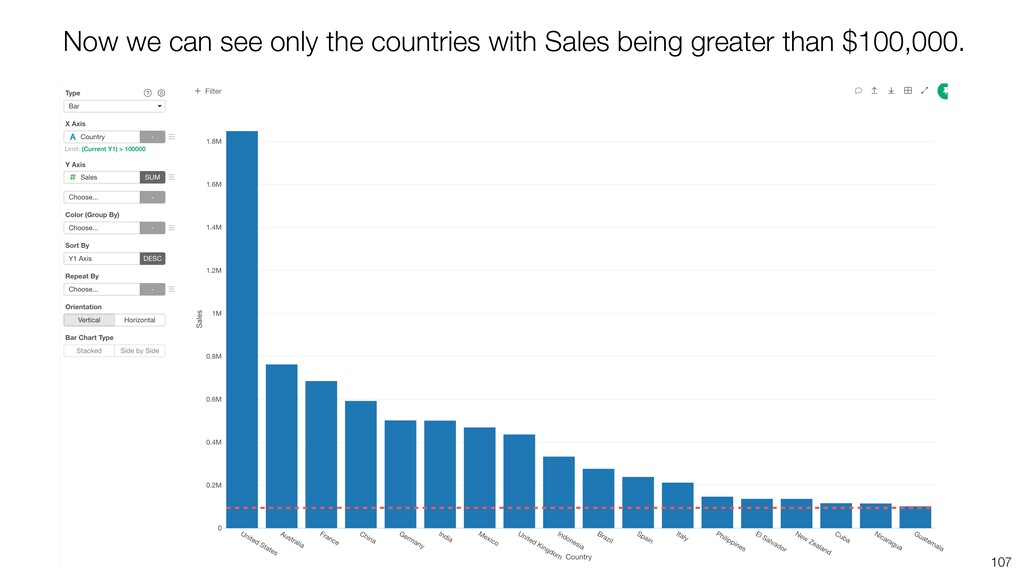
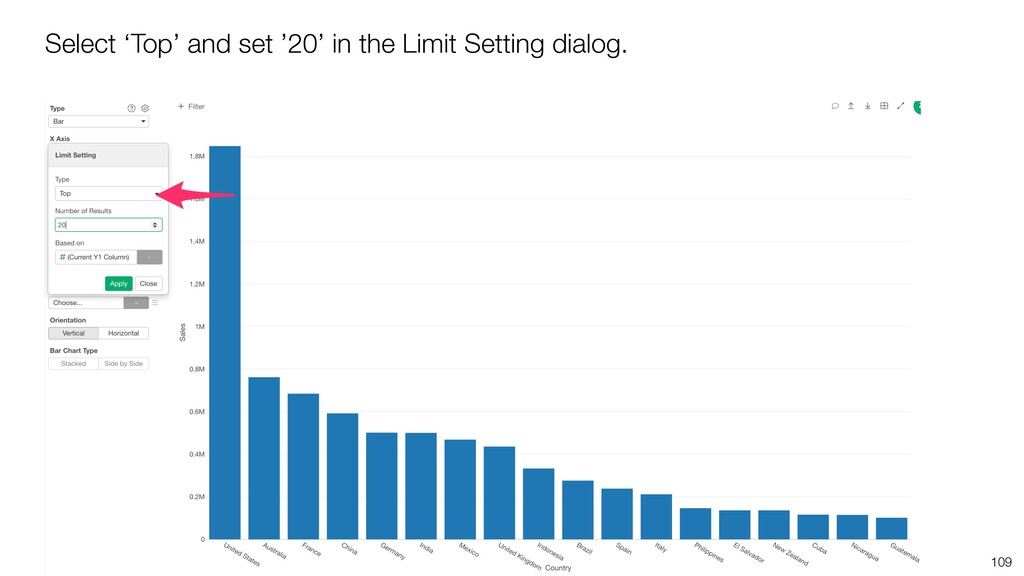
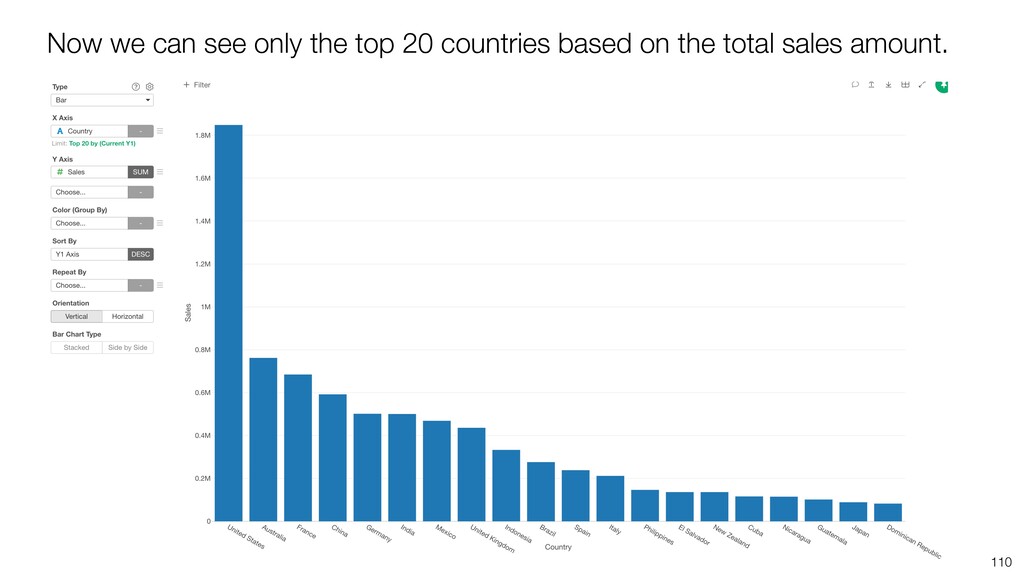
* Chart - Limit Values
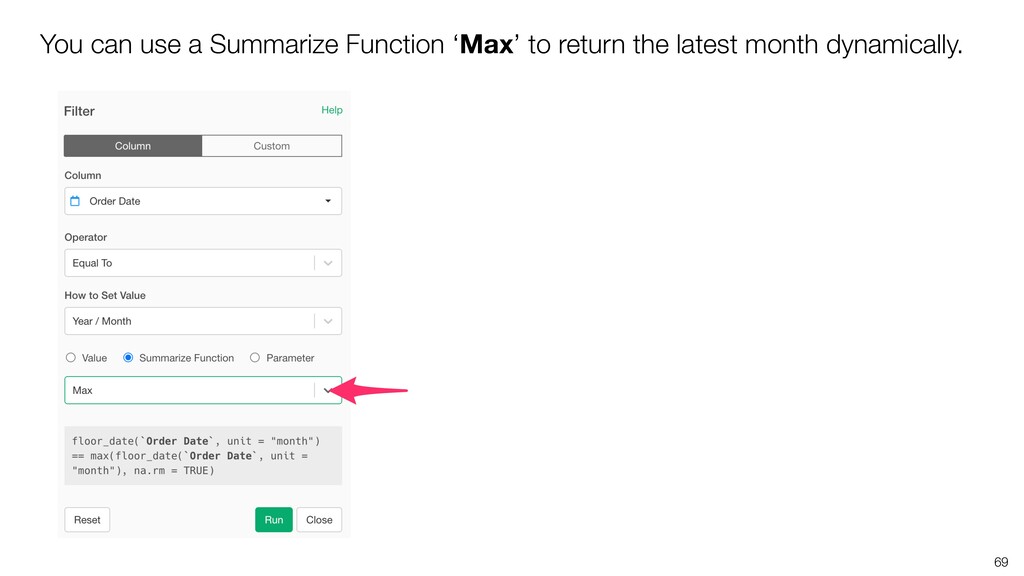
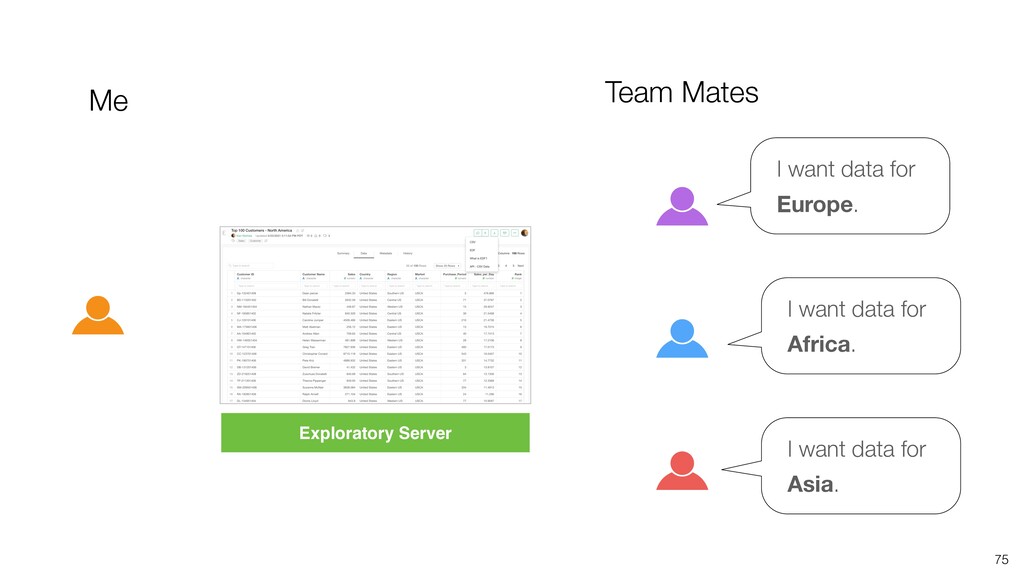
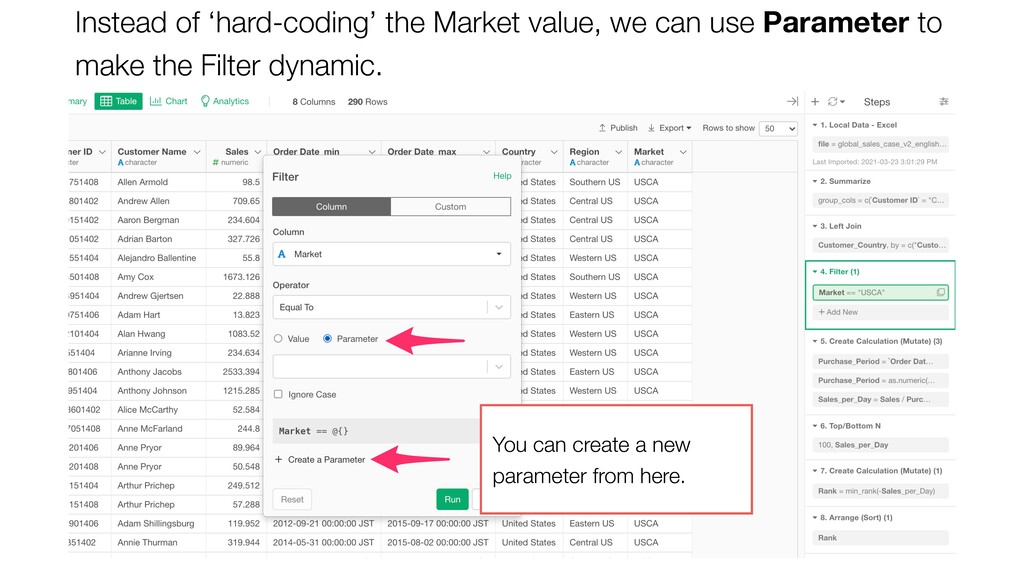
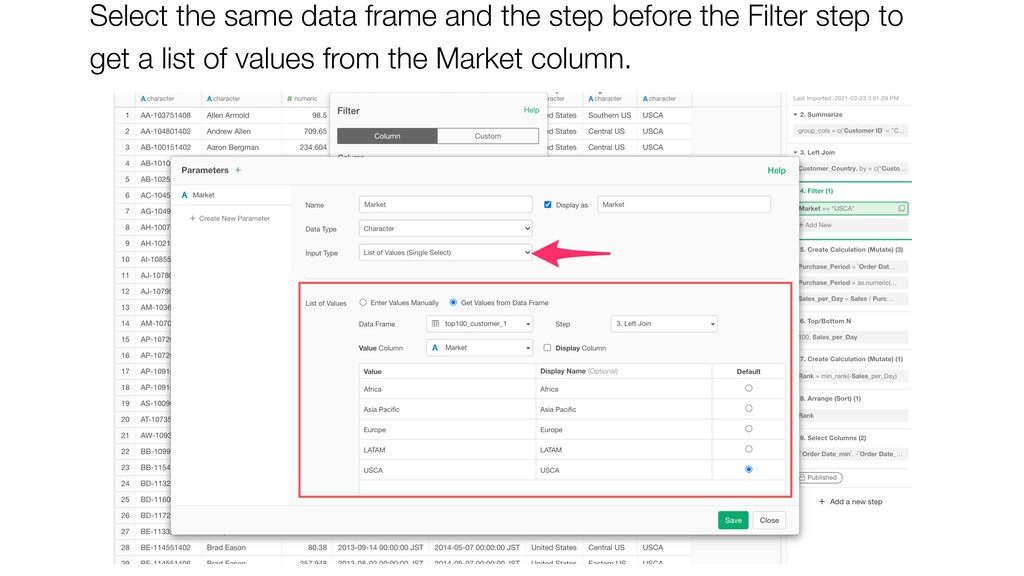
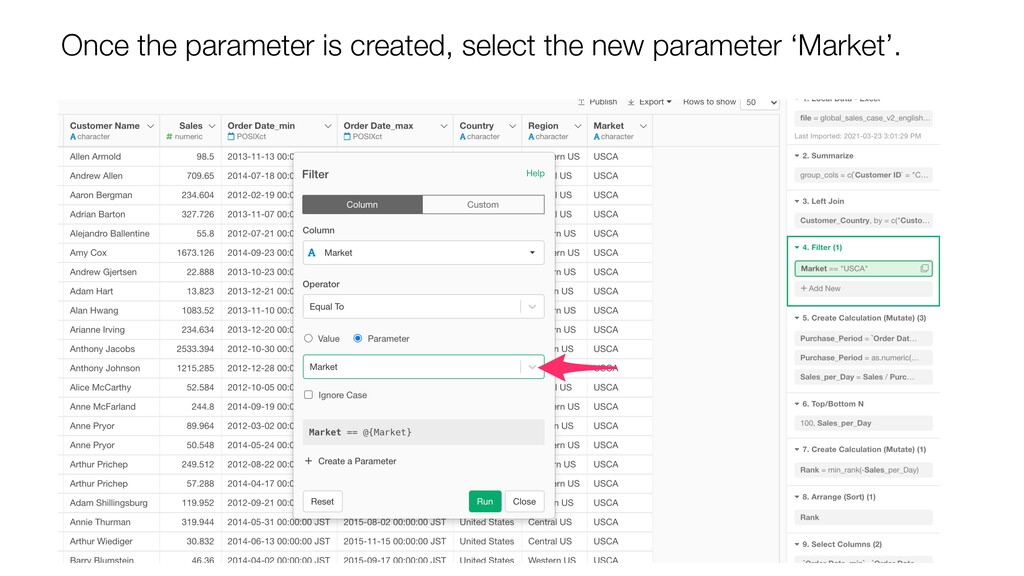
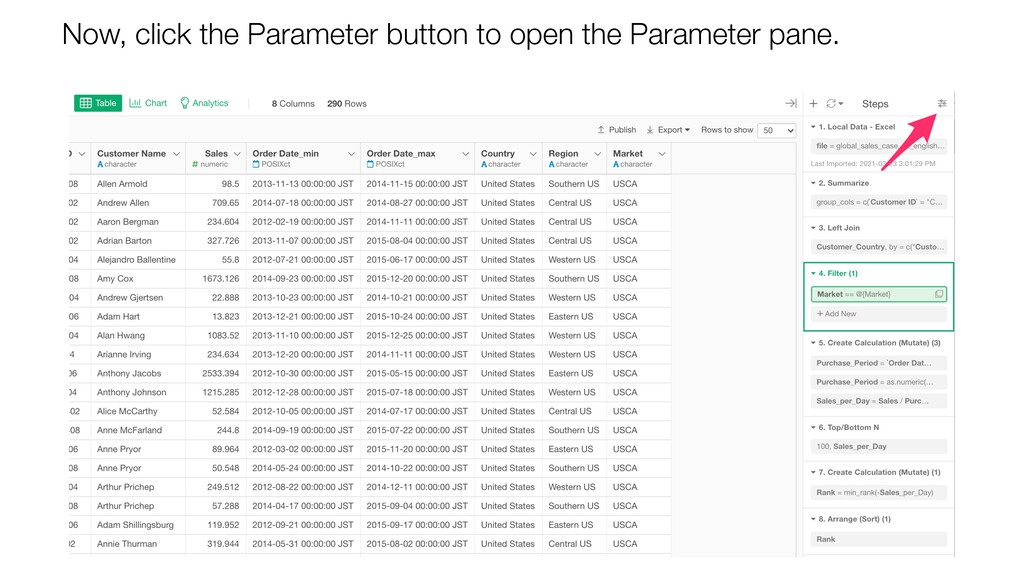
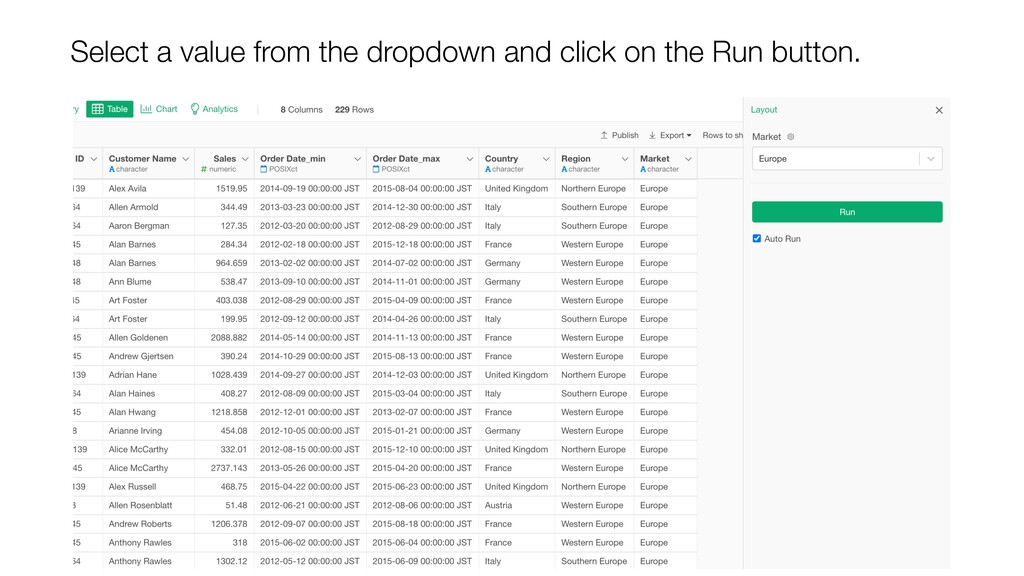
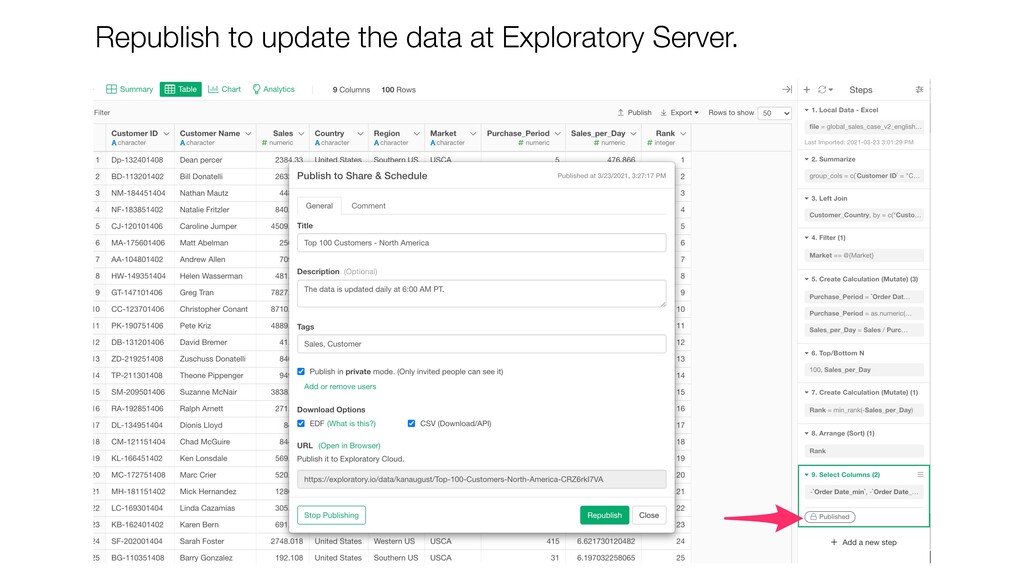
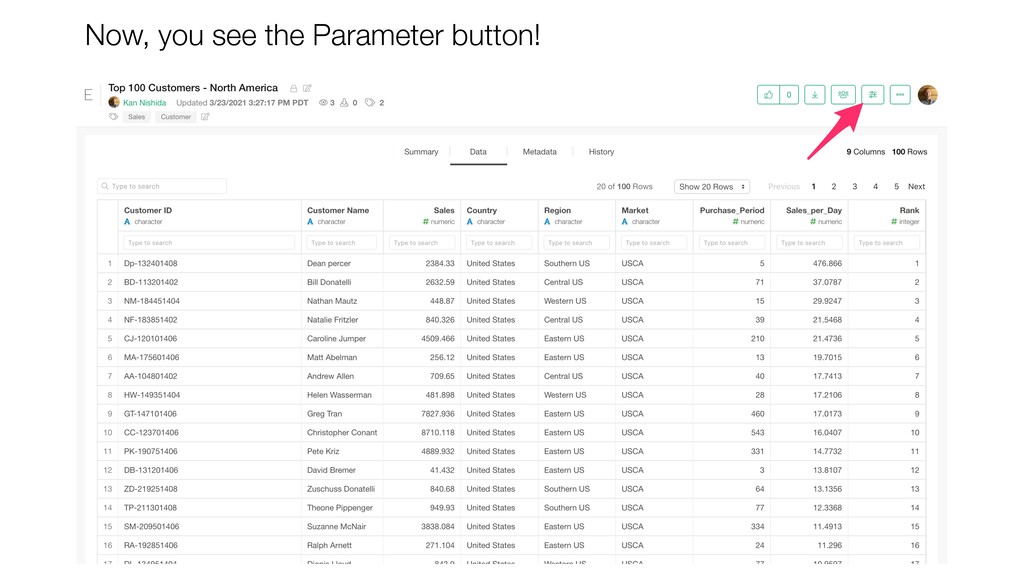
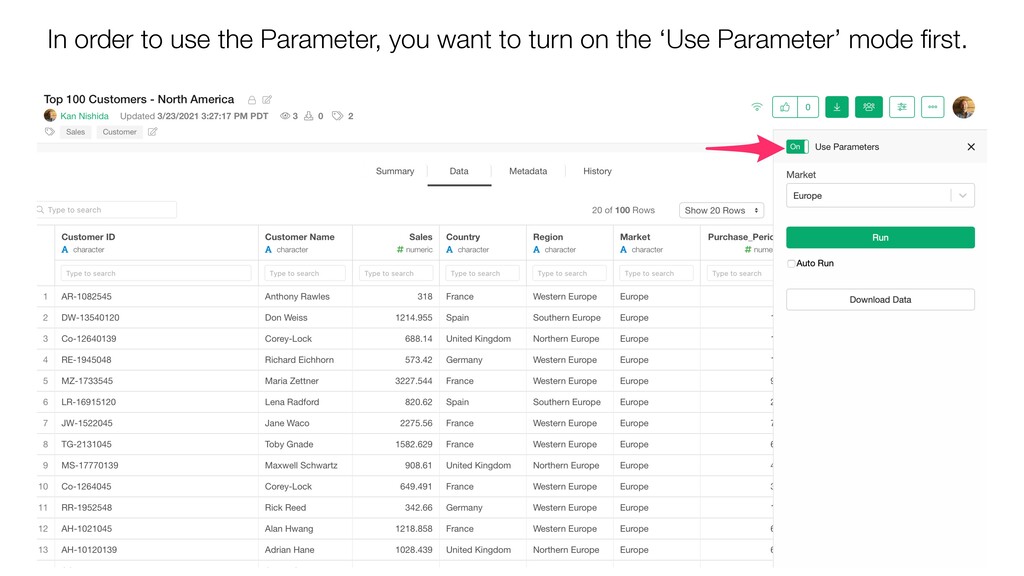
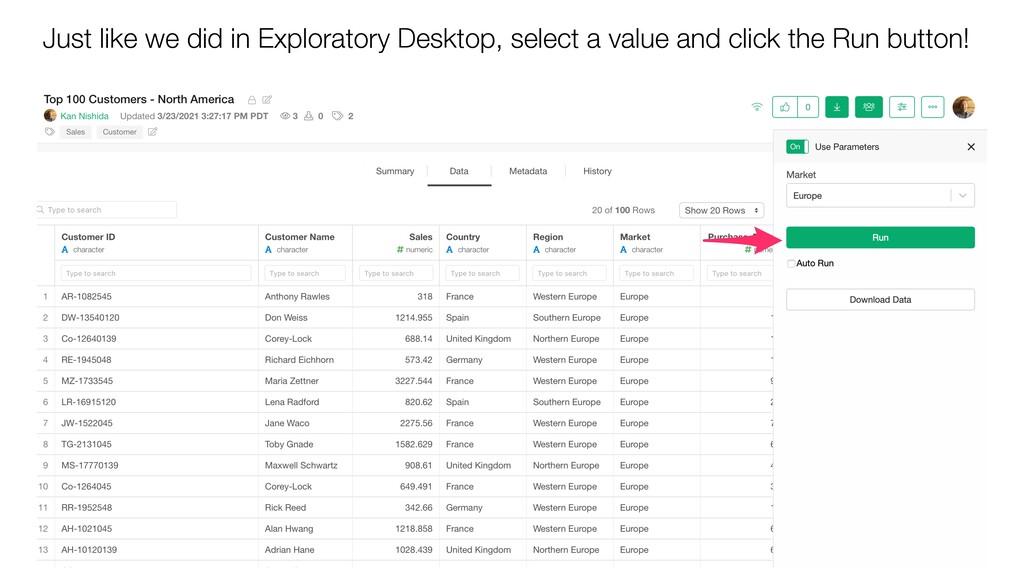
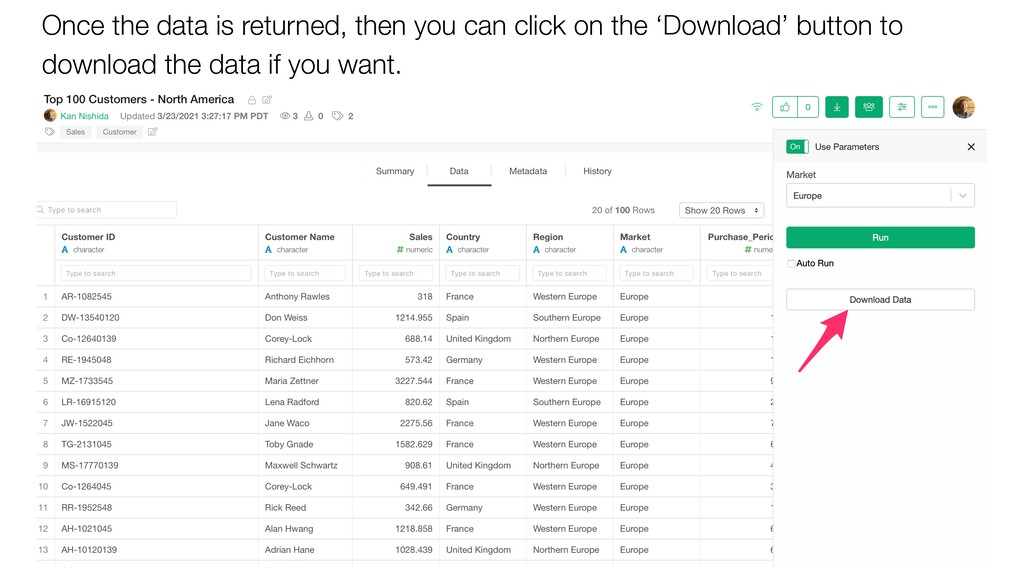
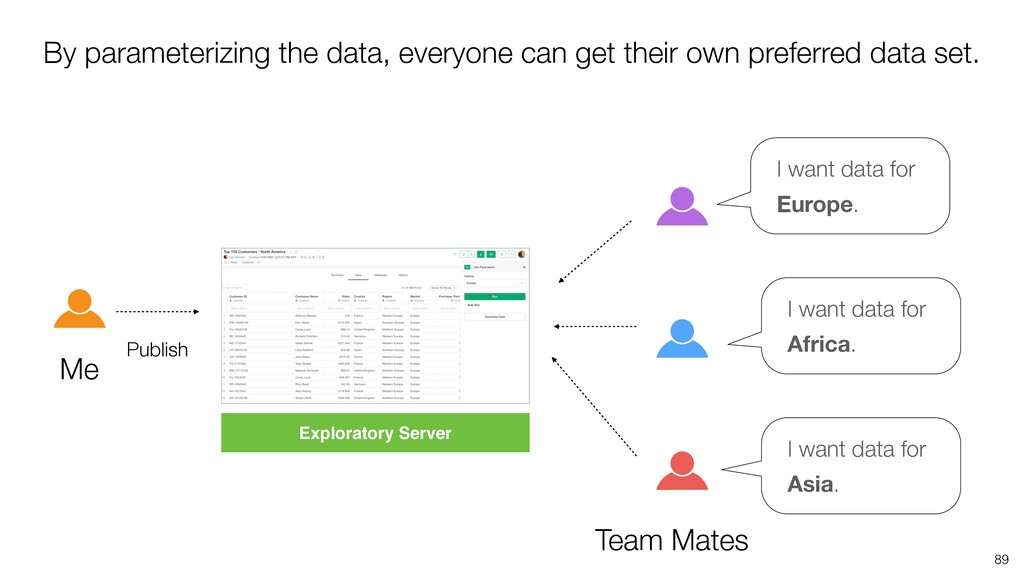
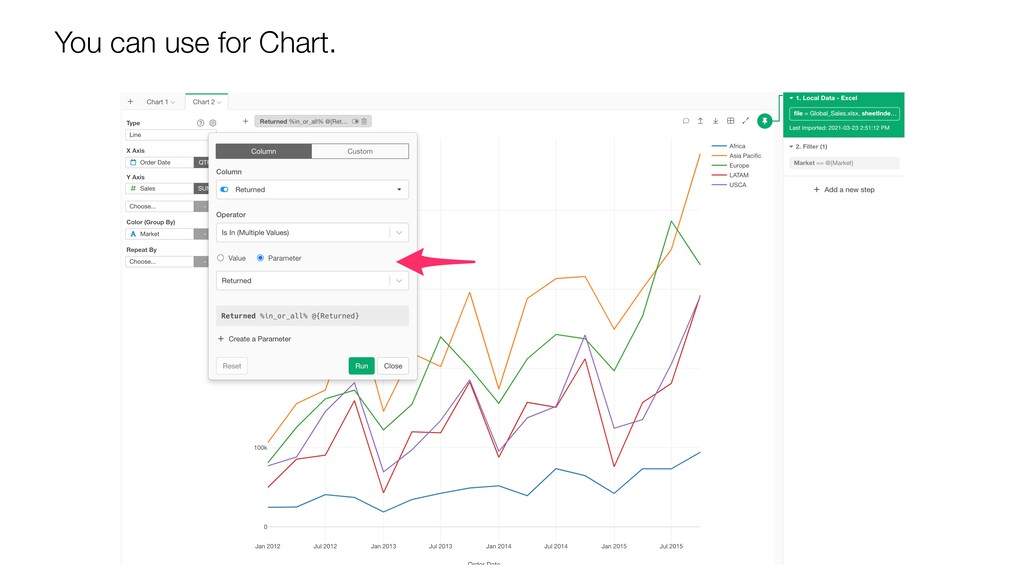
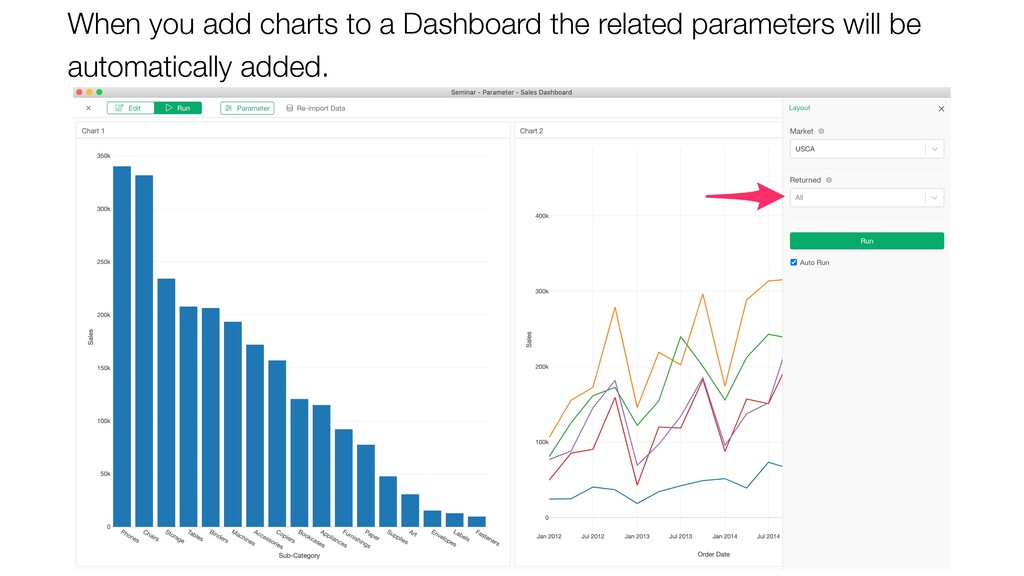
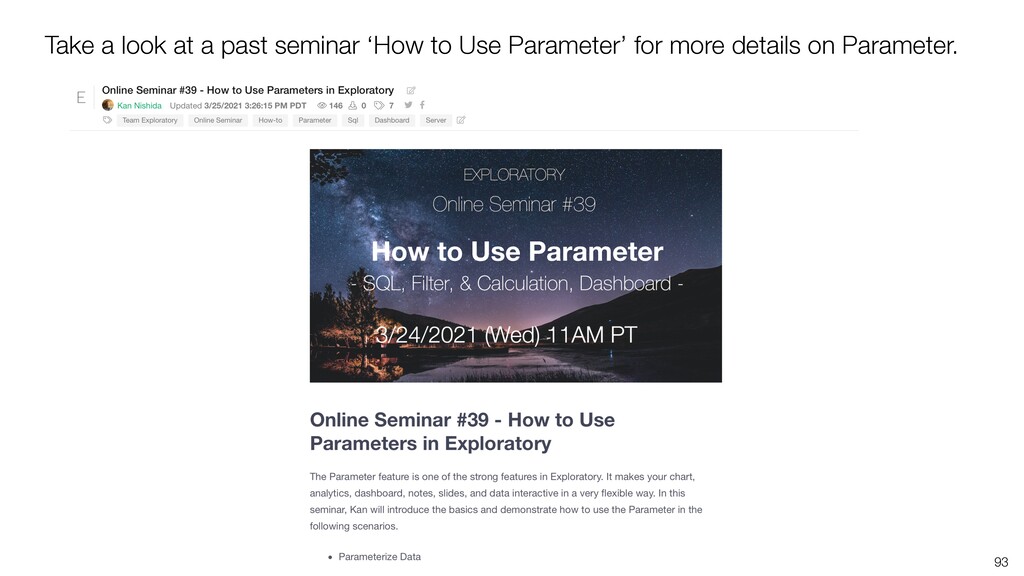
* Filter with Parameter
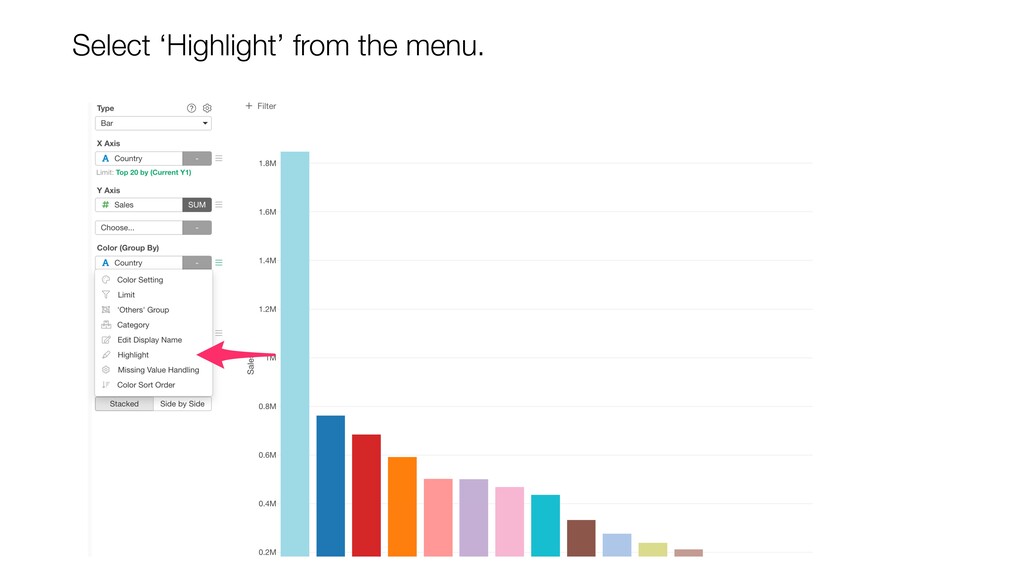
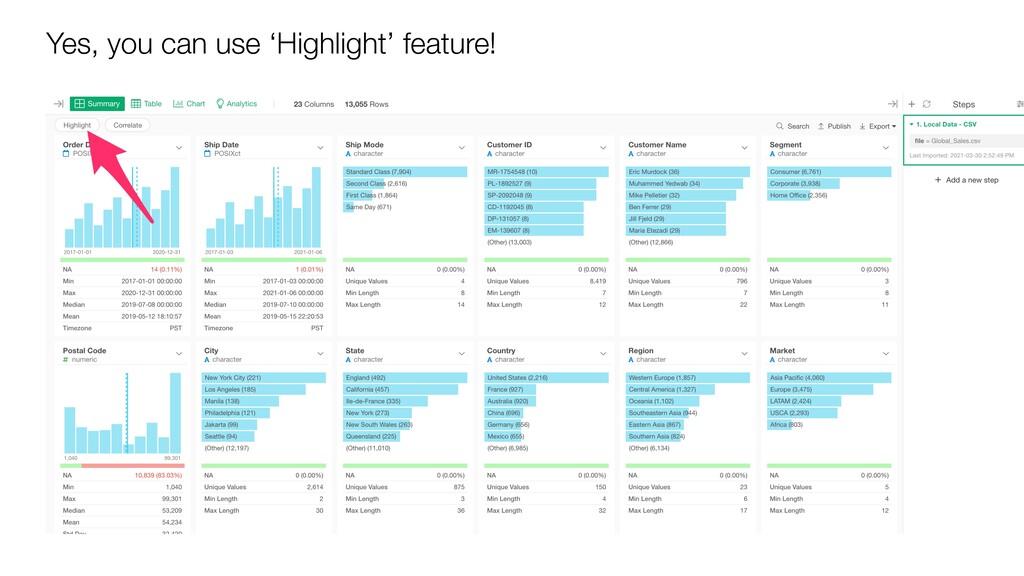
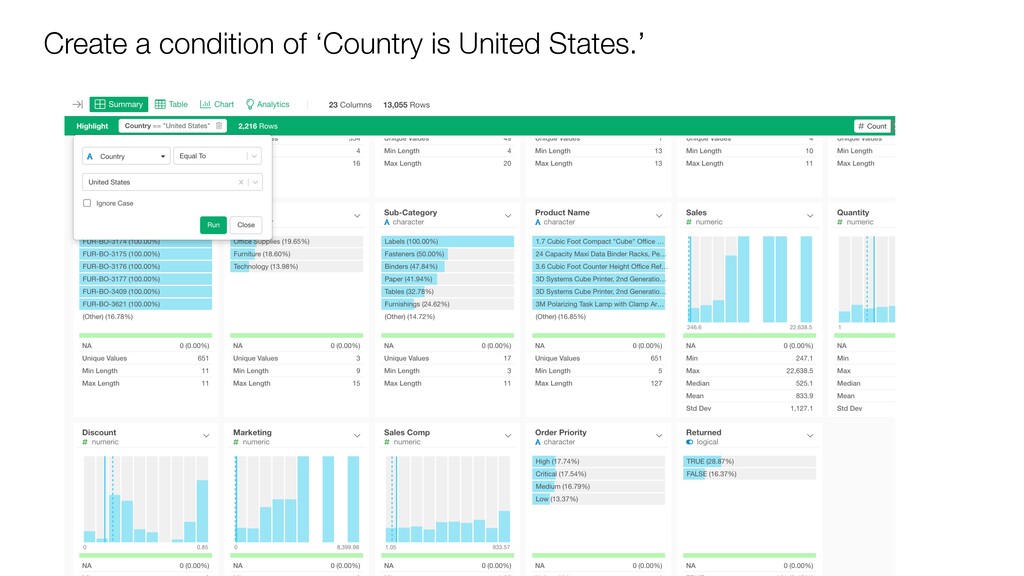
* Highlight - Summary View & Chart
Twitter ↓
https://twitter.com/ExploratoryData
UI Tool: Exploratory(https://exploratory.io/)
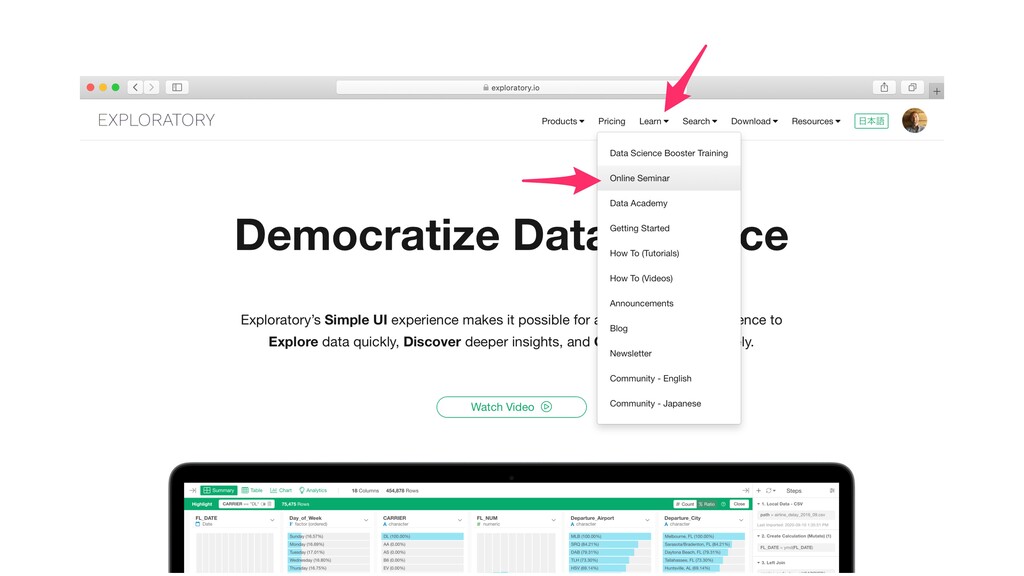
Exploratory Online Seminar: https://exploratory.io/online-seminar
![Information Email [email protected] Website https://exploratory.io Twitter @ExploratoryData Seminar https://exploratory.io/online-seminar](https://files.speakerdeck.com/presentations/731a424c91c5441f87020ca79ed00077/slide_125.jpg)