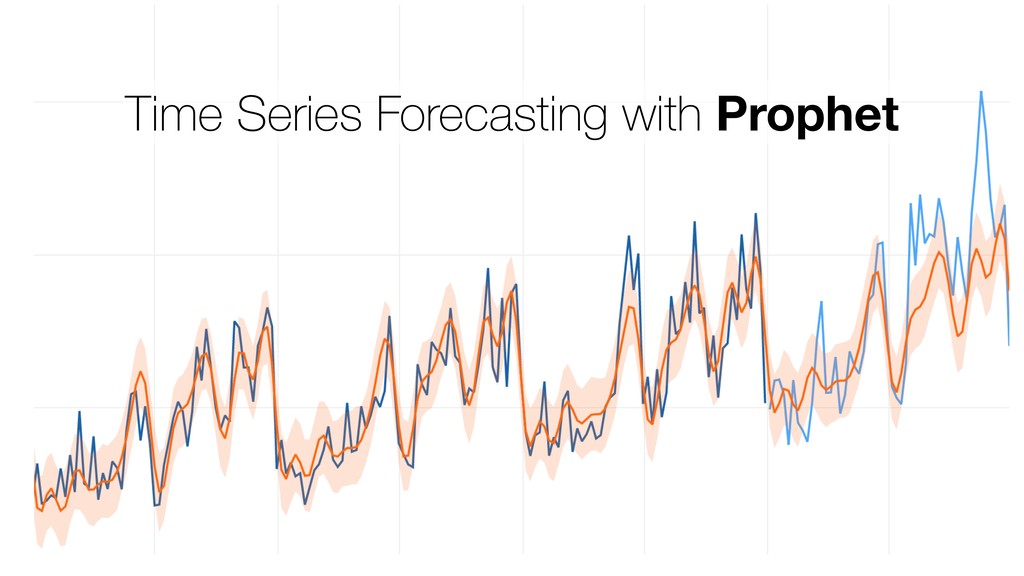
Exploratory Seminar: Time Series Forecasting with Prophet
Prophet is an easy to use time series forecasting algorithm developed by Sean Taylor and co. at Facebook. I’ll be demonstrating how to use it in Exploratory.
Inc. to make Data Science available for everyone. Prior to Exploratory, Kan was a development director at Oracle leading development teams for building various Data Science products in areas including Machine Learning, BI, Data Visualization, Mobile Analytics, Big Data, etc. While at Oracle, Kan also provided training and consulting services to help organizations transform by data. @KanAugust Instructor
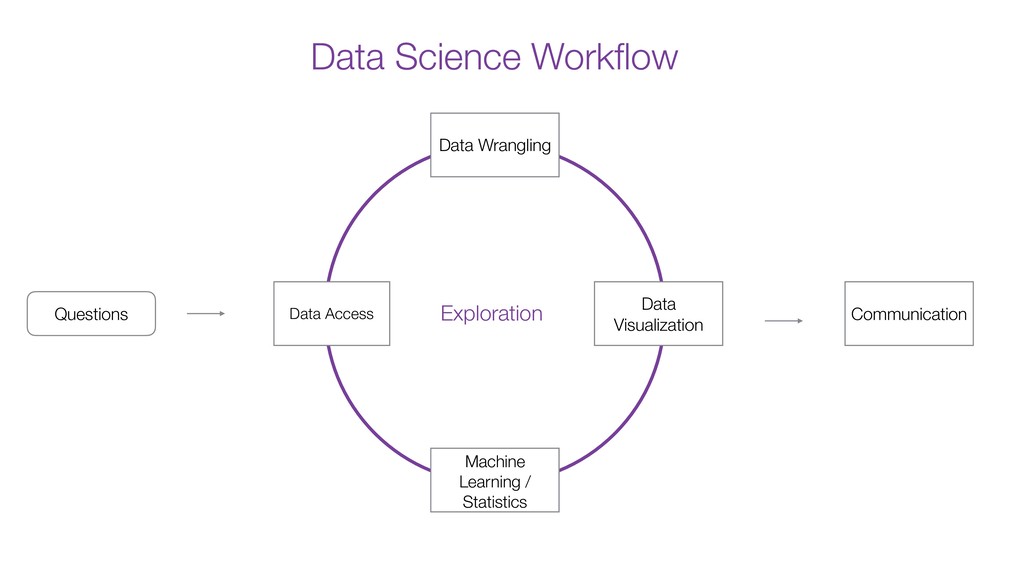
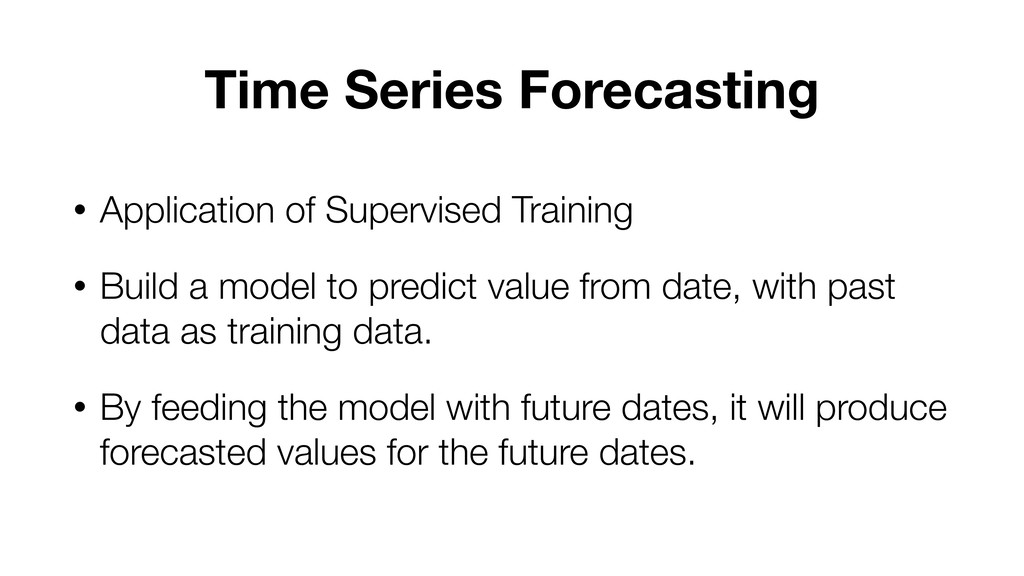
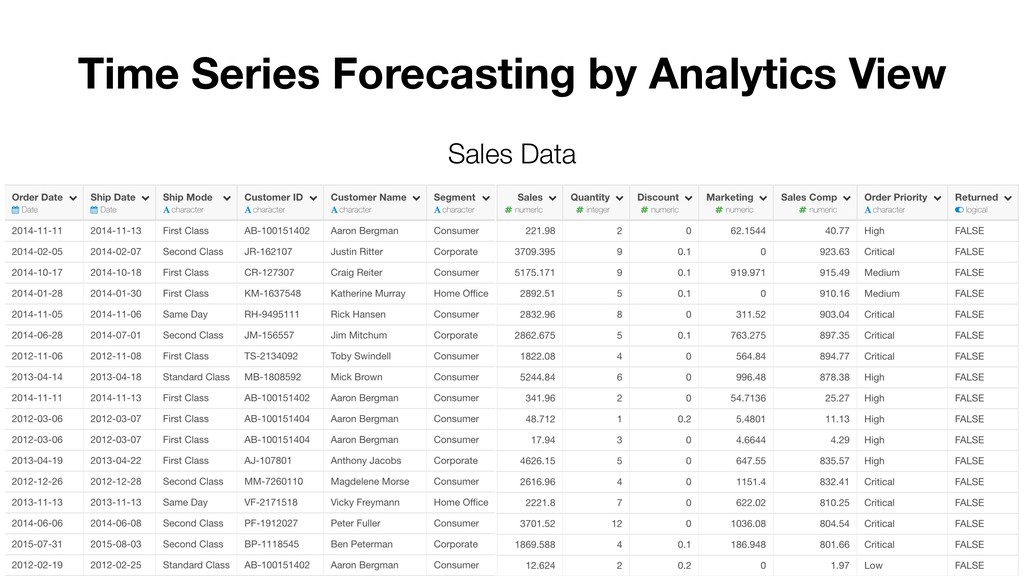
predict value from date, with past data as training data. • By feeding the model with future dates, it will produce forecasted values for the future dates. Time Series Forecasting
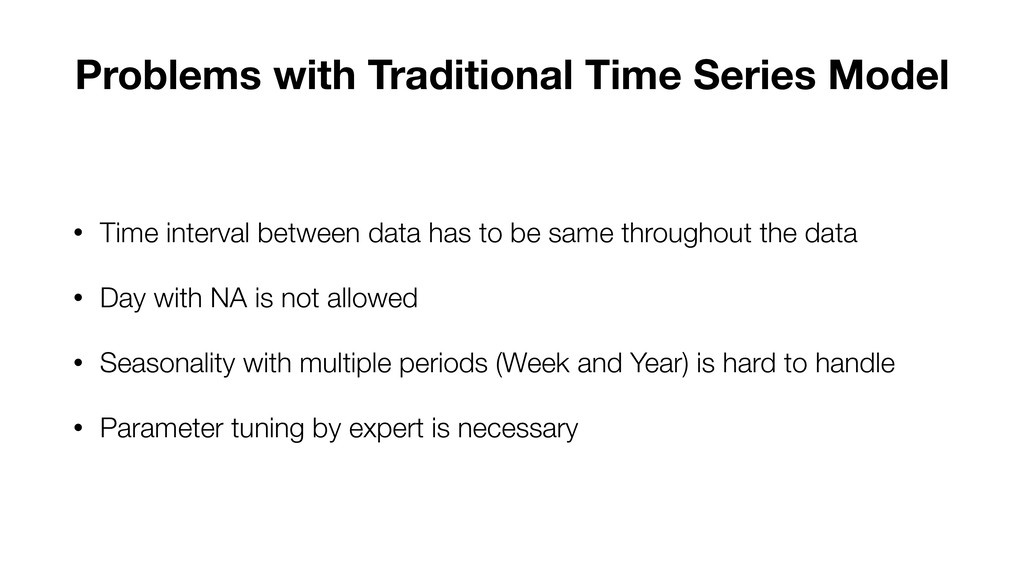
the data • Day with NA is not allowed • Seasonality with multiple periods (Week and Year) is hard to handle • Parameter tuning by expert is necessary Problems with Traditional Time Series Model
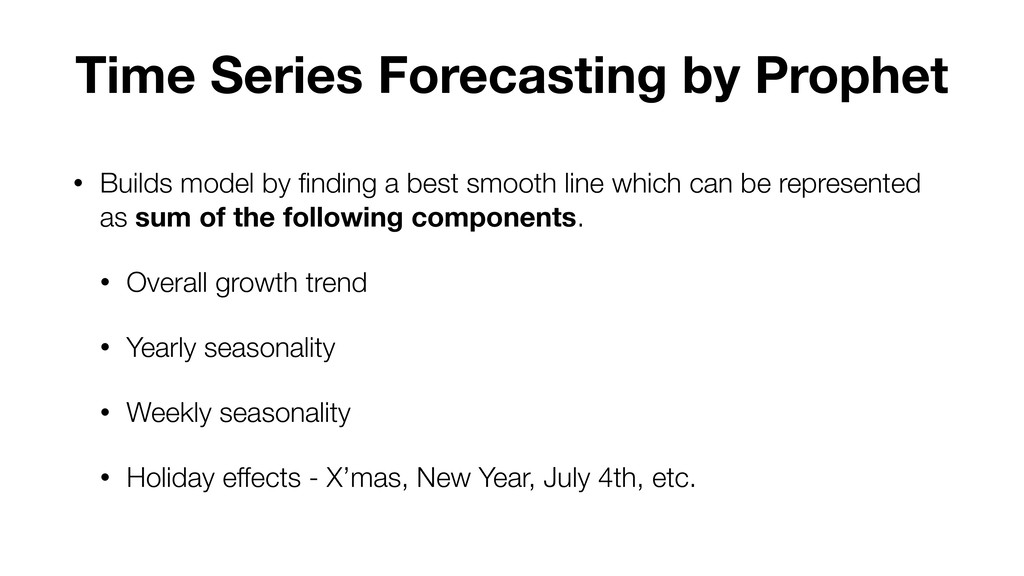
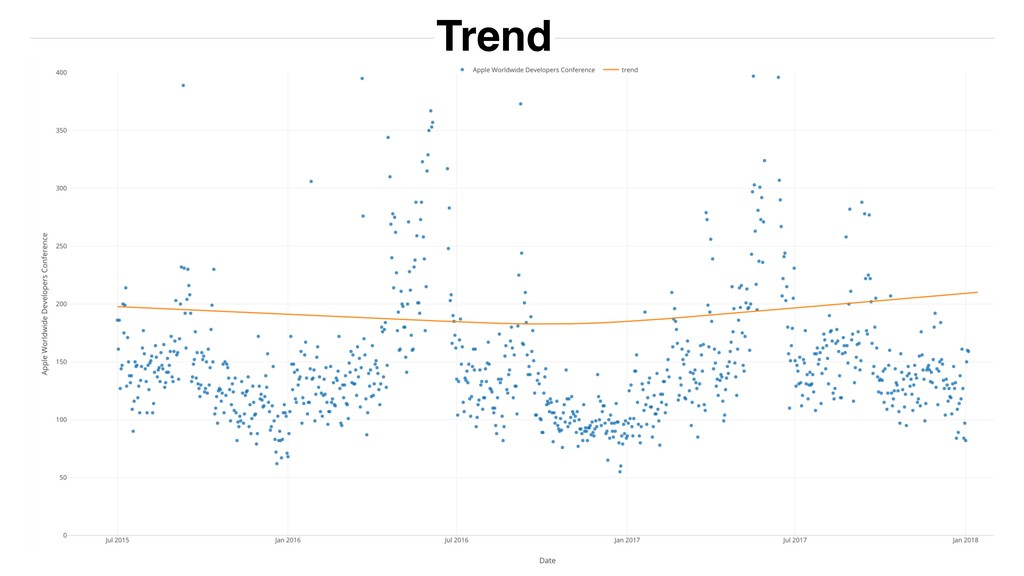
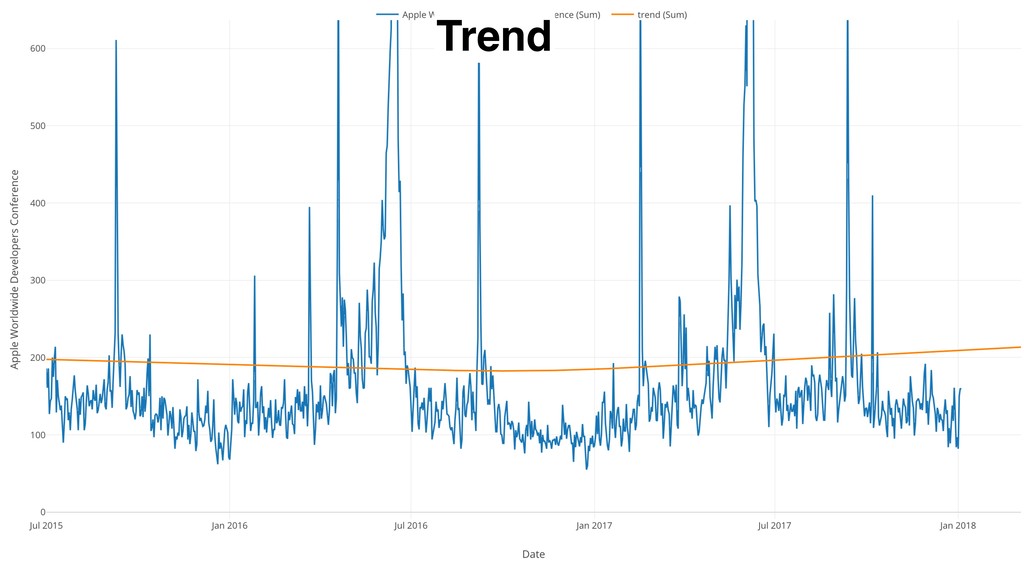
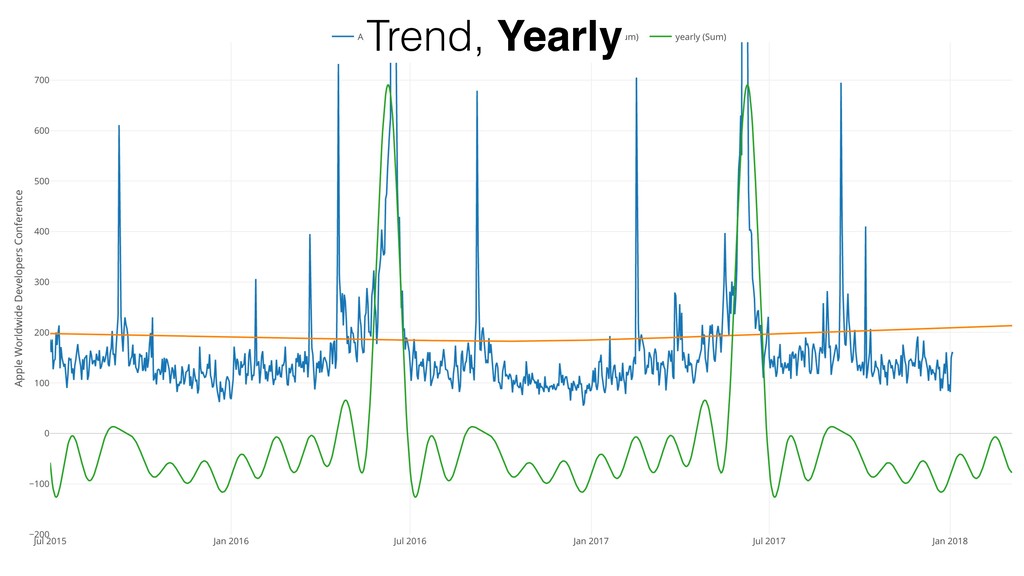
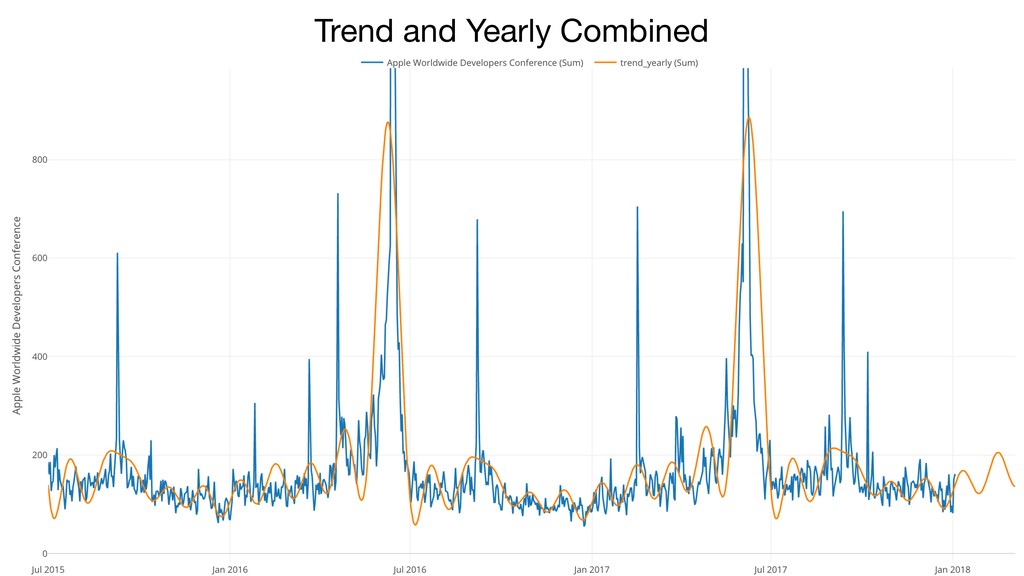
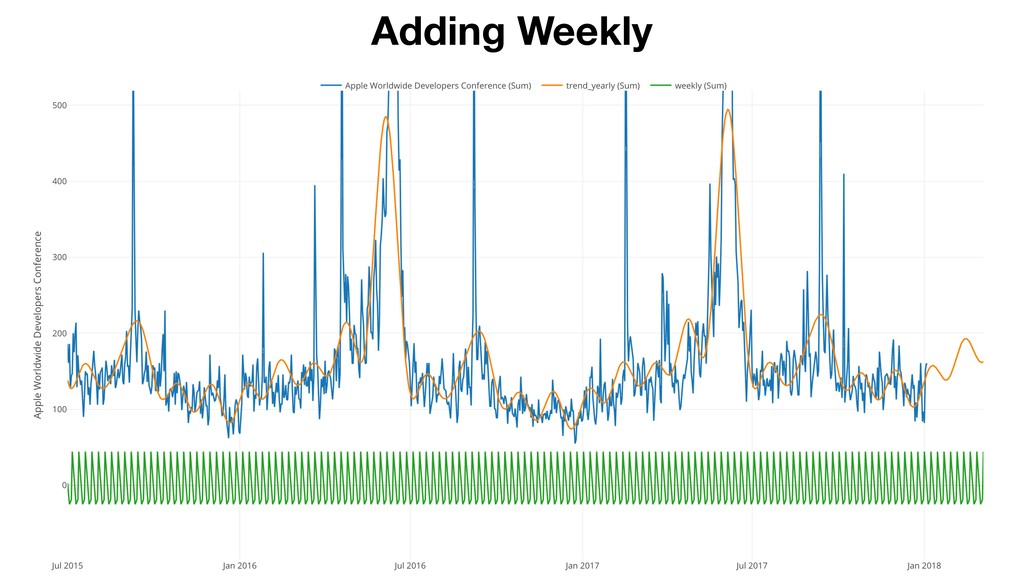
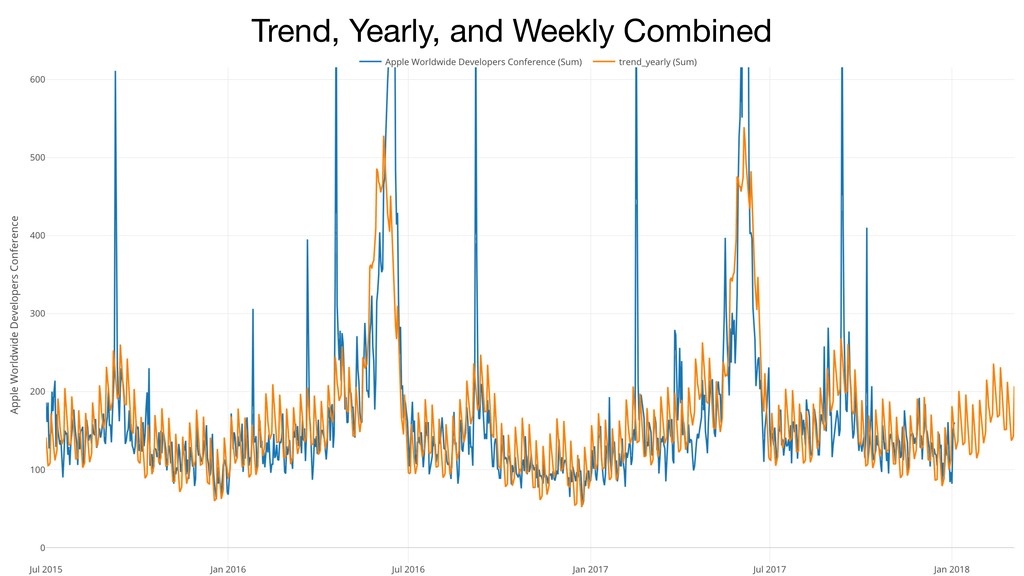
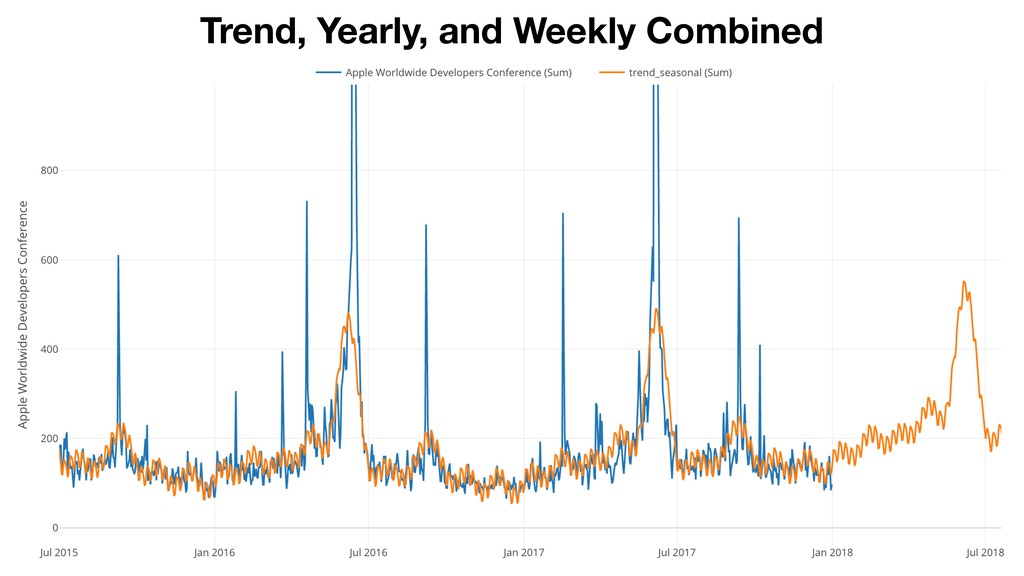
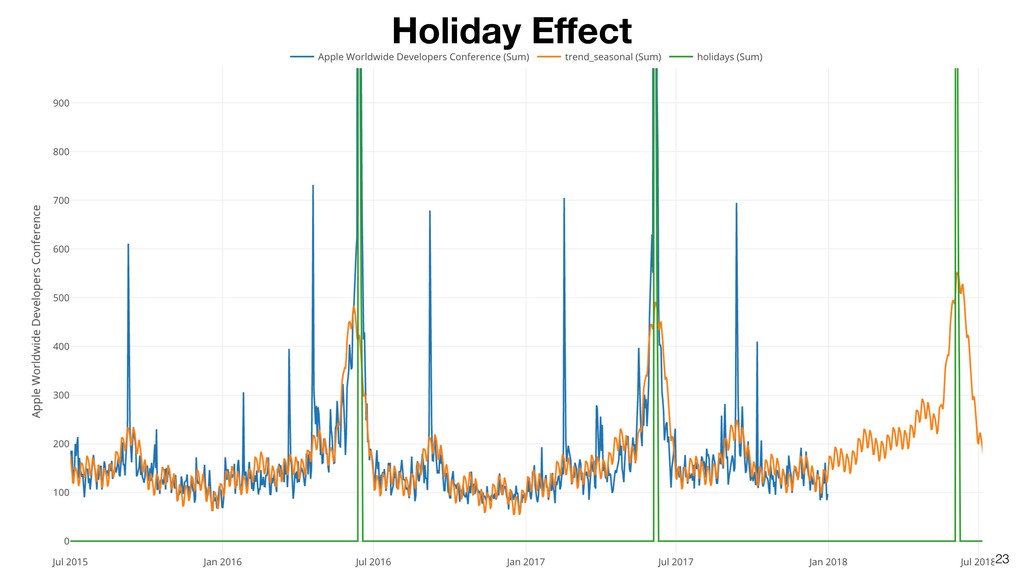
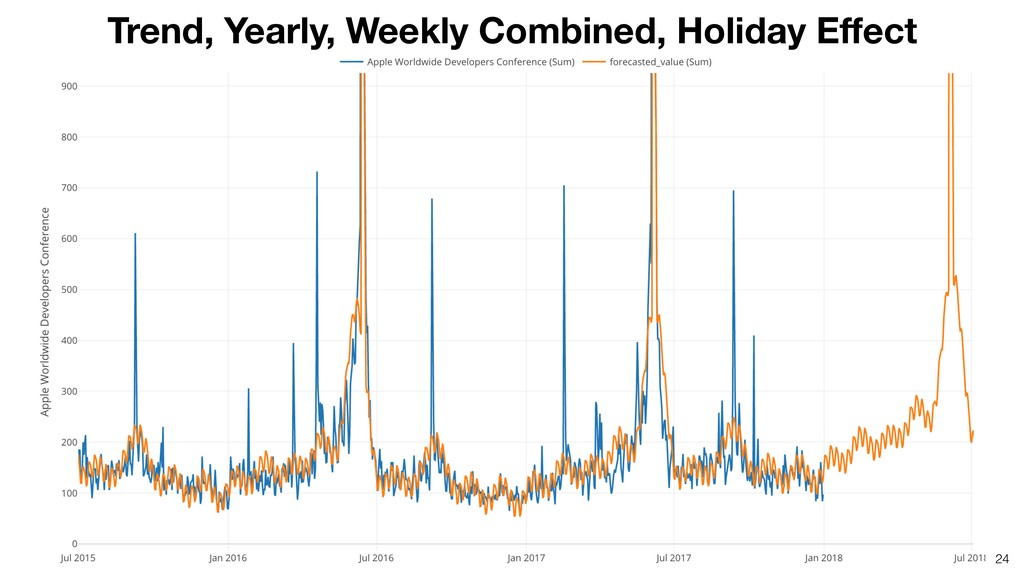
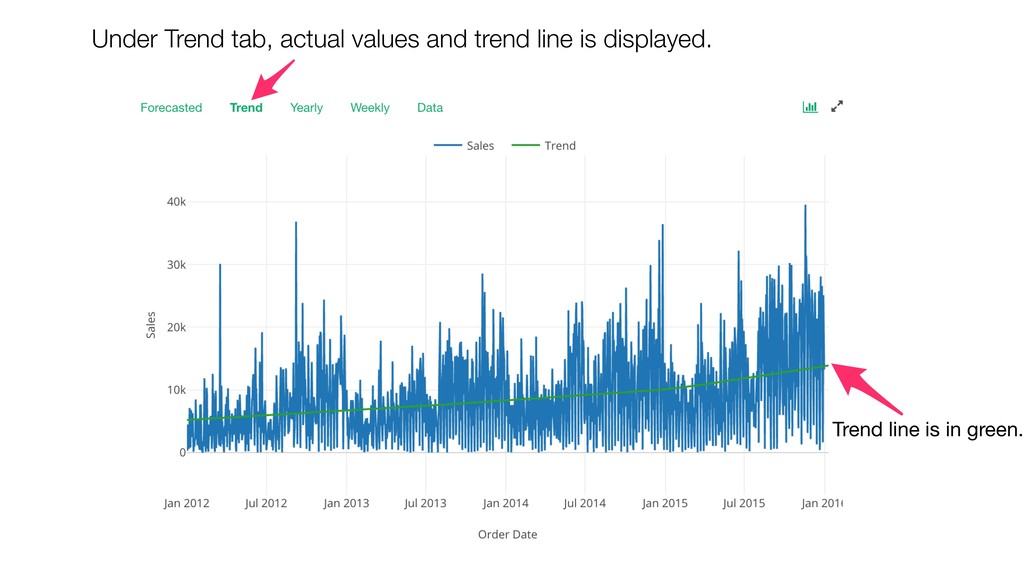
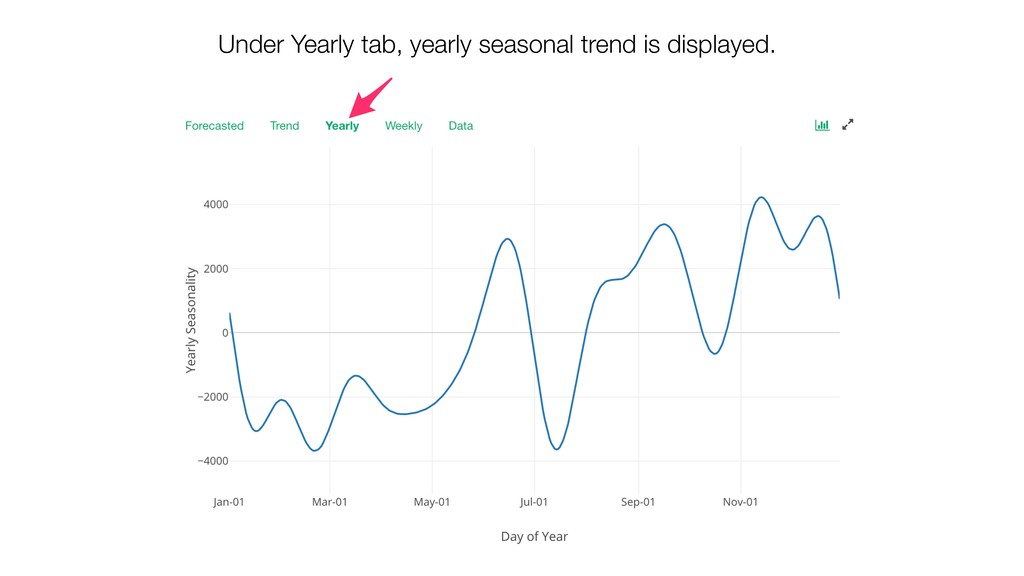
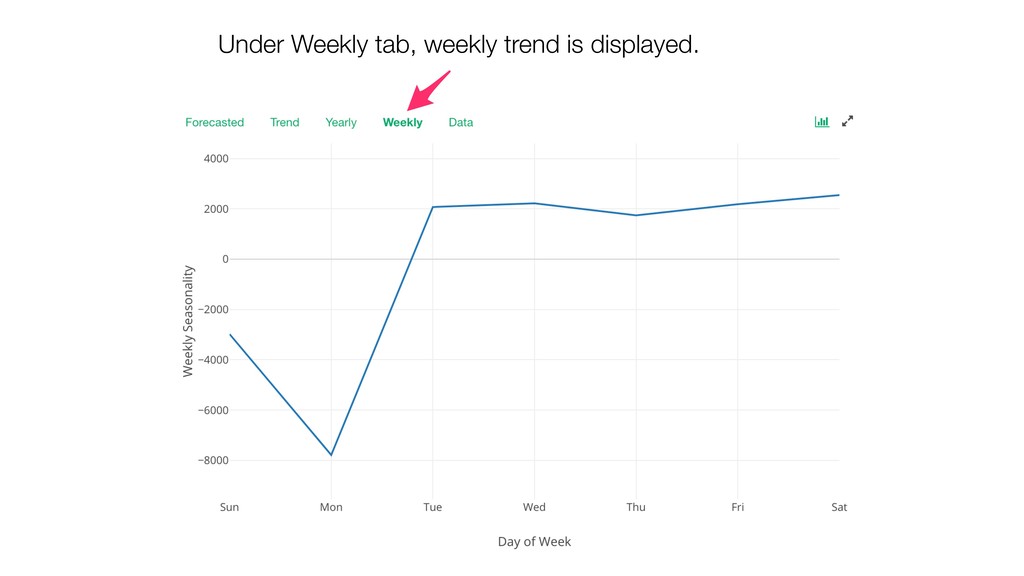
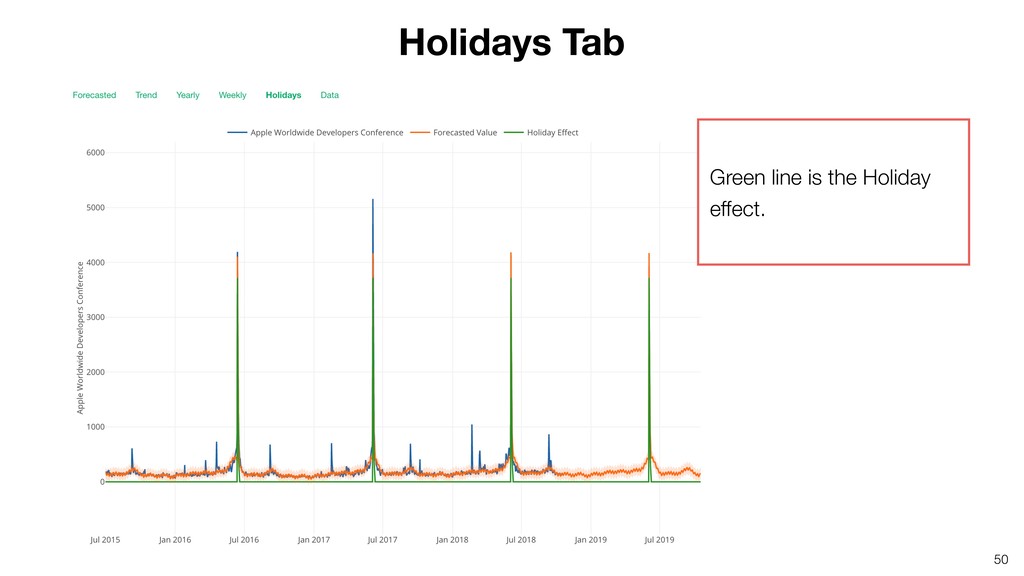
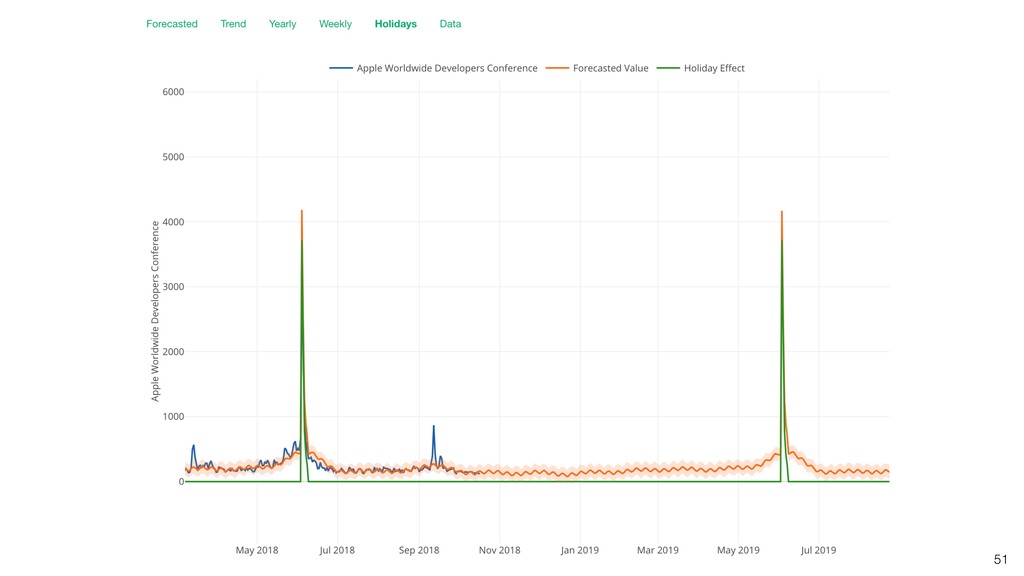
can be represented as sum of the following components. • Overall growth trend • Yearly seasonality • Weekly seasonality • Holiday effects - X’mas, New Year, July 4th, etc. Time Series Forecasting by Prophet
• Day with NA is not a problem. • Seasonality with multiple periods (Week and Year) is handled by default. • Works well by default setting. Parameters are easily interpretable Benefit of Prophet Approach
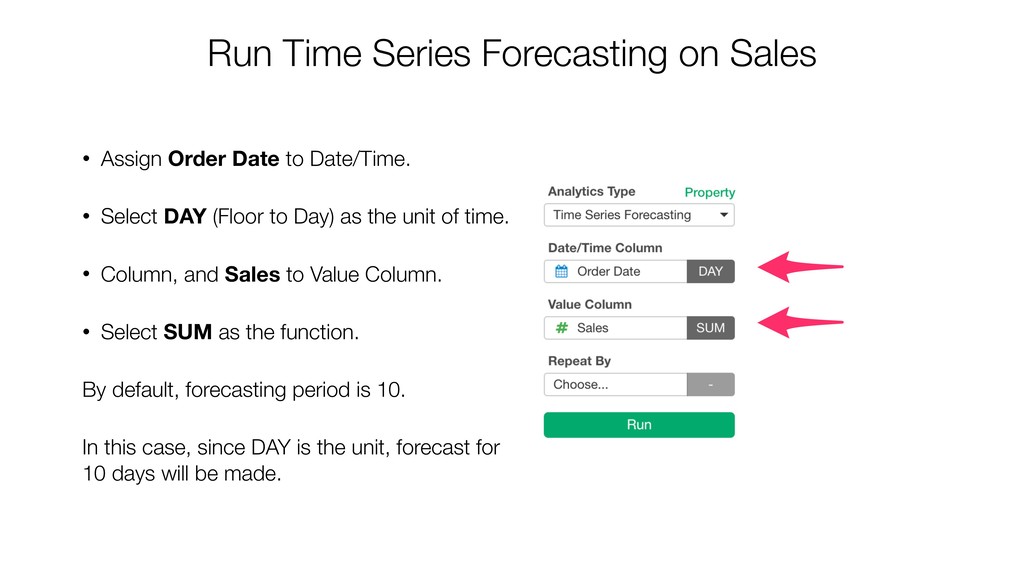
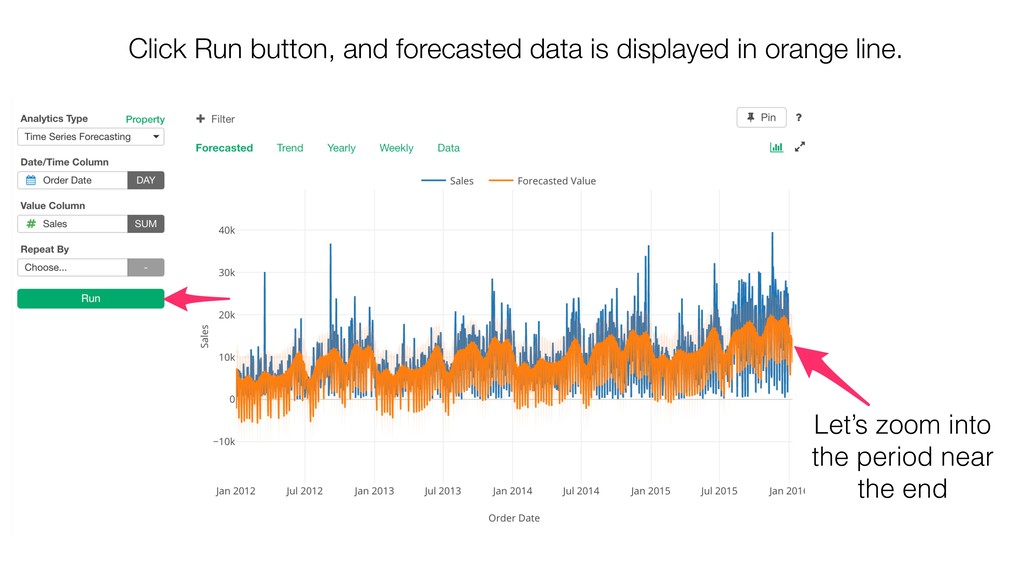
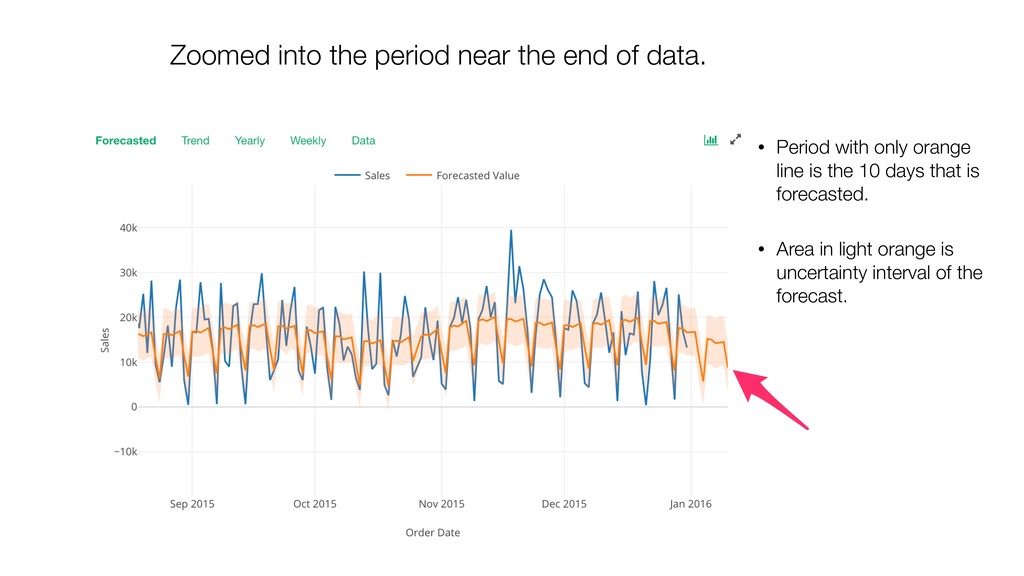
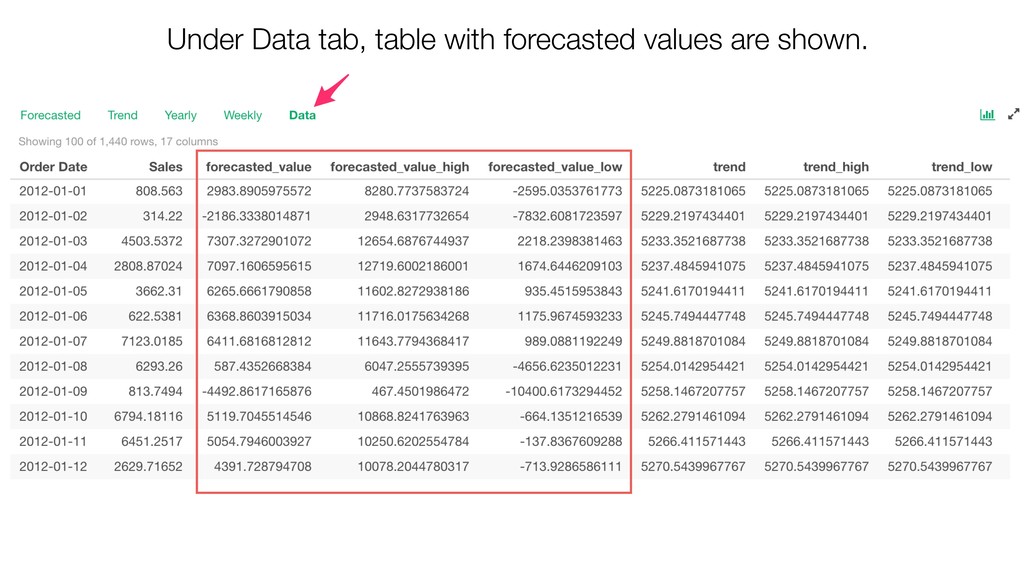
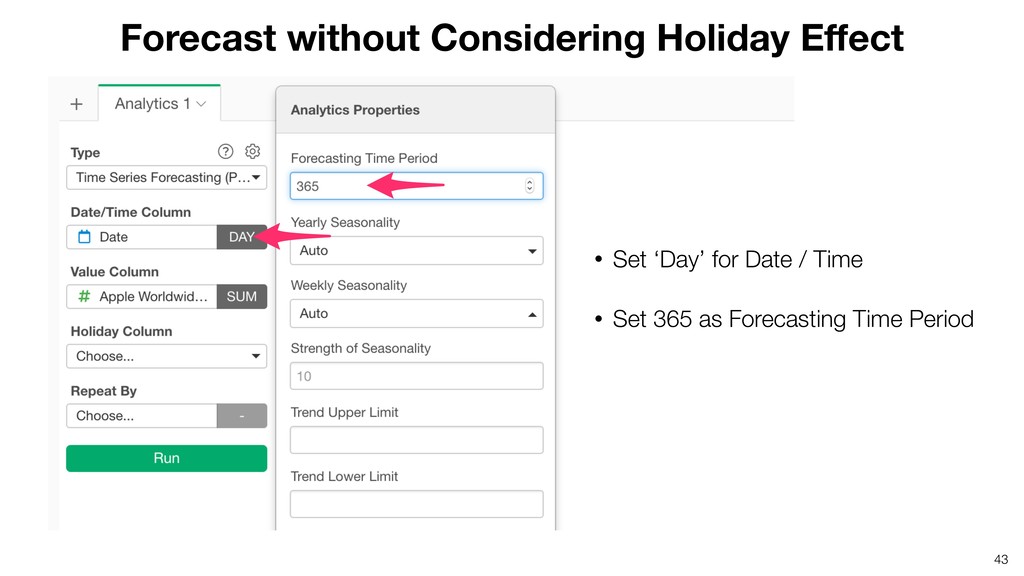
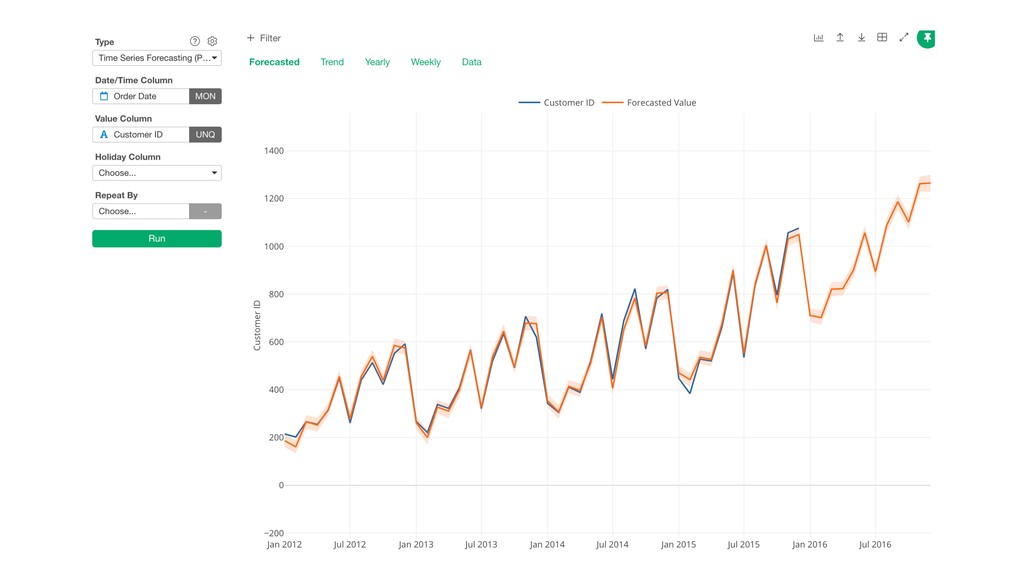
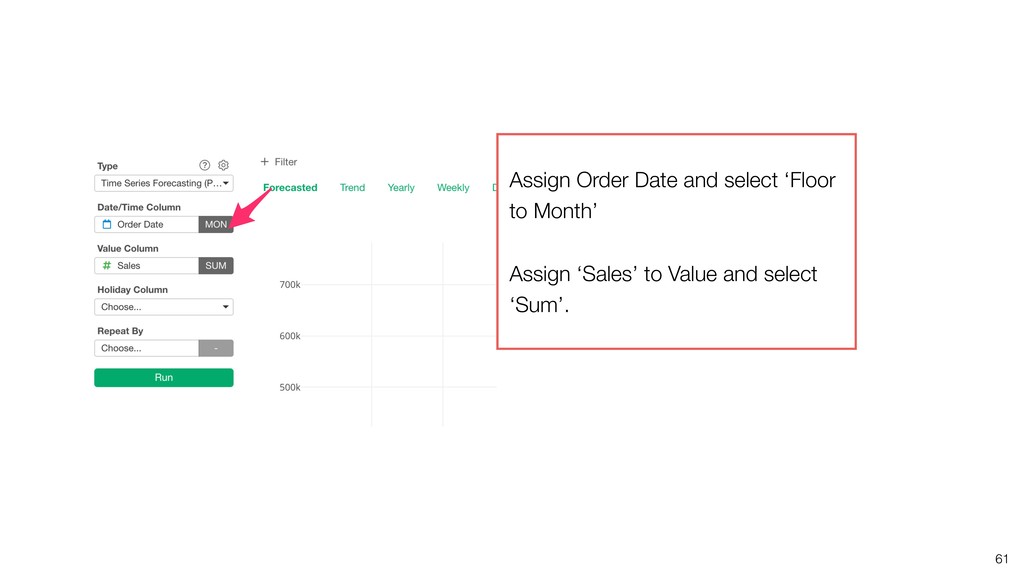
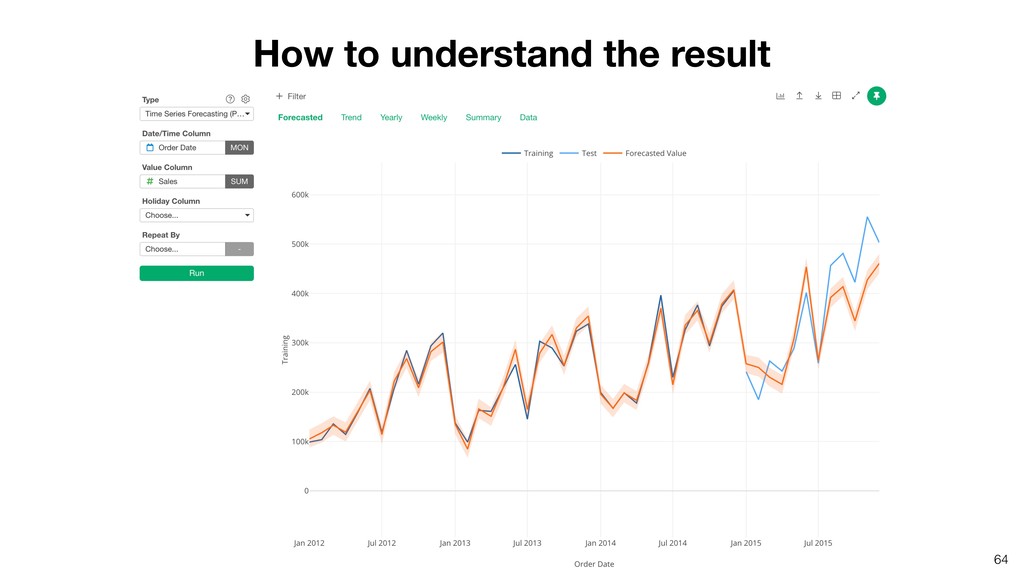
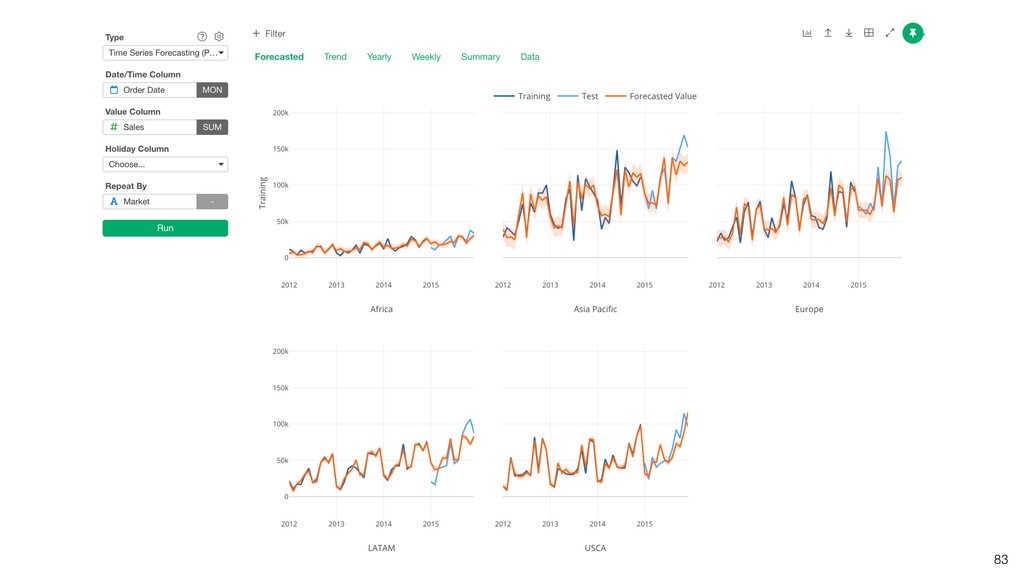
to Day) as the unit of time. • Column, and Sales to Value Column. • Select SUM as the function. By default, forecasting period is 10. In this case, since DAY is the unit, forecast for 10 days will be made. Run Time Series Forecasting on Sales
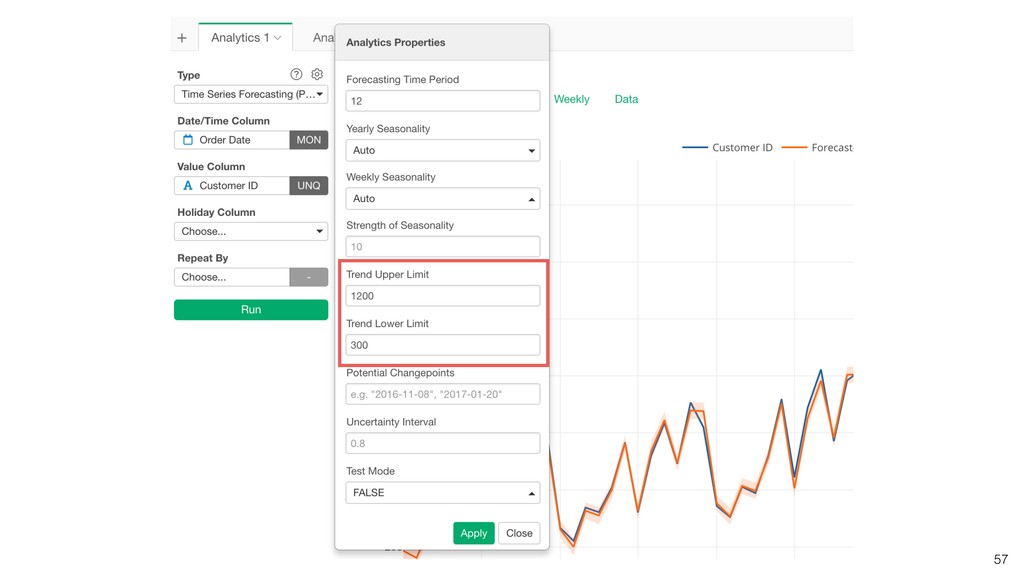
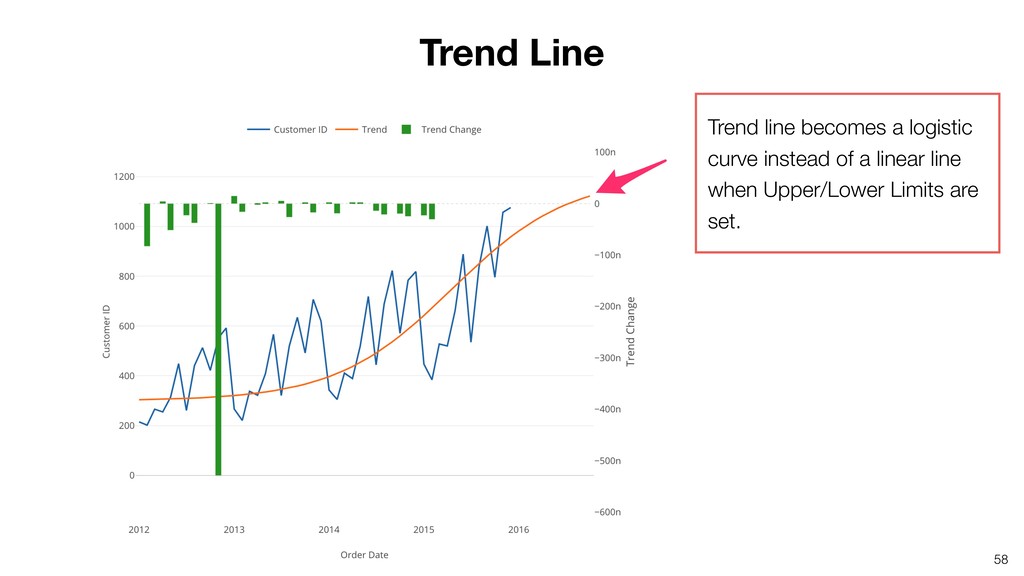
Sales / Demand ForecastingɿWe know it won’t exceed a certain limit. • Conversion RateɿIt never exceed 100%. Prophet can take those limits into account. Capacity
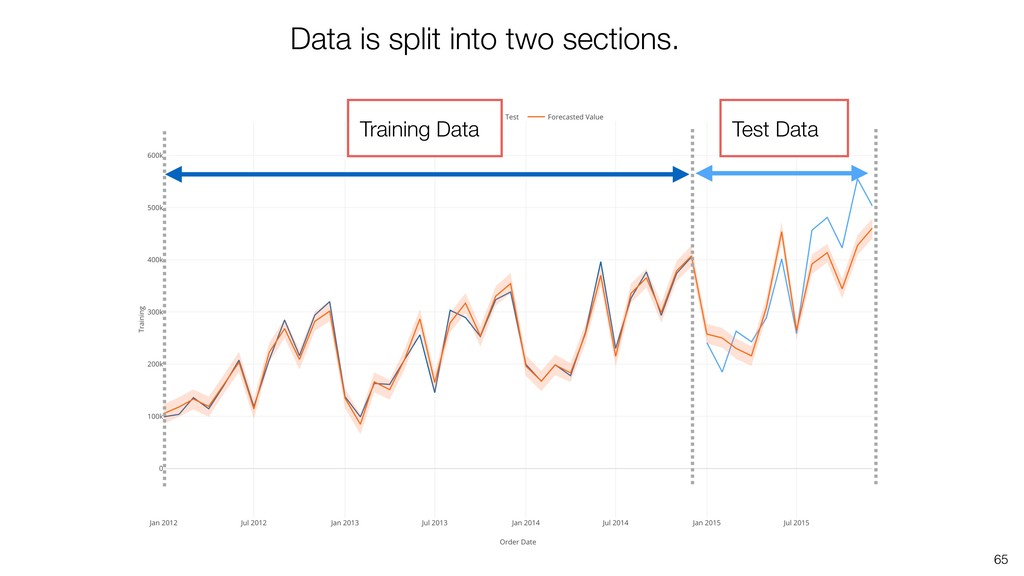
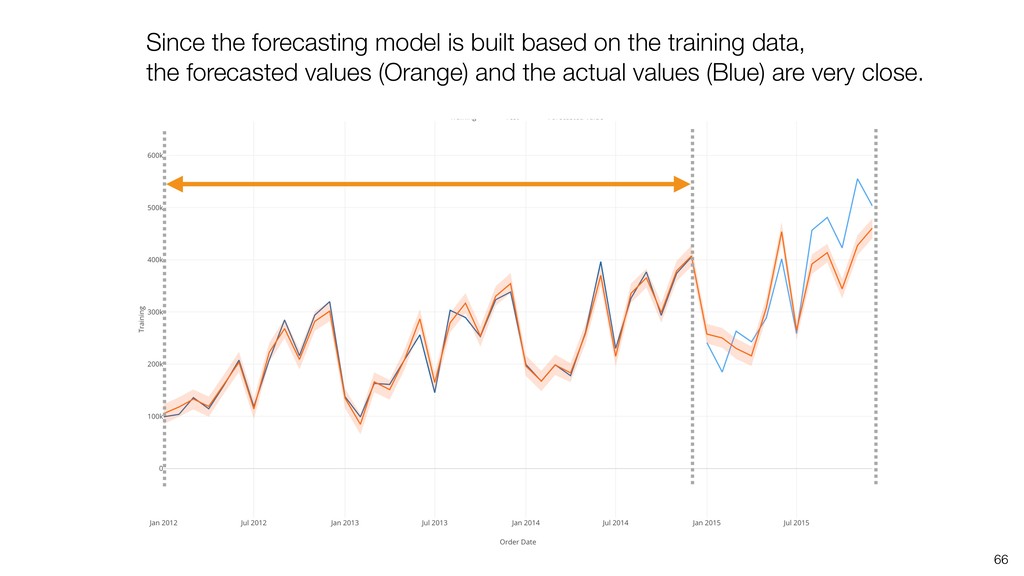
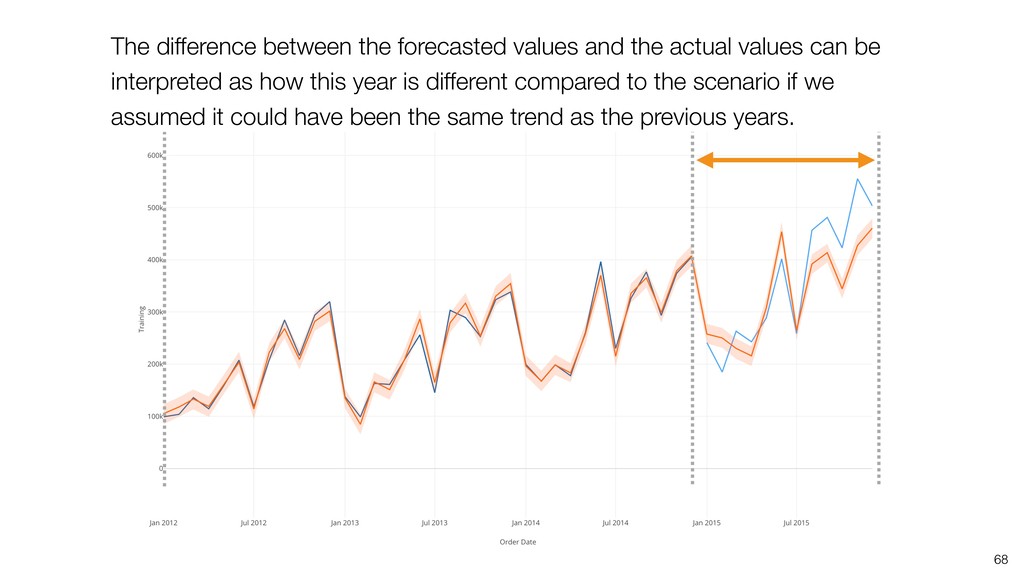
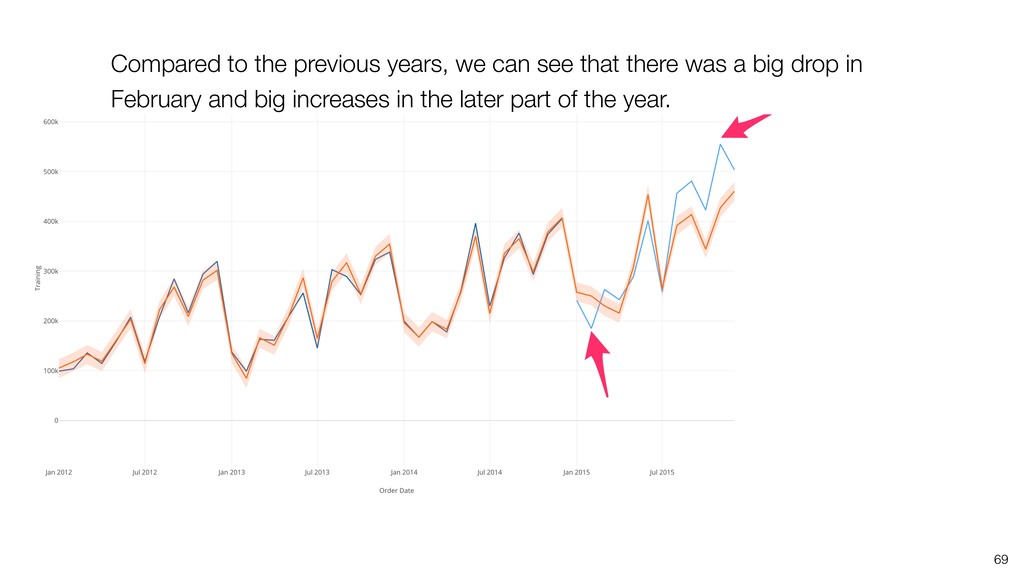
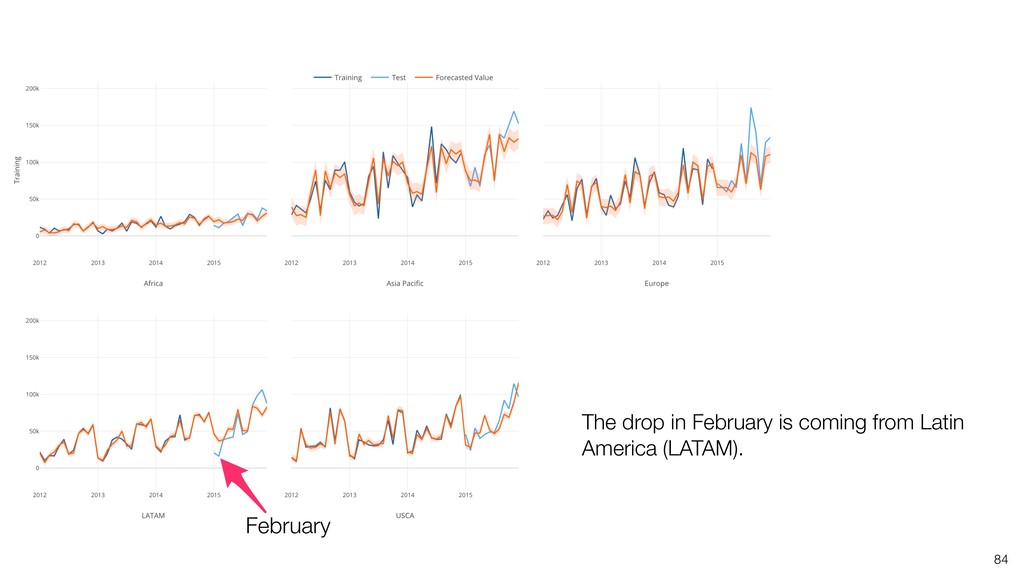
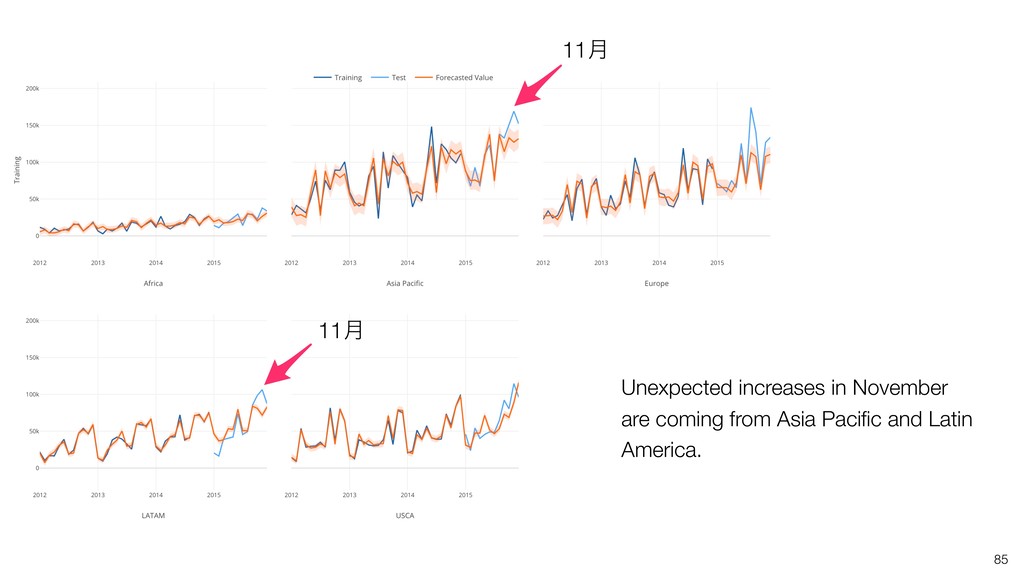
values can be interpreted as how this year is different compared to the scenario if we assumed it could have been the same trend as the previous years.
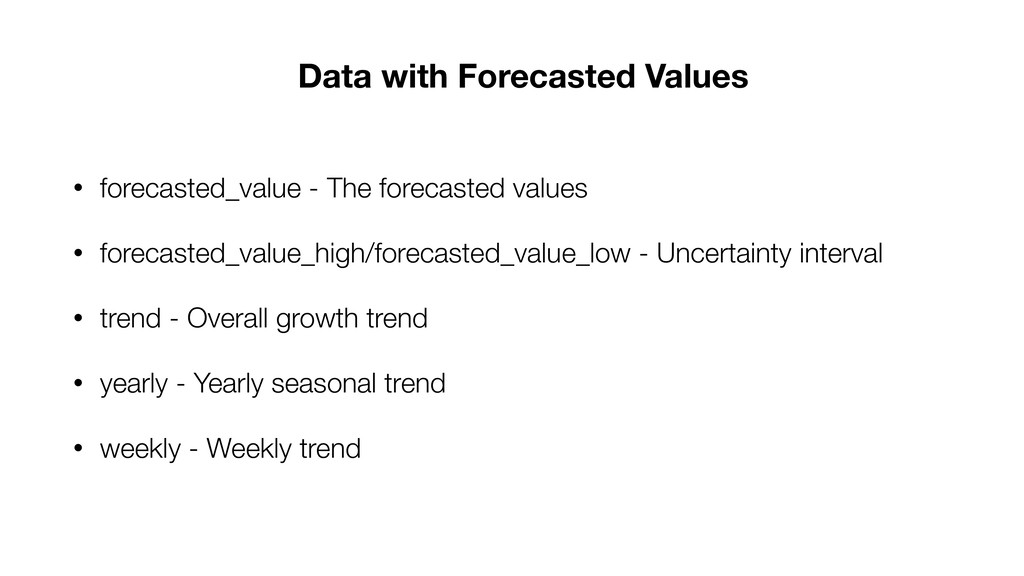
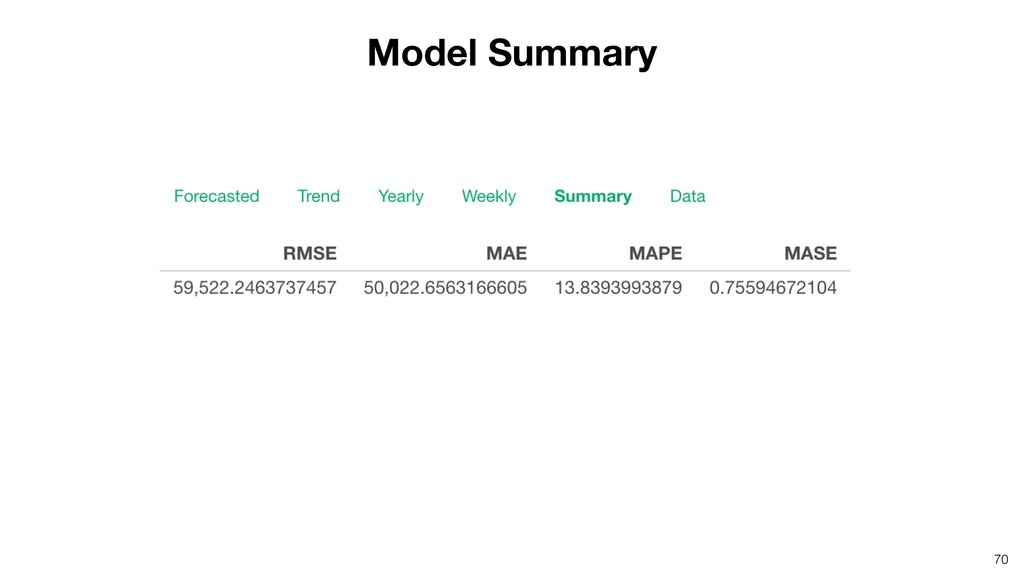
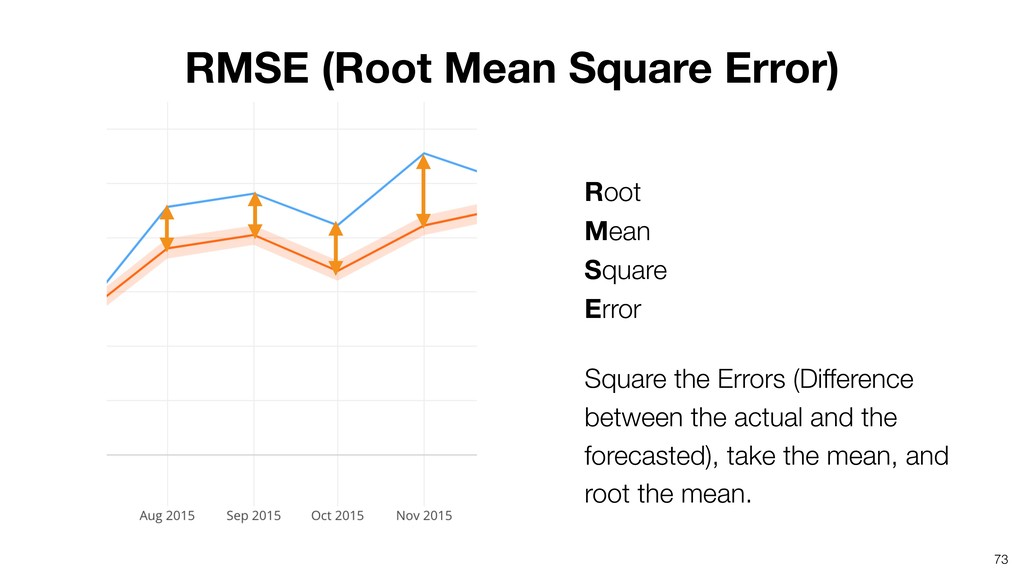
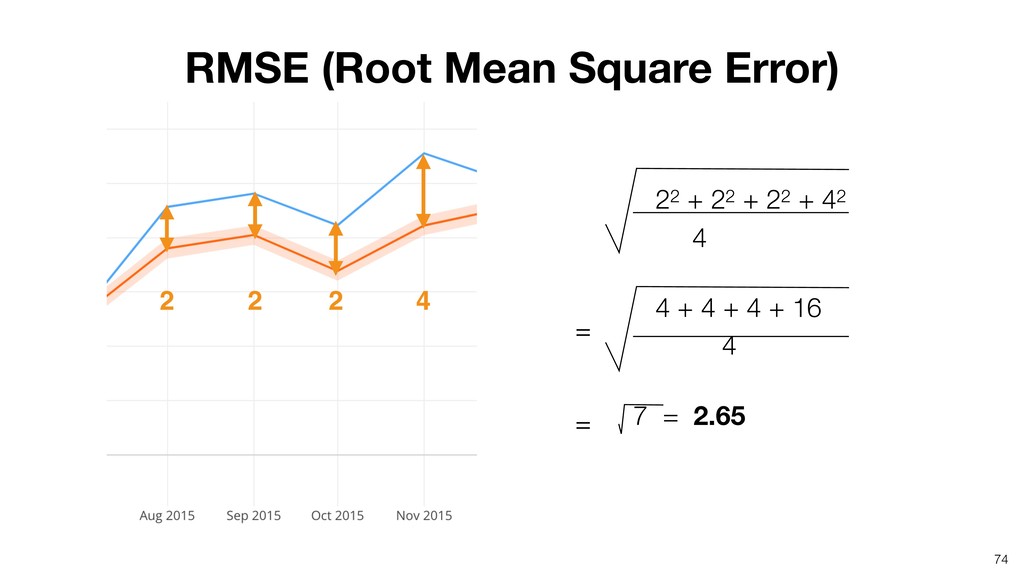
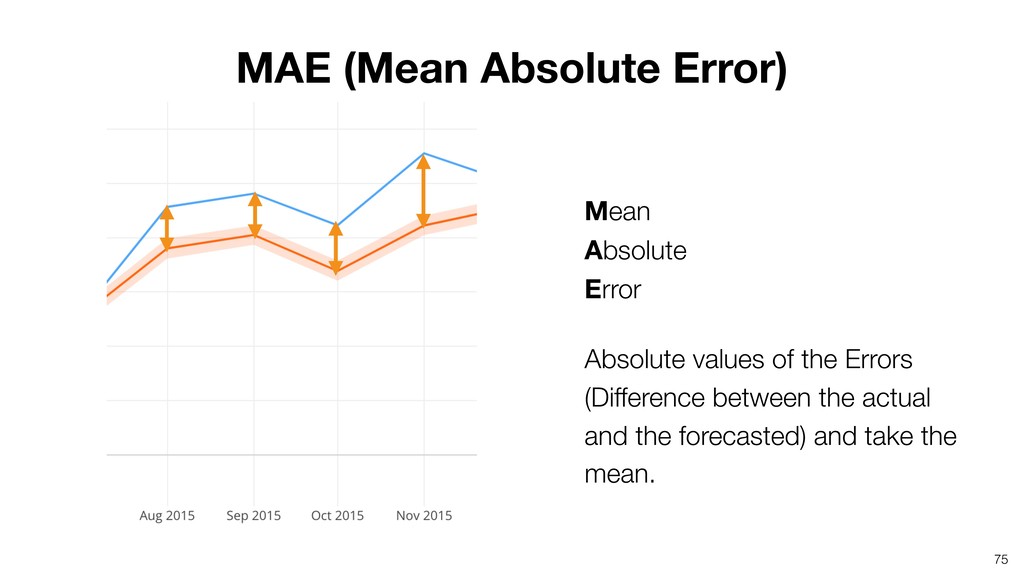
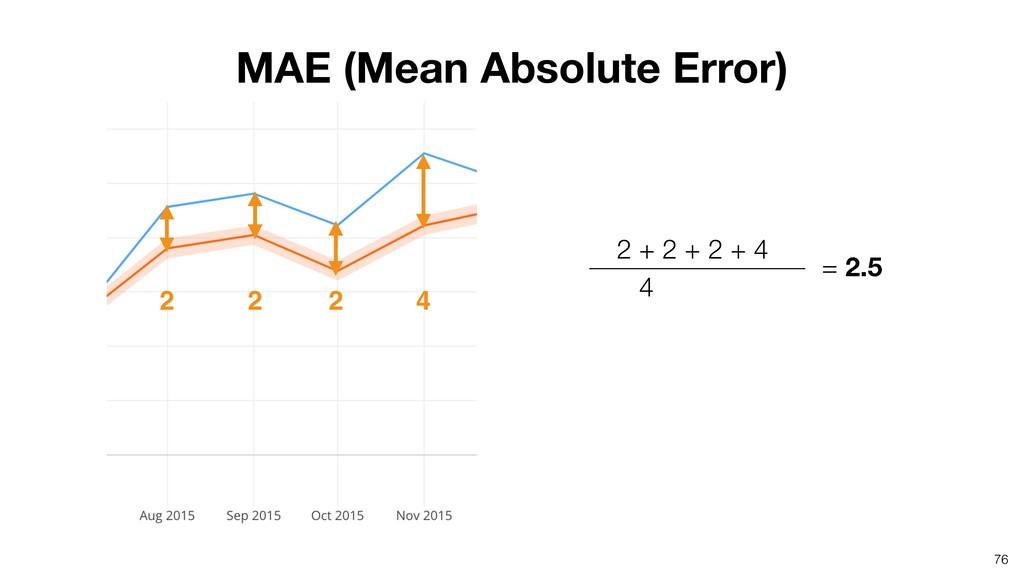
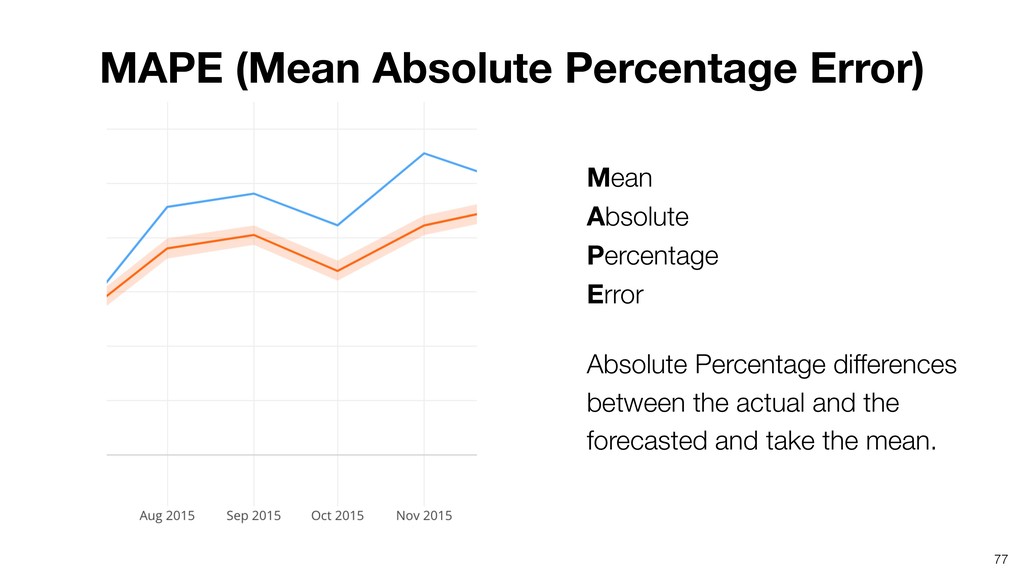
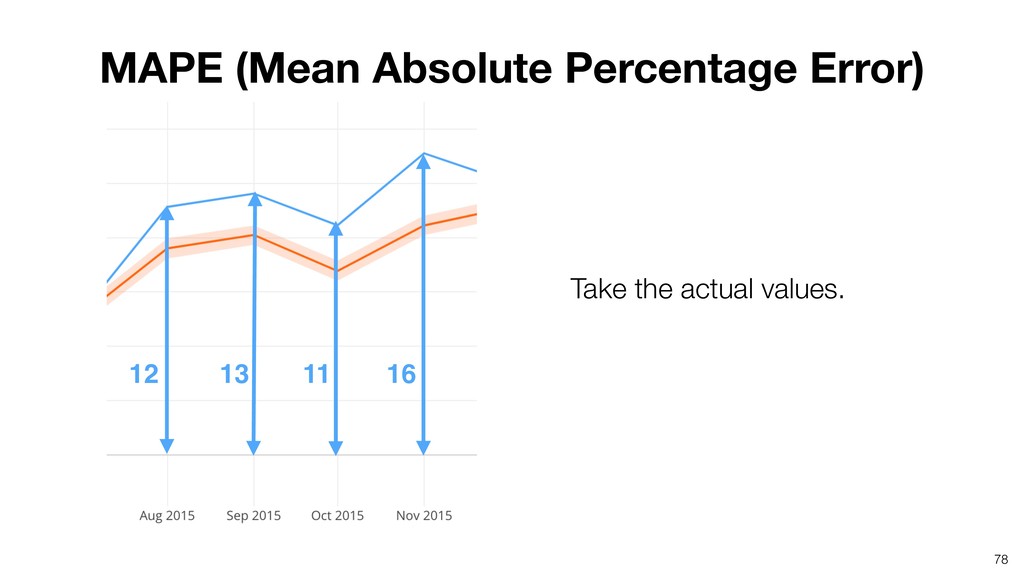
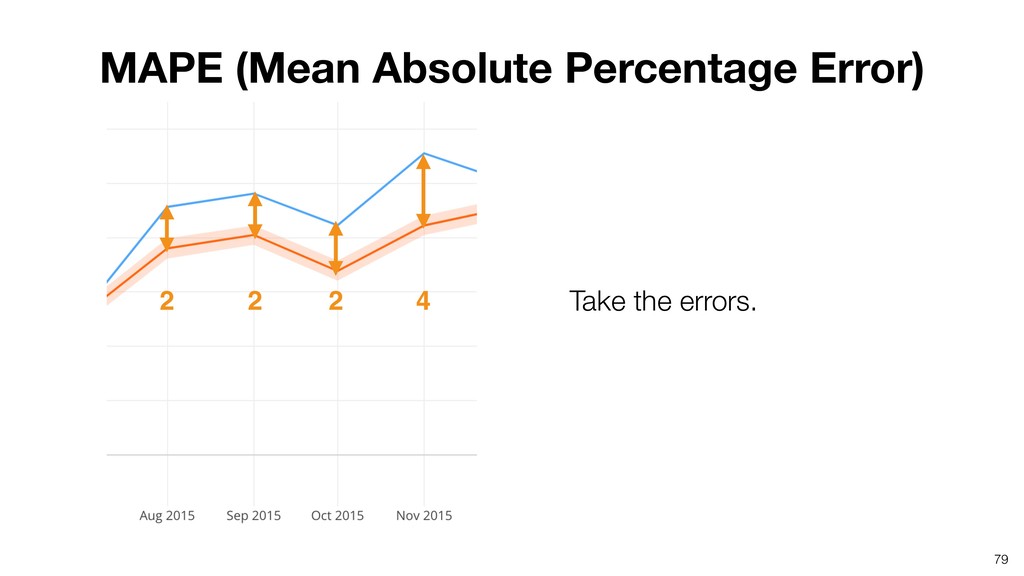
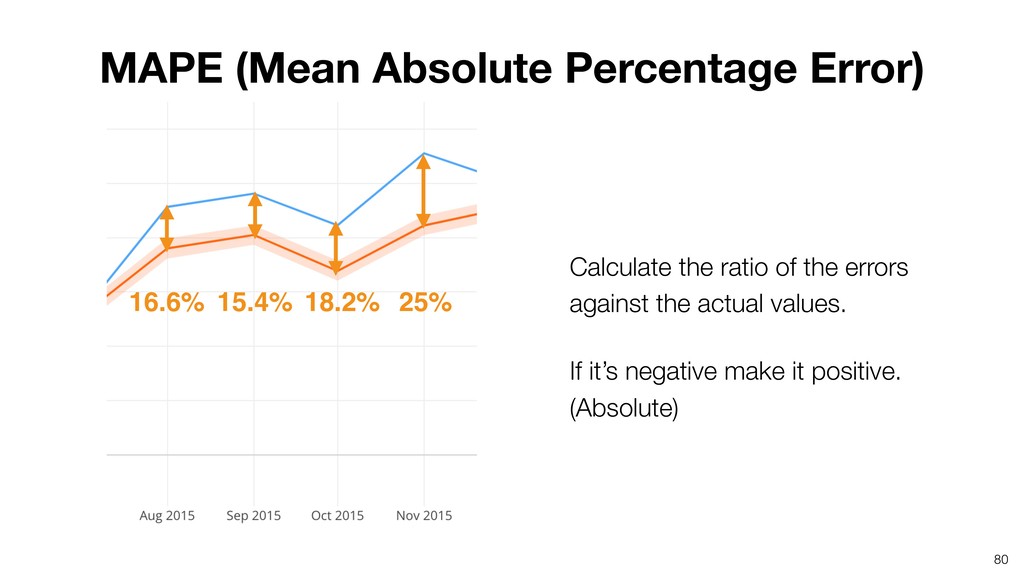
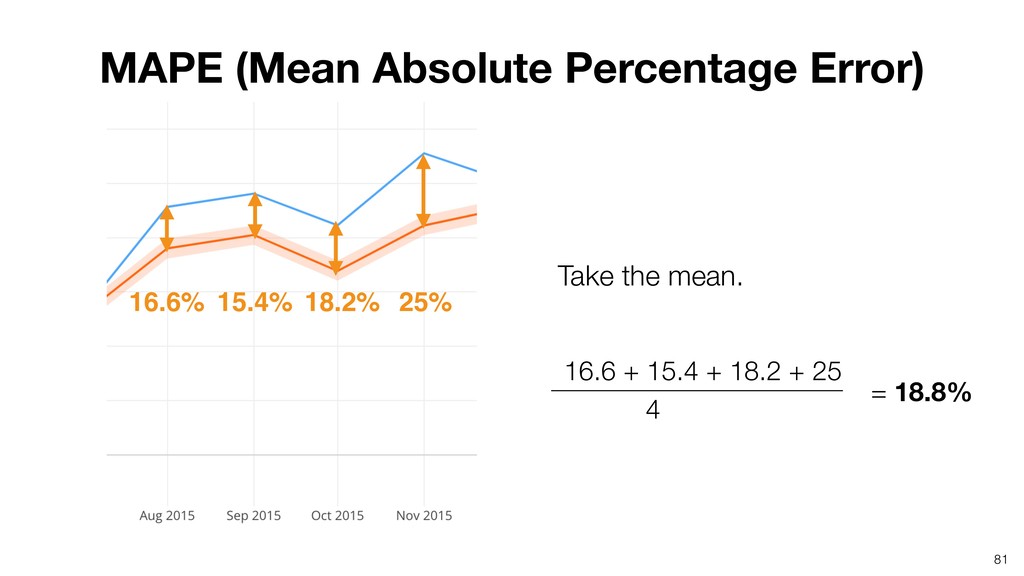
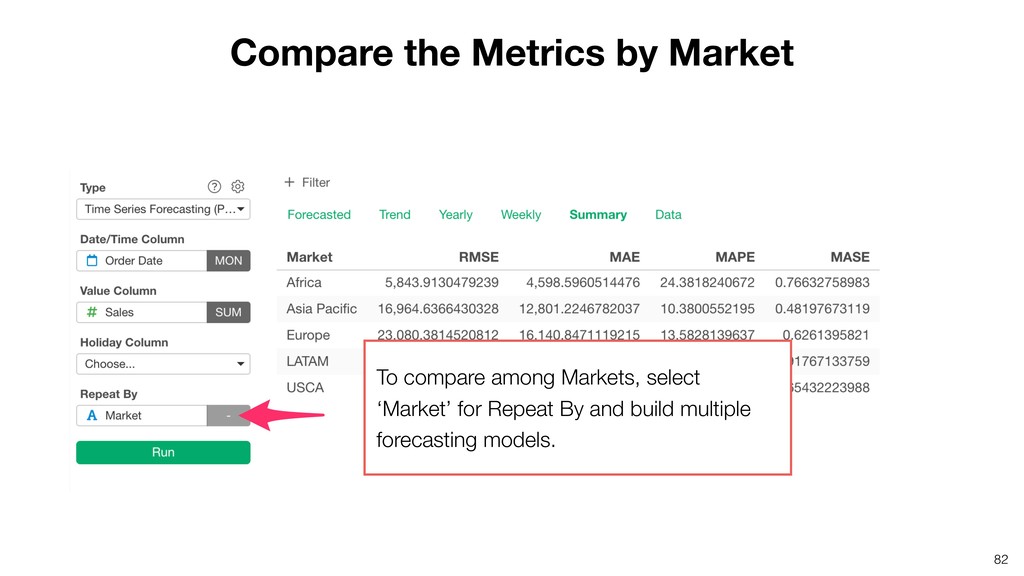
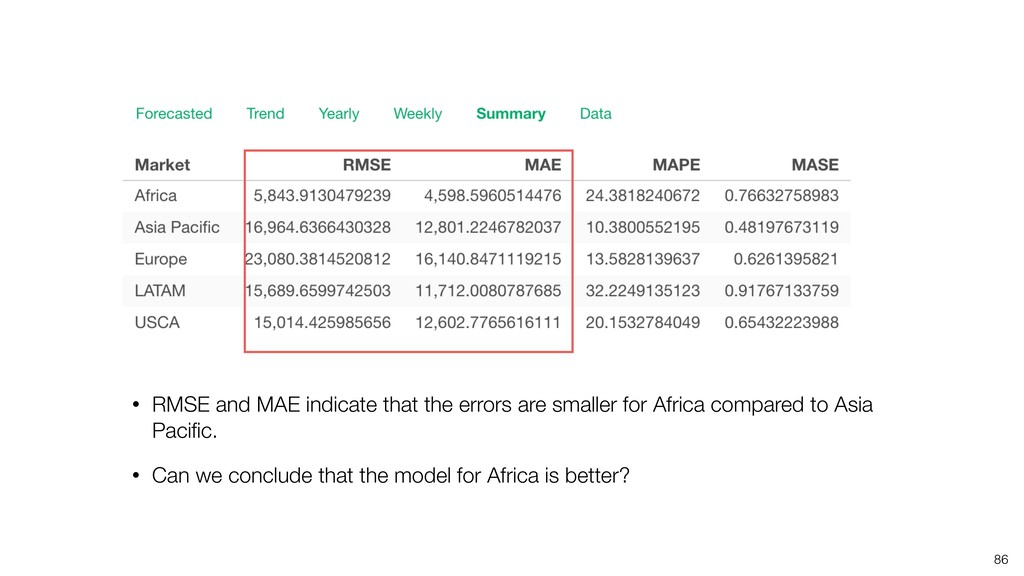
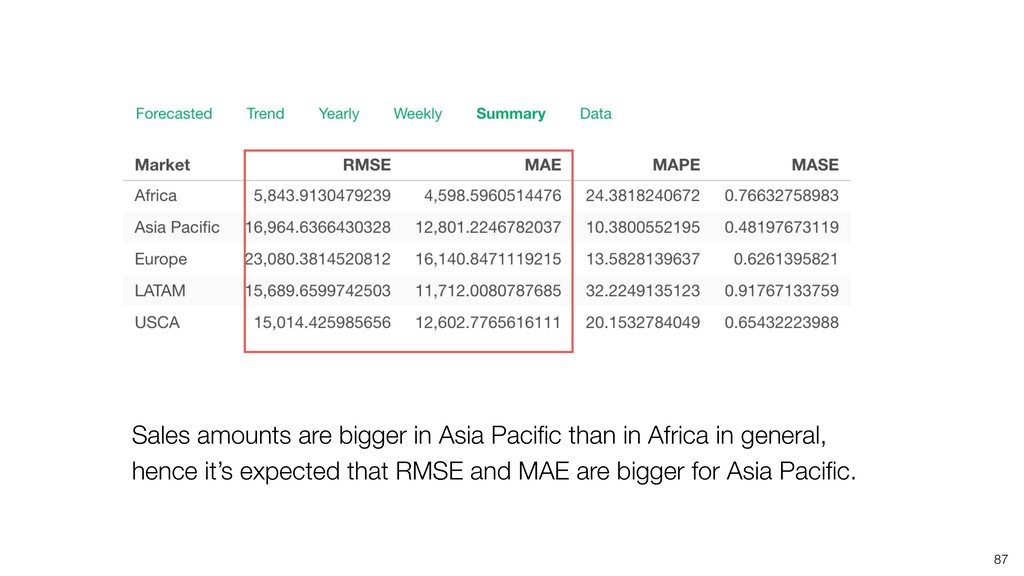
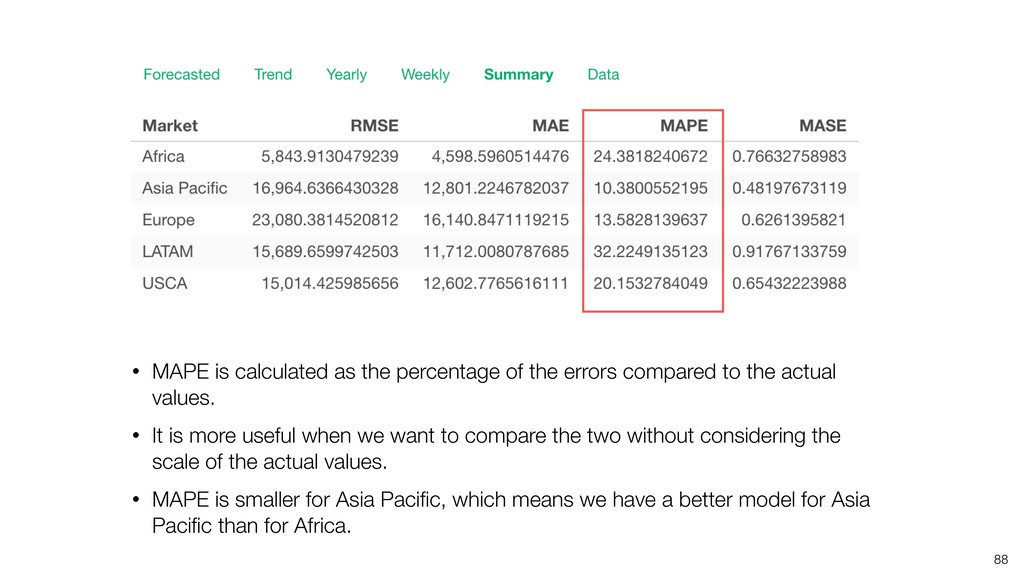
between actual value and forecasted value. • RMSE (Root Mean Square Error) : Root of mean of squares of difference between actual value and forecasted value. • MAPE (Mean Absolute Percentage Error) : Mean of absolute differences in percentage of actual value. • MASE (Mean Absolute Scaled Error) : Divide MAE of the forecasting model by MAE of a naive forecasting model (a simple model that always forecasts one previous value). Metrics to Evaluate Time Series Forecast
compared to the actual values. • It is more useful when we want to compare the two without considering the scale of the actual values. • MAPE is smaller for Asia Pacific, which means we have a better model for Asia Pacific than for Africa. 88