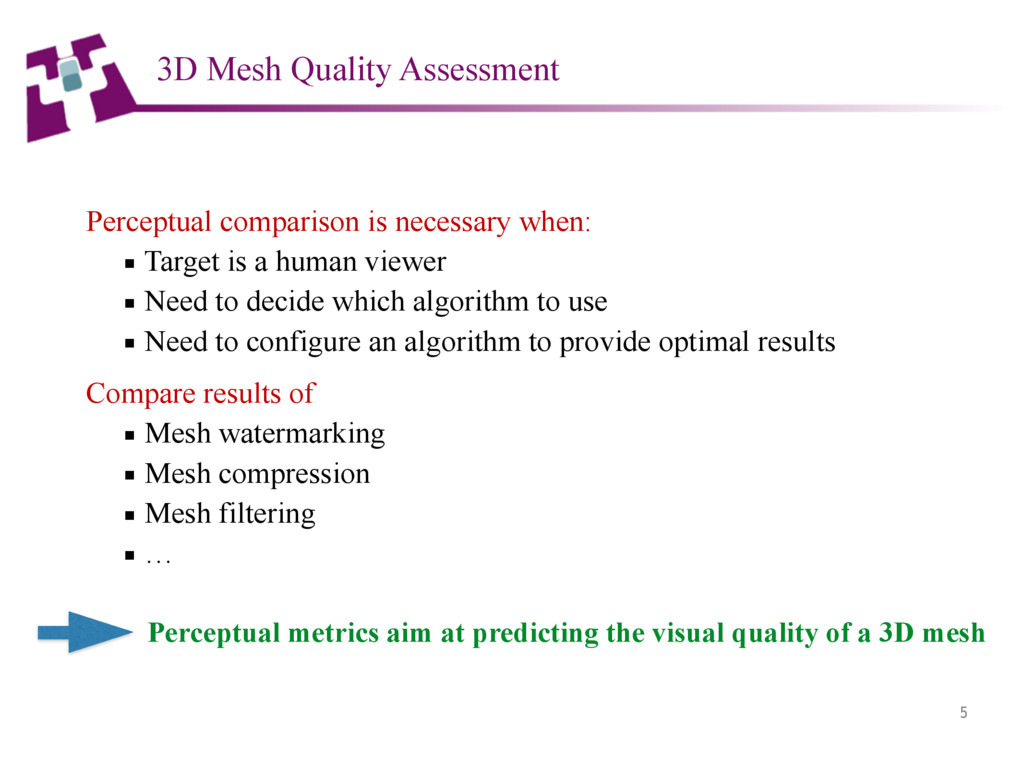
comparison is necessary when: ▪ Target is a human viewer ▪ Need to decide which algorithm to use ▪ Need to configure an algorithm to provide optimal results Compare results of ▪ Mesh watermarking ▪ Mesh compression ▪ Mesh filtering ▪ … 3D Mesh Quality Assessment Perceptual metrics aim at predicting the visual quality of a 3D mesh
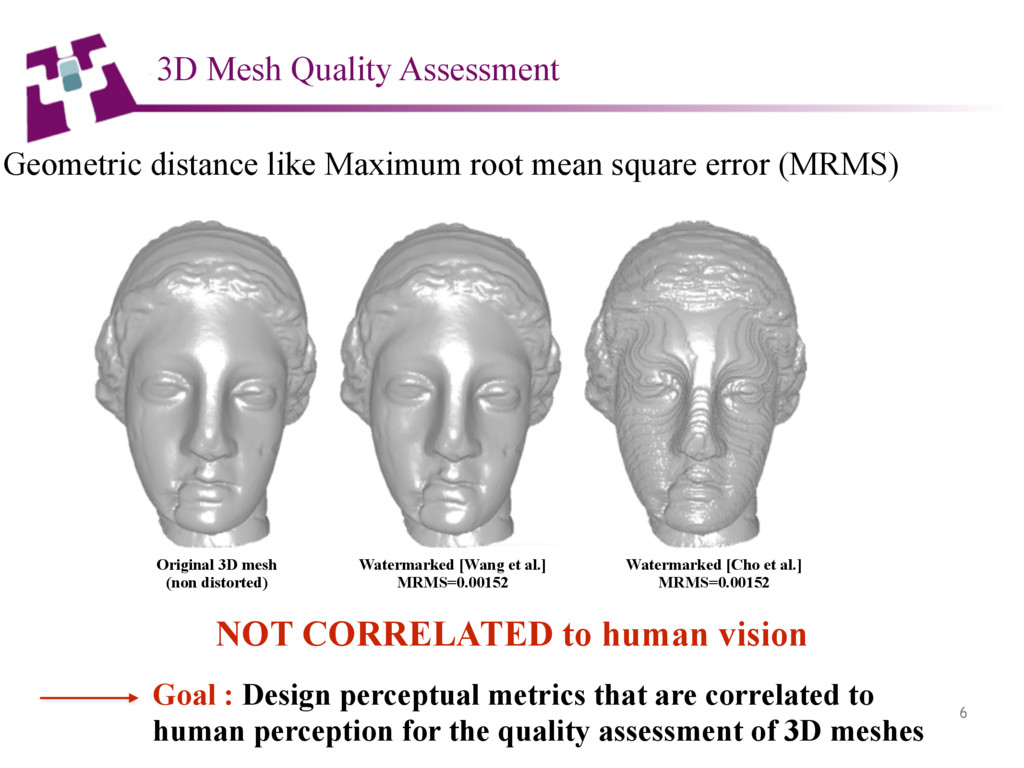
distance like Maximum root mean square error (MRMS) Original 3D mesh (non distorted) Watermarked [Wang et al.] MRMS=0.00152 Watermarked [Cho et al.] MRMS=0.00152 NOT CORRELATED to human vision Goal : Design perceptual metrics that are correlated to human perception for the quality assessment of 3D meshes 3D Mesh Quality Assessment
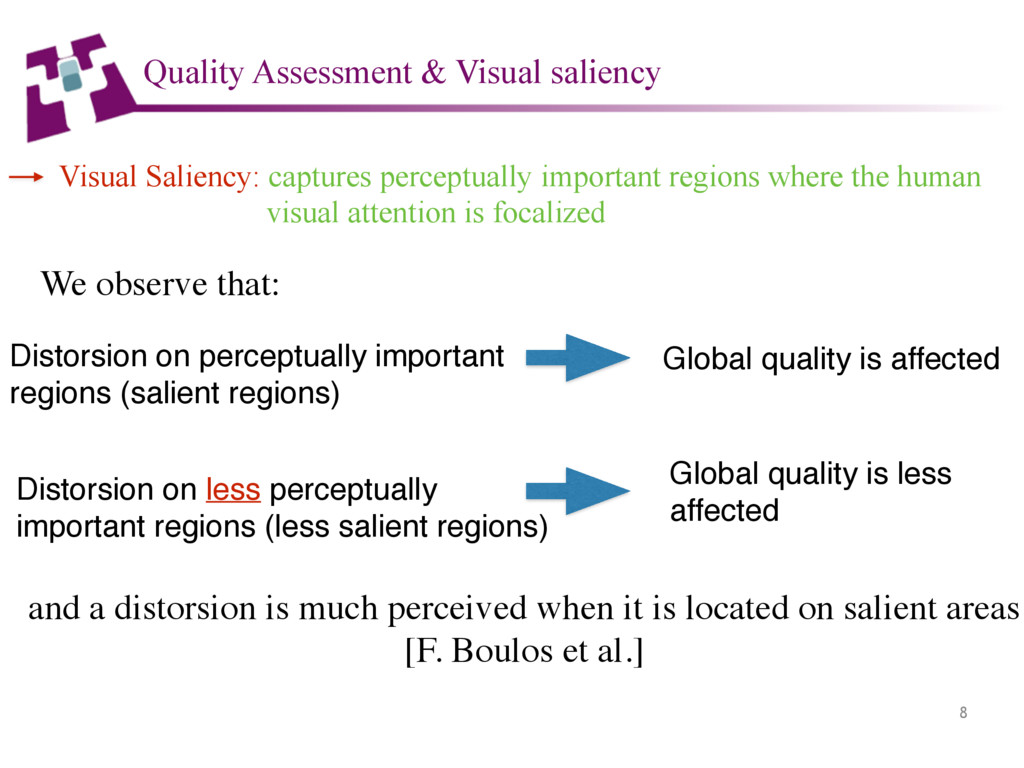
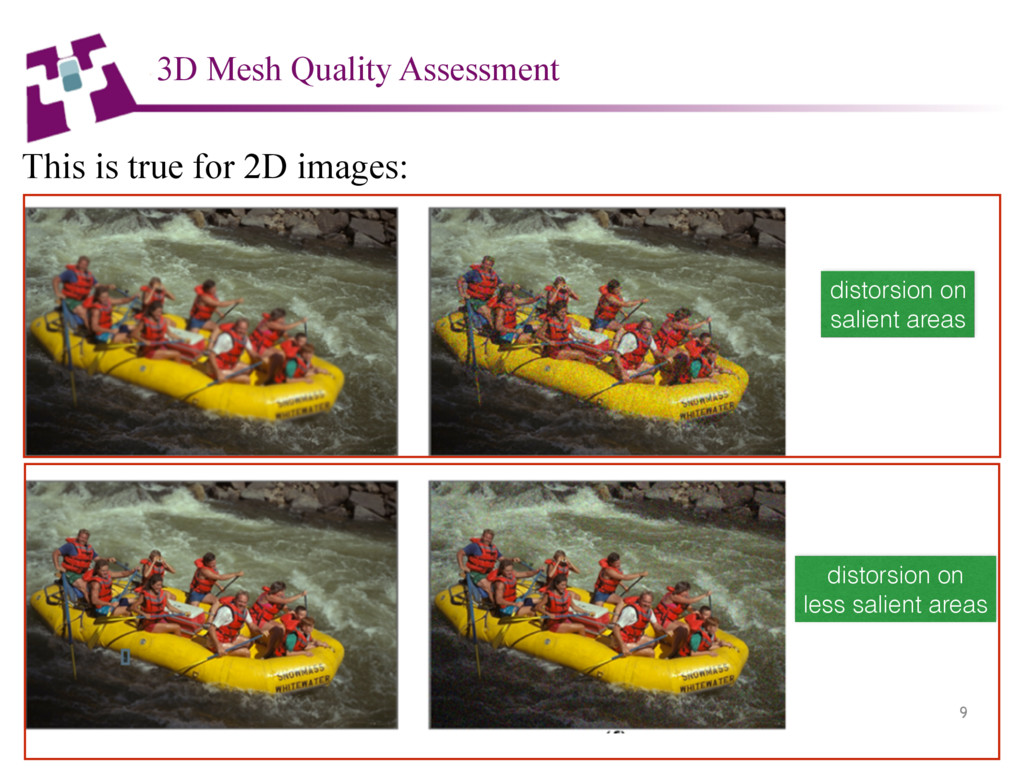
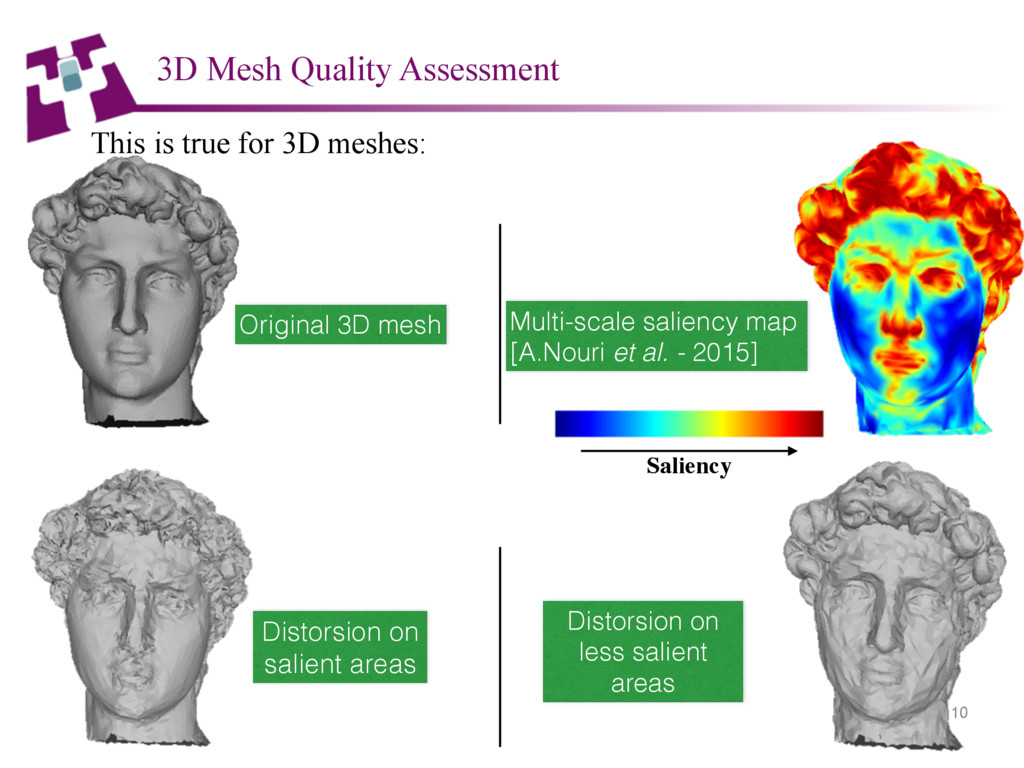
Saliency: captures perceptually important regions where the human visual attention is focalized Distorsion on perceptually important regions (salient regions) Global quality is affected Distorsion on less perceptually important regions (less salient regions) Global quality is less affected Quality Assessment & Visual saliency We observe that: and a distorsion is much perceived when it is located on salient areas [F. Boulos et al.]
is true for 3D meshes: Distorsion on salient areas Distorsion on less salient areas 3D Mesh Quality Assessment Original 3D mesh Multi-scale saliency map [A.Nouri et al. - 2015] Saliency
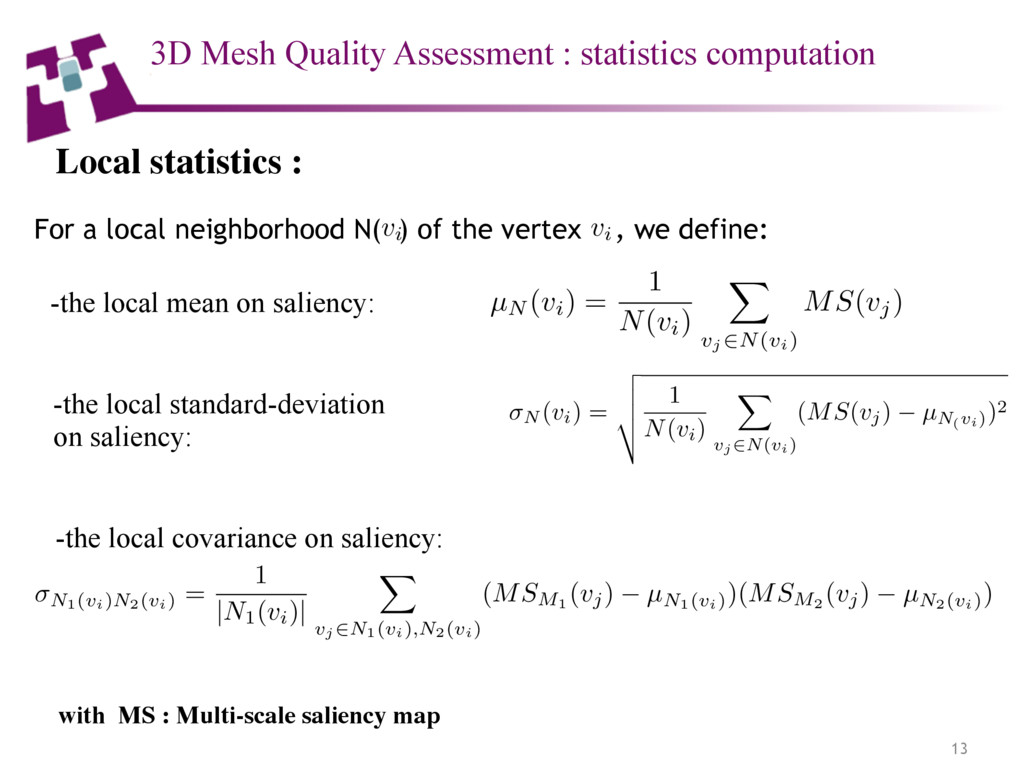
local neighborhood N( ) of the vertex , we define: 13 vi -the local mean on saliency: µN (vi) = 1 N(vi) X vj 2N(vi) MS(vj) -the local standard-deviation on saliency: N (vi) = v u u t 1 N(vi) X vj 2N(vi) (MS(vj) µN( vi) )2 -the local covariance on saliency: N1(vi)N2(vi) = 1 |N1(vi)| X vj 2N1(vi),N2(vi) (MSM1 (vj) µN1(vi) )(MSM2 (vj) µN2(vi) ) vi 3D Mesh Quality Assessment : statistics computation with MS : Multi-scale saliency map Local statistics :
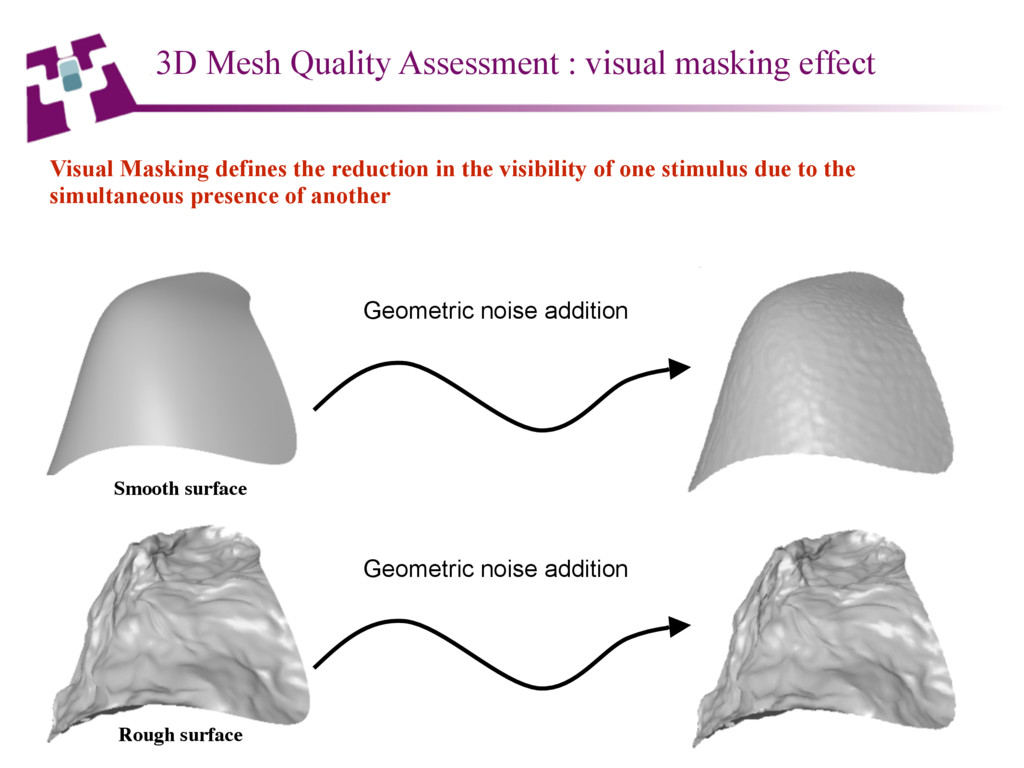
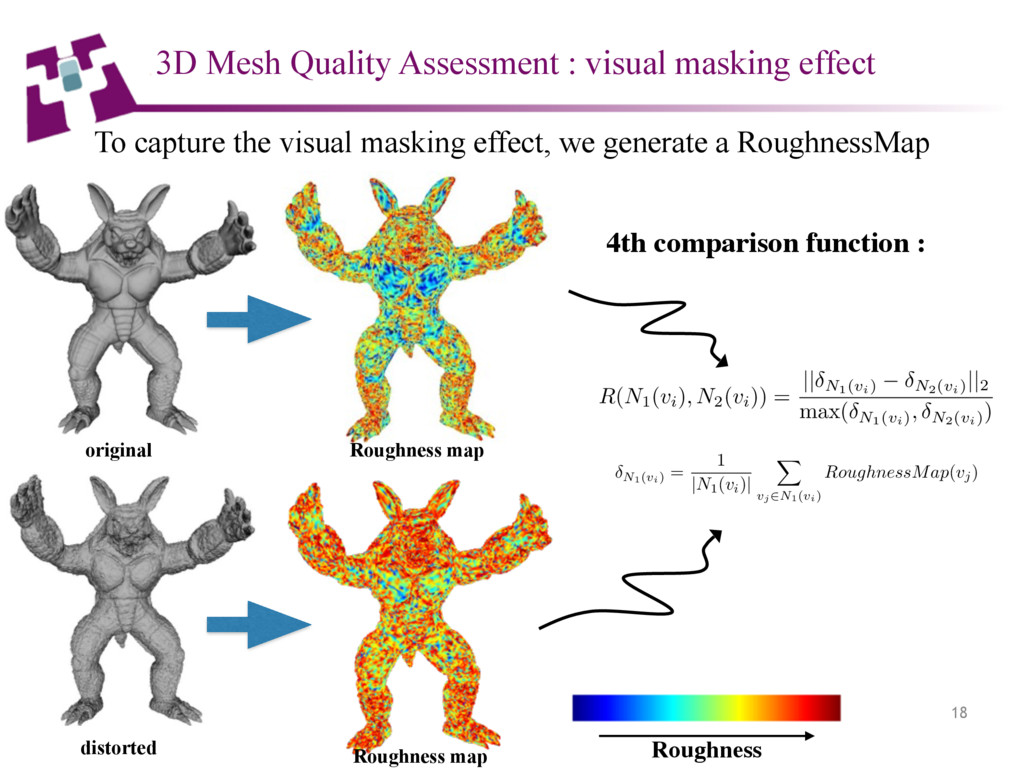
Masking defines the reduction in the visibility of one stimulus due to the simultaneous presence of another Geometric noise addition Geometric noise addition 3D Mesh Quality Assessment : visual masking effect Smooth surface Rough surface
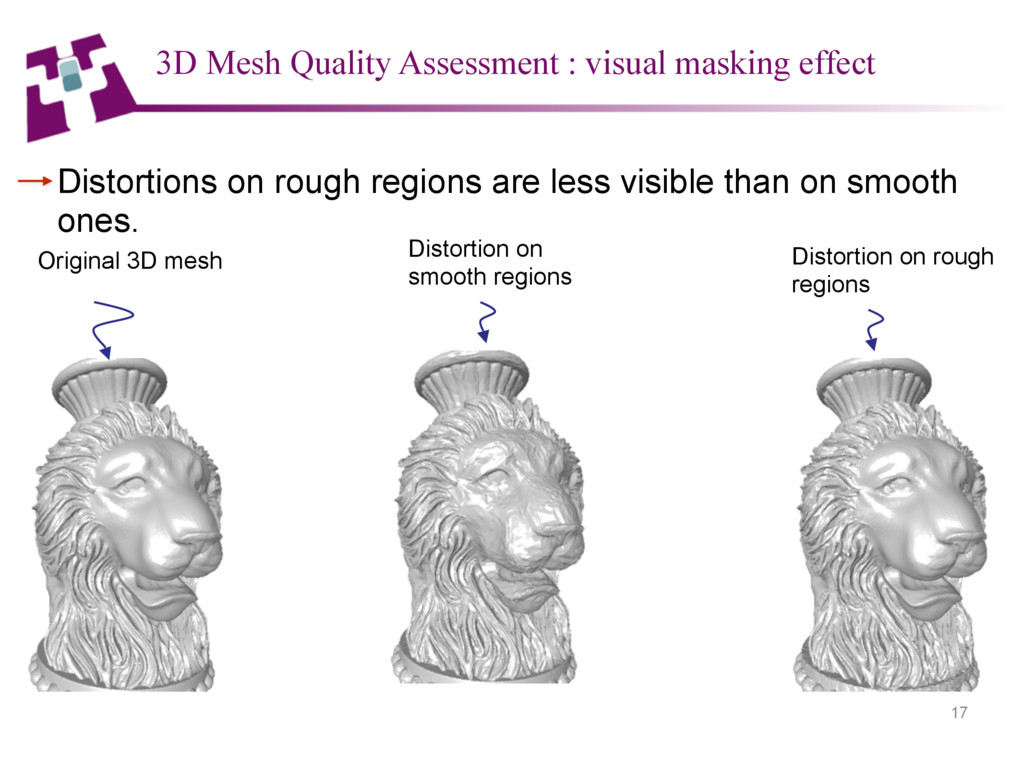
on rough regions are less visible than on smooth ones. Distortion on smooth regions Distortion on rough regions Original 3D mesh 3D Mesh Quality Assessment : visual masking effect
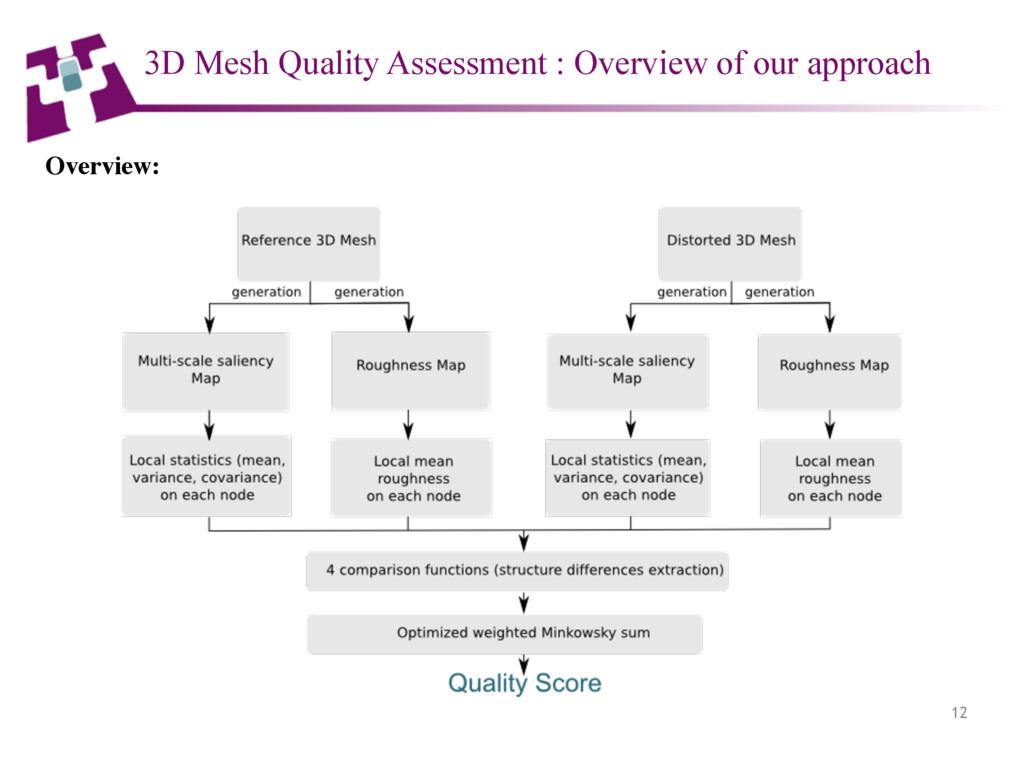
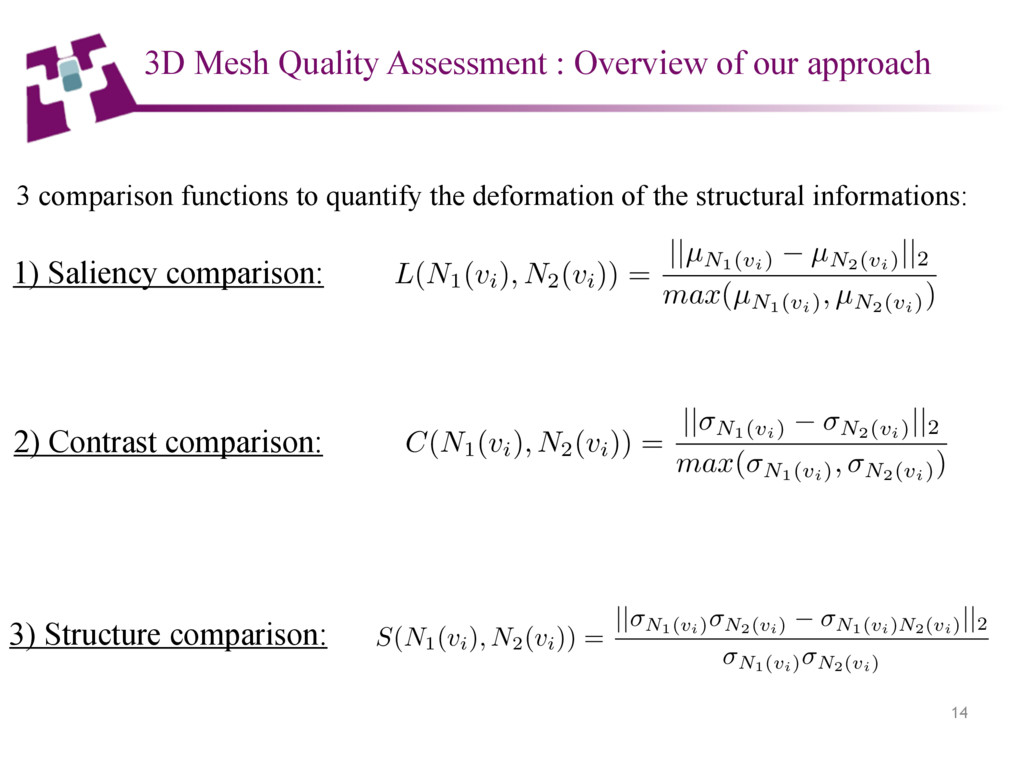
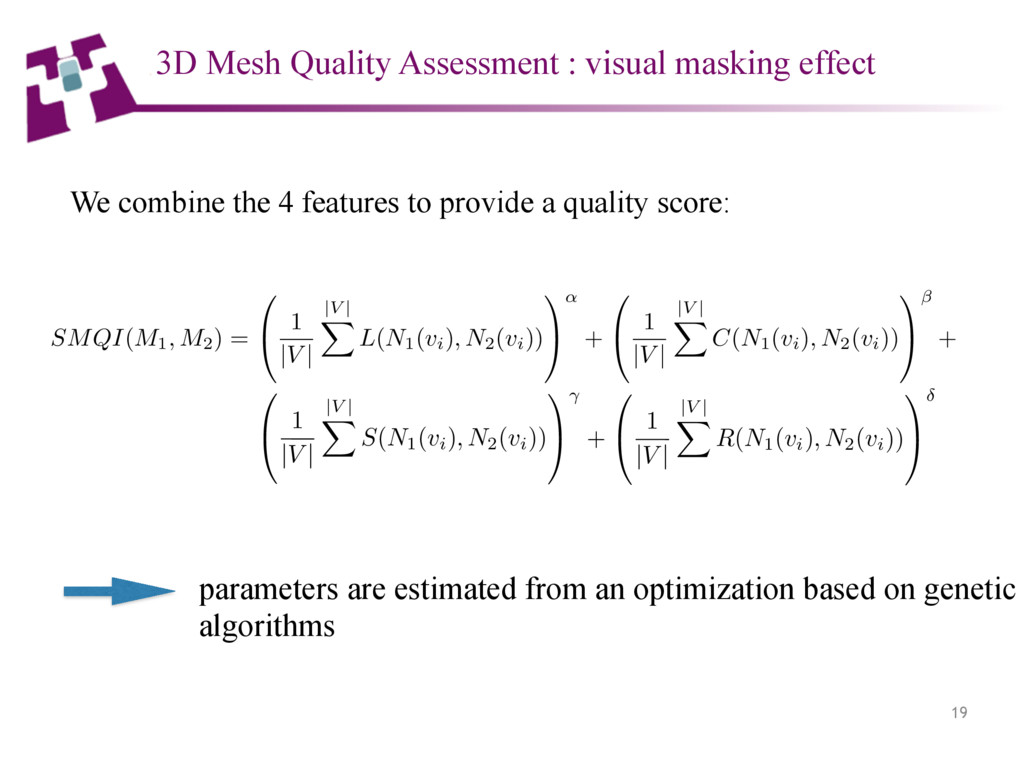
combine the 4 features to provide a quality score: SMQI(M1, M2) = 0 @ 1 |V | |V | X L(N1(vi), N2(vi)) 1 A ↵ + 0 @ 1 |V | |V | X C(N1(vi), N2(vi)) 1 A + 0 @ 1 |V | |V | X S(N1(vi), N2(vi)) 1 A + 0 @ 1 |V | |V | X R(N1(vi), N2(vi)) 1 A parameters are estimated from an optimization based on genetic algorithms 3D Mesh Quality Assessment : visual masking effect
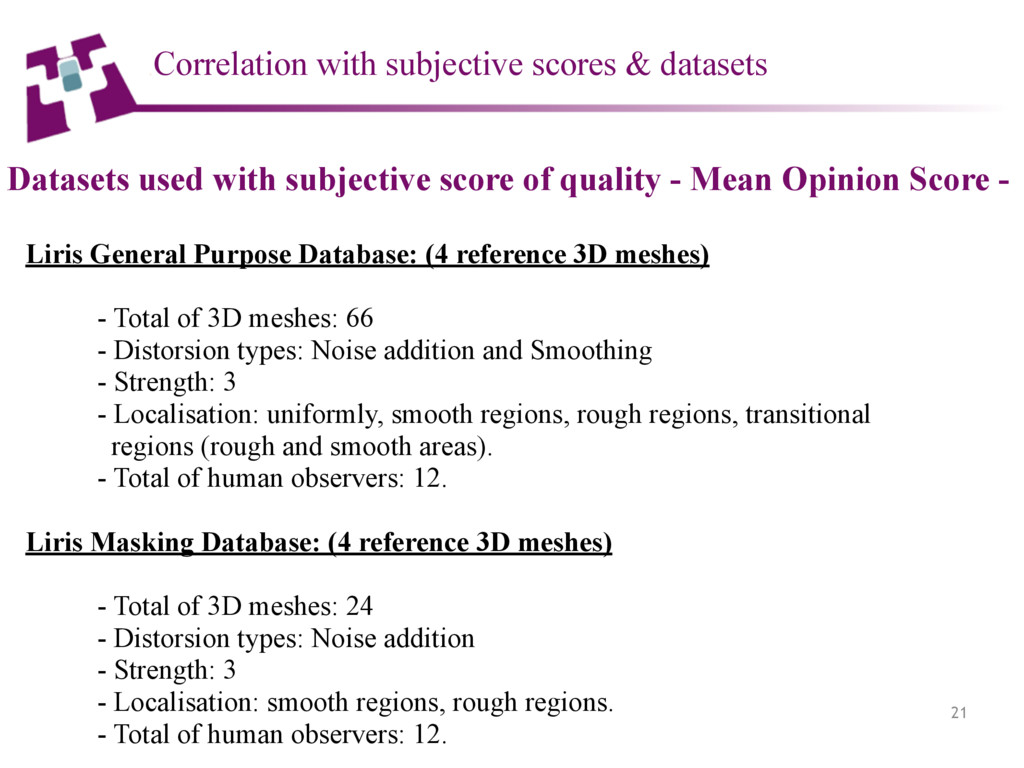
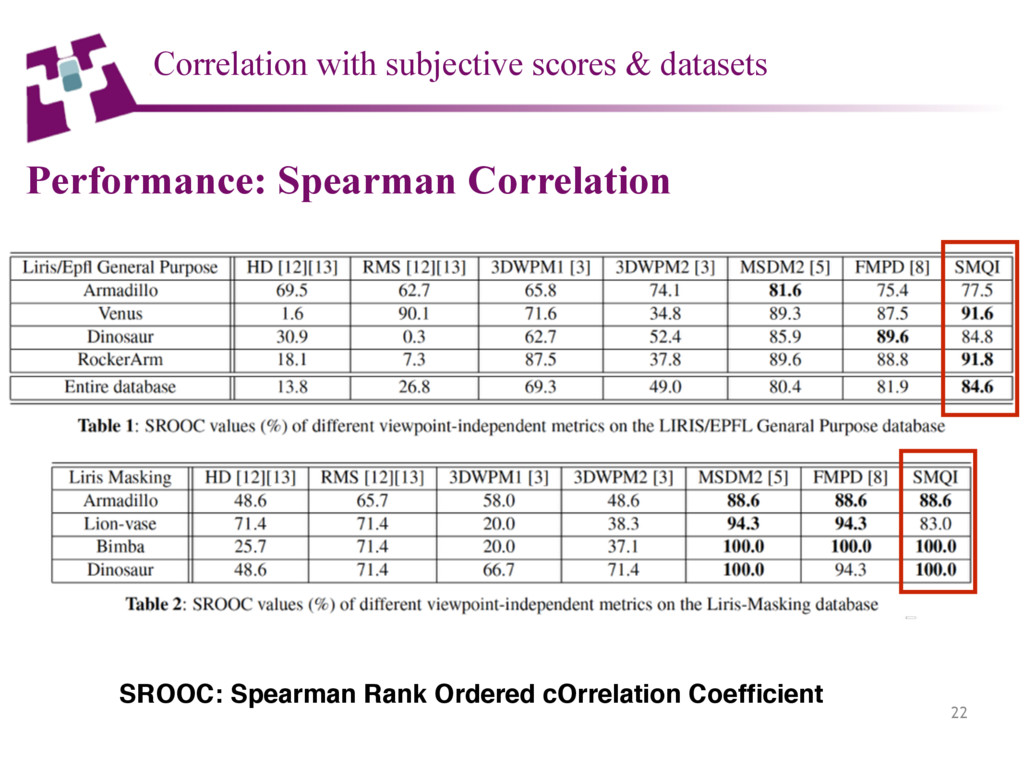
with subjective scores & datasets Datasets used with subjective score of quality - Mean Opinion Score - Liris General Purpose Database: (4 reference 3D meshes) - Total of 3D meshes: 66 - Distorsion types: Noise addition and Smoothing - Strength: 3 - Localisation: uniformly, smooth regions, rough regions, transitional regions (rough and smooth areas). - Total of human observers: 12. Liris Masking Database: (4 reference 3D meshes) - Total of 3D meshes: 24 - Distorsion types: Noise addition - Strength: 3 - Localisation: smooth regions, rough regions. - Total of human observers: 12.
• Extension to the quality assessment of 3D meshes of different connectivities. • Amelioration of the multi-scale saliency map to better reflect the distortions affecting the considered 3D mesh. • Design of subject-rated database accounting for distorsions targeting visual salient regions and non salient ones. (We have observed that state-of-the-art’s metrics scores these kinds of distorsions in an incoherent manner).