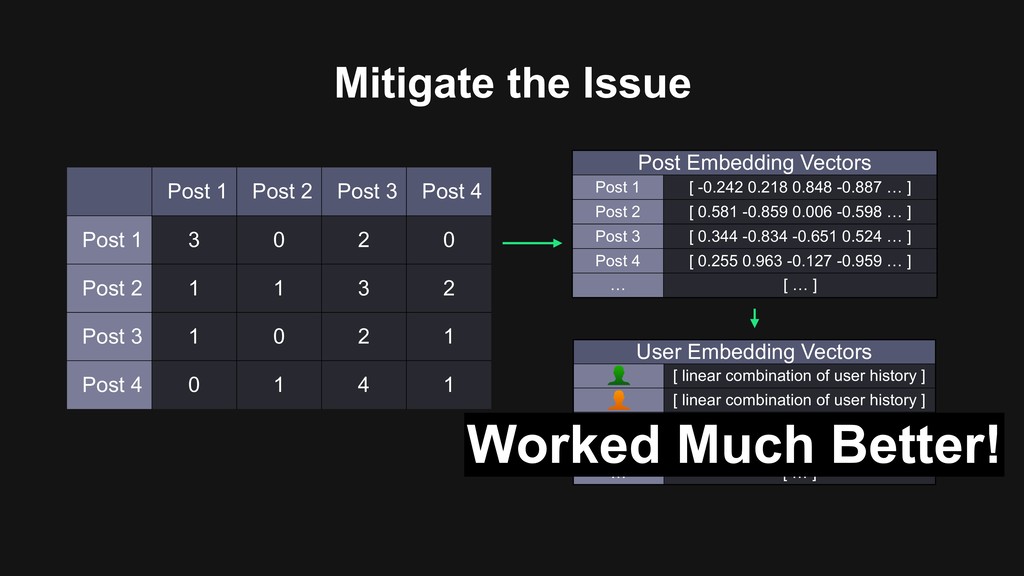
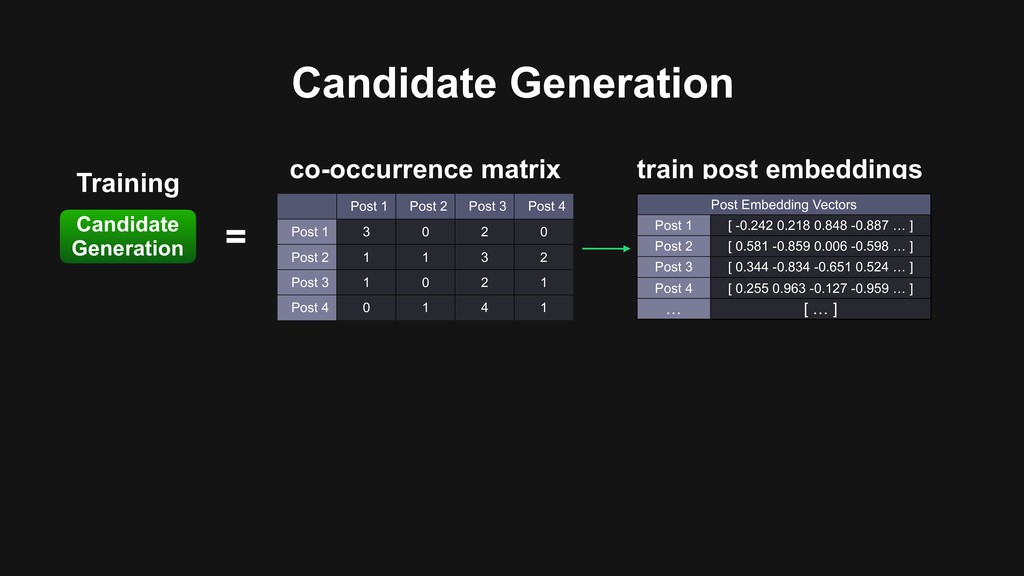
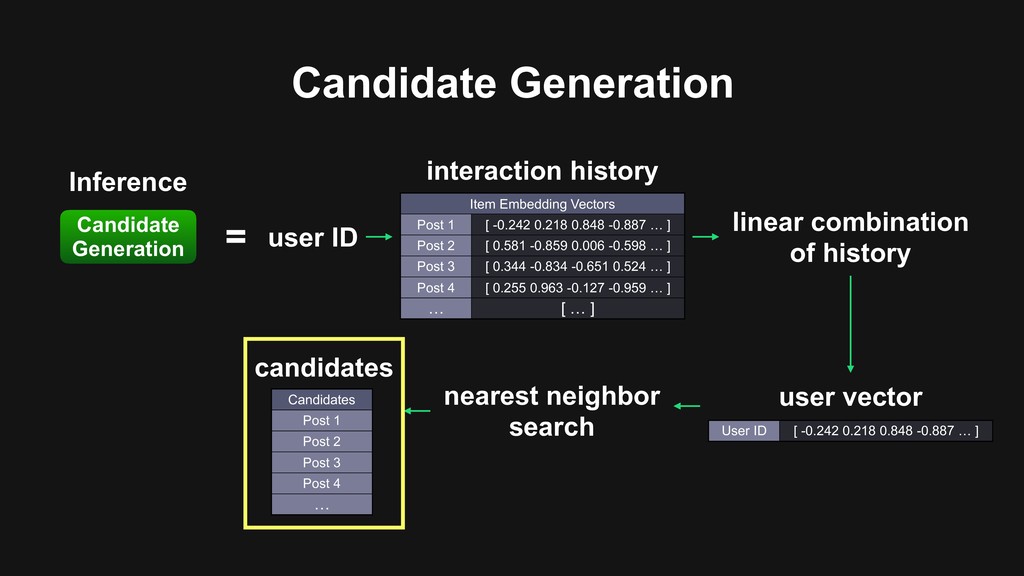
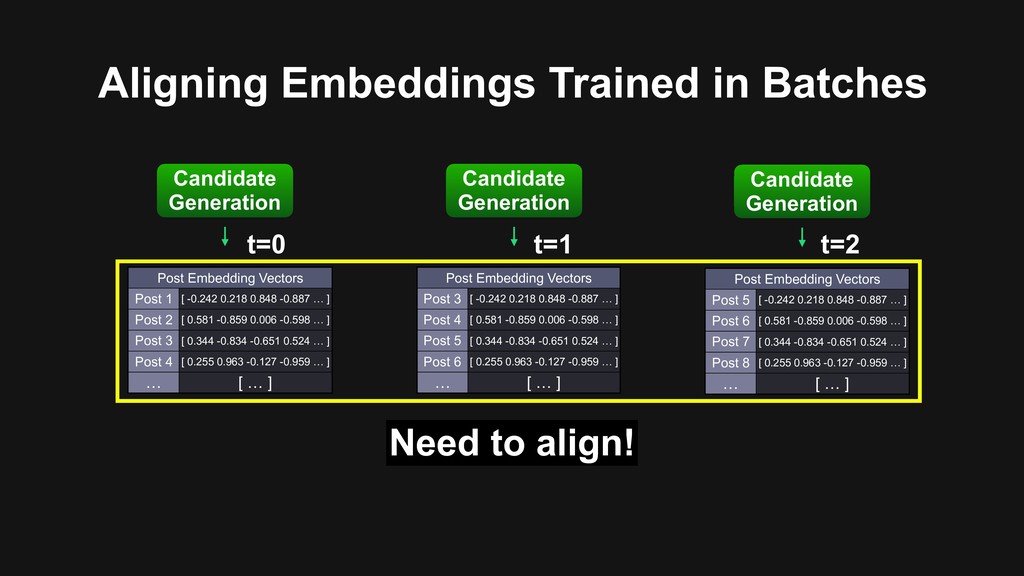
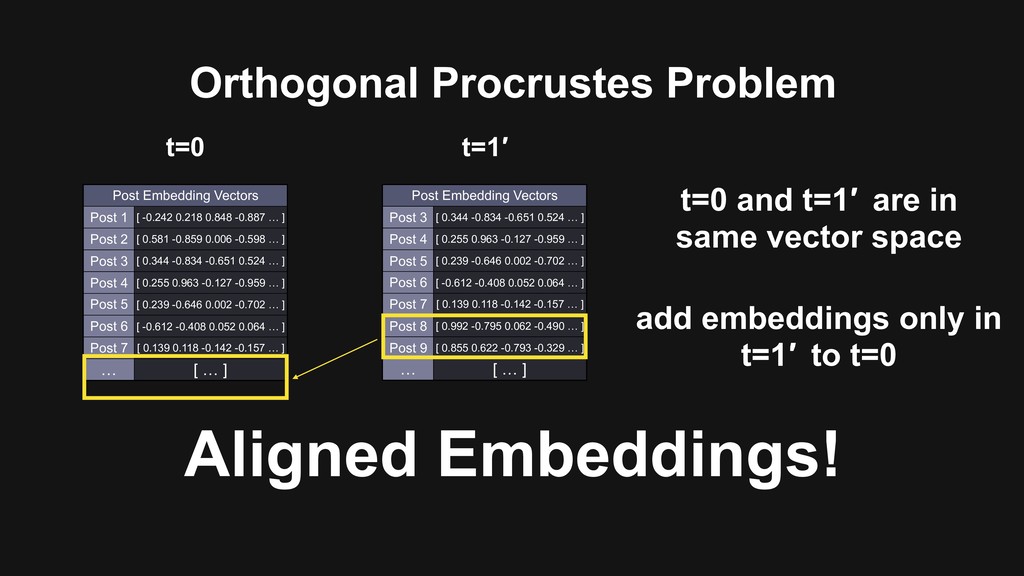
4 Post 1 3 0 2 0 Post 2 1 1 3 2 Post 3 1 0 2 1 Post 4 0 1 4 1 Post Embedding Vectors Post 1 [ -0.242 0.218 0.848 -0.887 … ] Post 2 [ 0.581 -0.859 0.006 -0.598 … ] Post 3 [ 0.344 -0.834 -0.651 0.524 … ] Post 4 [ 0.255 0.963 -0.127 -0.959 … ] … [ … ] User Embedding Vectors [ linear combination of user history ] [ linear combination of user history ] [ linear combination of user history ] [ linear combination of user history ] … [ … ] Worked Much Better!
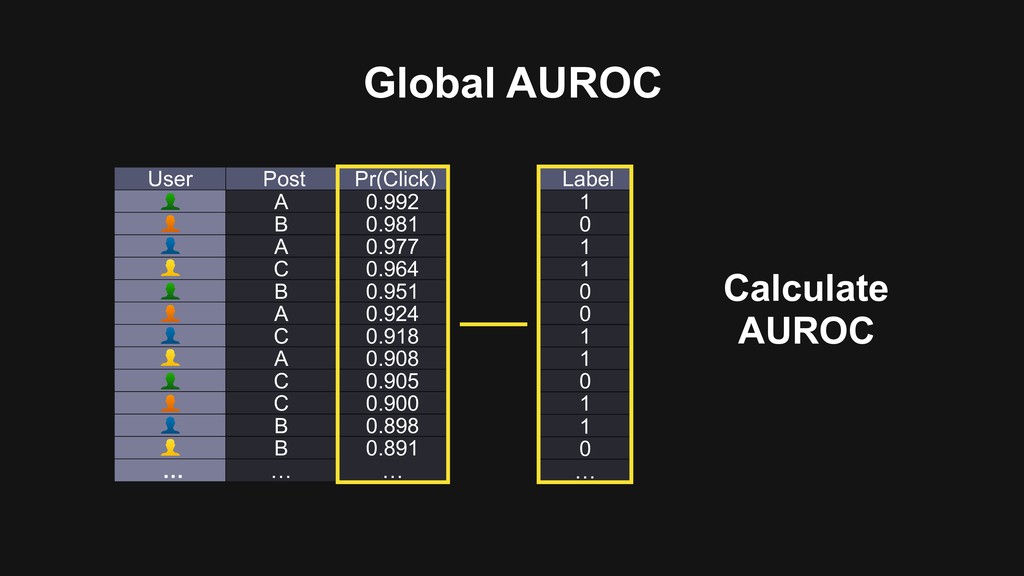
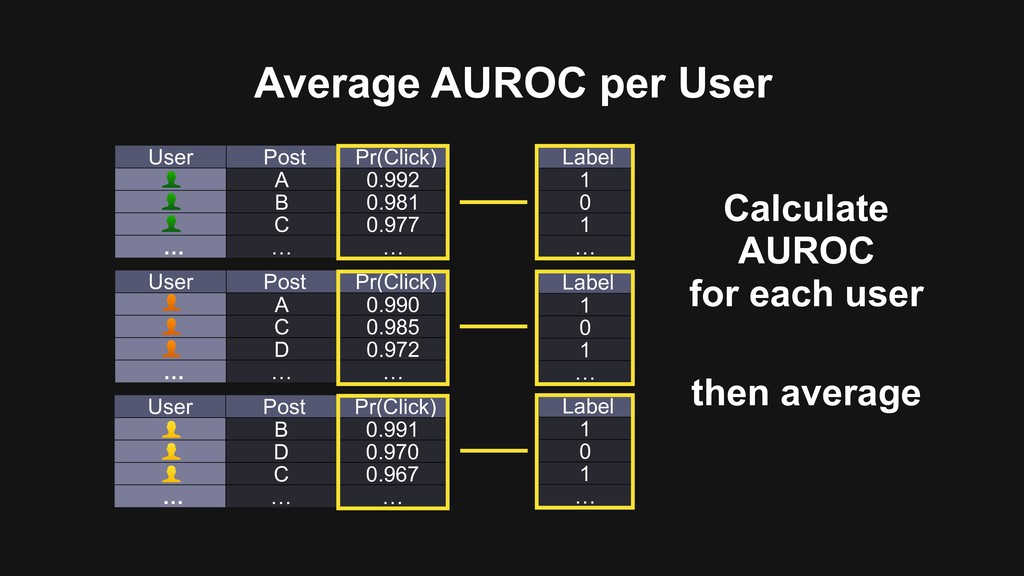
Post Pr(Click) A 0.992 B 0.981 C 0.977 … … … User Post Pr(Click) A 0.990 C 0.985 D 0.972 … … … User Post Pr(Click) B 0.991 D 0.970 C 0.967 … … … Label 1 0 1 … Label 1 0 1 … Calculate AUROC for each user then average
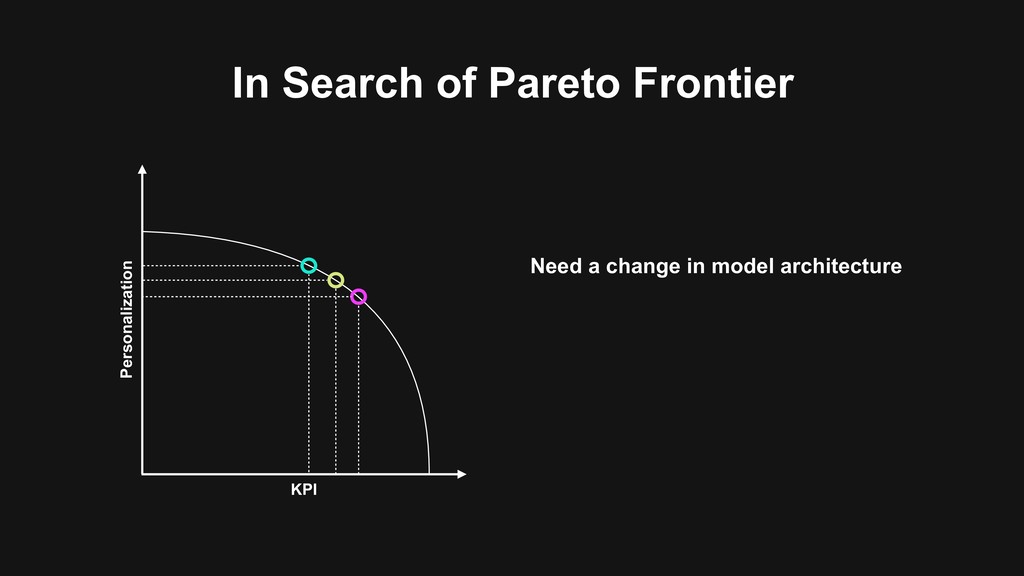
importance of quantitative and qualitative evaluation > “Perfection is not attainable. But if we chase perfection, we can catch excellence.” - Vince Lombardi > Model architecture is essential > Understanding your evaluation metric
importance of quantitative and qualitative evaluation > “Perfection is not attainable. But if we chase perfection, we can catch excellence.” - Vince Lombardi > Model architecture is essential > Understanding your evaluation metric
importance of quantitative and qualitative evaluation > “Perfection is not attainable. But if we chase perfection, we can catch excellence.” - Vince Lombardi > Model architecture is essential > Understanding your evaluation metric
importance of quantitative and qualitative evaluation > “Perfection is not attainable. But if we chase perfection, we can catch excellence.” - Vince Lombardi > Model architecture is essential > Understanding your evaluation metric