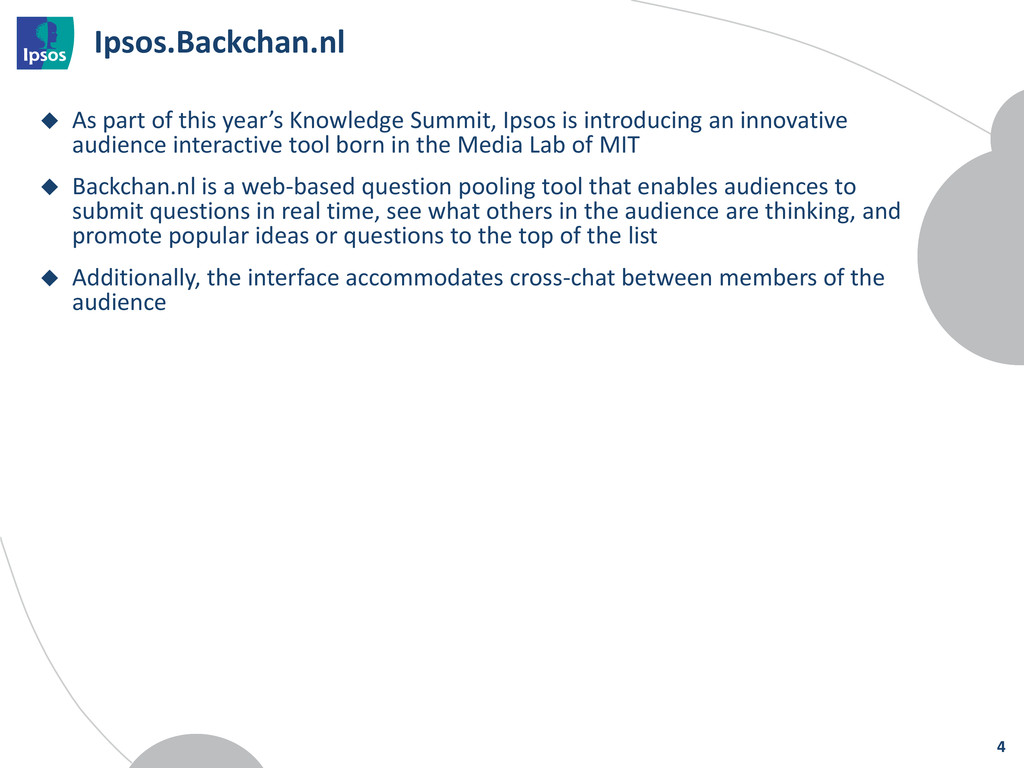
is introducing an innovative audience interactive tool born in the Media Lab of MIT Backchan.nl is a web-based question pooling tool that enables audiences to submit questions in real time, see what others in the audience are thinking, and promote popular ideas or questions to the top of the list Additionally, the interface accommodates cross-chat between members of the audience 4
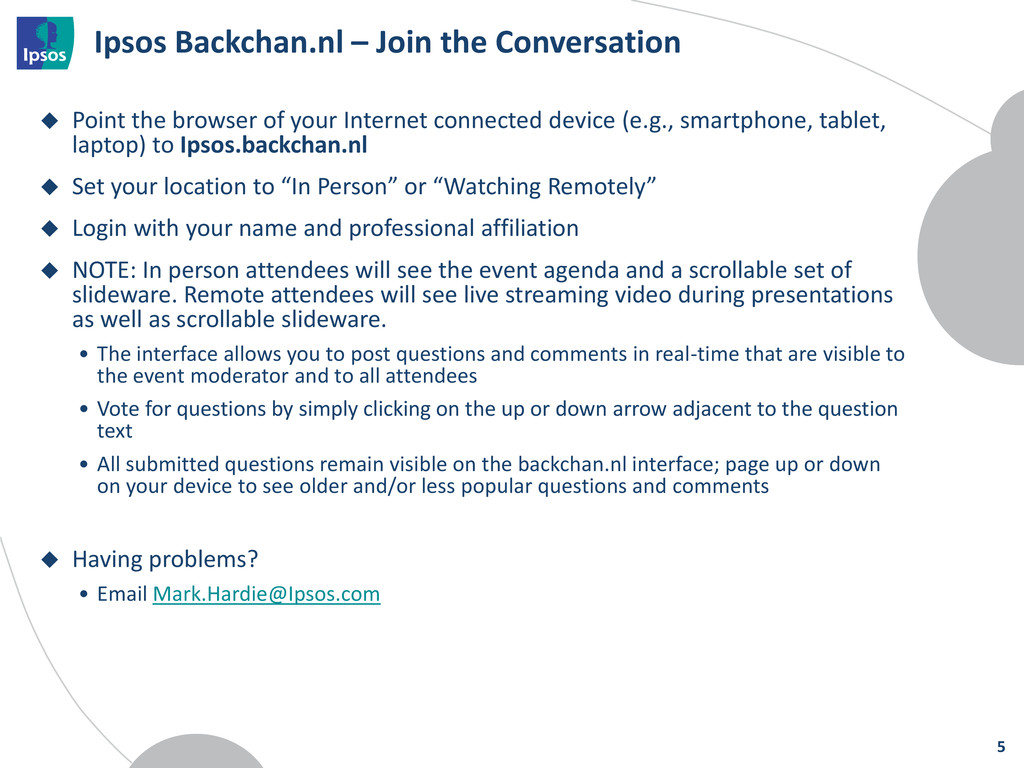
of your Internet connected device (e.g., smartphone, tablet, laptop) to Ipsos.backchan.nl Set your location to “In Person” or “Watching Remotely” Login with your name and professional affiliation NOTE: In person attendees will see the event agenda and a scrollable set of slideware. Remote attendees will see live streaming video during presentations as well as scrollable slideware. • The interface allows you to post questions and comments in real-time that are visible to the event moderator and to all attendees • Vote for questions by simply clicking on the up or down arrow adjacent to the question text • All submitted questions remain visible on the backchan.nl interface; page up or down on your device to see older and/or less popular questions and comments Having problems? • Email [email protected] 5
Research magazine, 2009 Rated “#1 in Client Satisfaction” • MarketResearchCareers.com, 2010 Ranked among the top three in the market research community for innovation • (GreenBook Research Industry Trends Report, 2012) Founded in France: 1975 Compared to other survey-based MR firms: 3rd largest in the world Number of countries with Ipsos offices: 80+ Number of countries we do research in: 100+ Number of full-time Ipsos employees: 16,000+ Clients around the world: 5,000+ Interviews conducted each year: 70 million 6
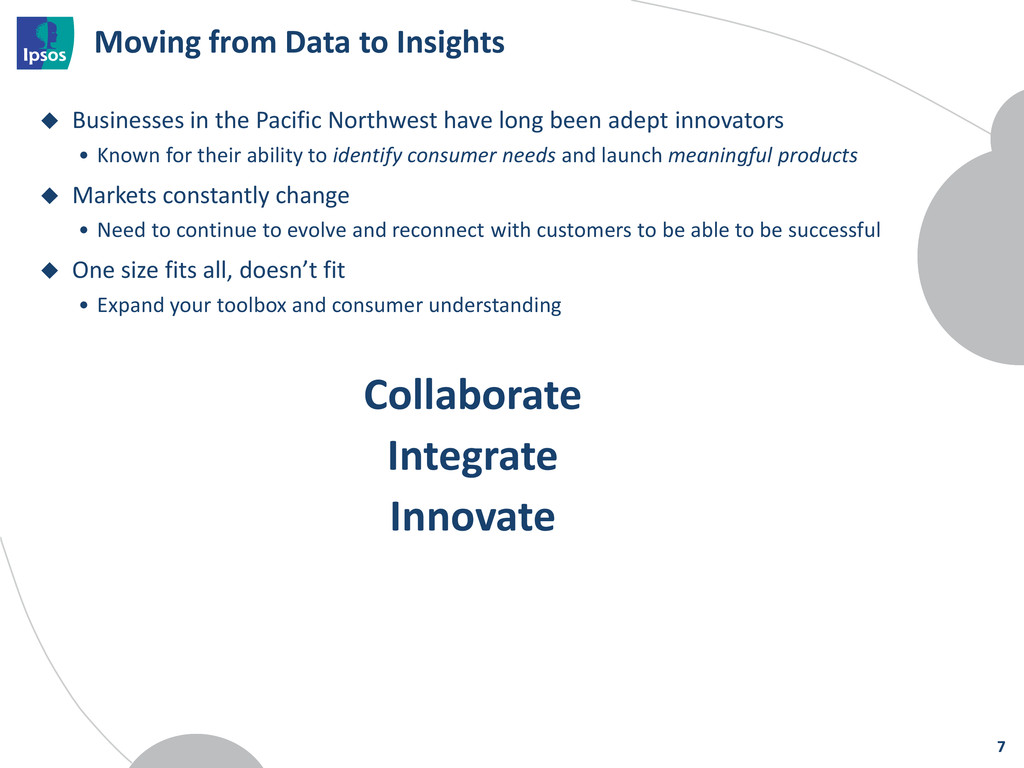
Northwest have long been adept innovators • Known for their ability to identify consumer needs and launch meaningful products Markets constantly change • Need to continue to evolve and reconnect with customers to be able to be successful One size fits all, doesn’t fit • Expand your toolbox and consumer understanding Collaborate Integrate Innovate 7
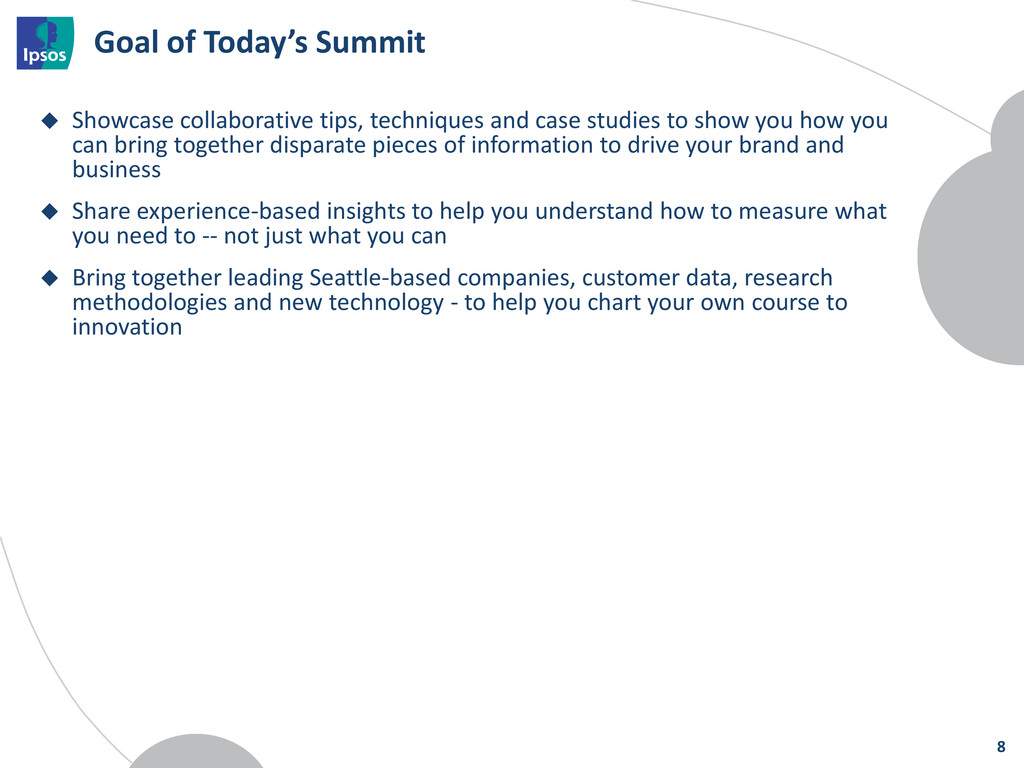
case studies to show you how you can bring together disparate pieces of information to drive your brand and business Share experience-based insights to help you understand how to measure what you need to -- not just what you can Bring together leading Seattle-based companies, customer data, research methodologies and new technology - to help you chart your own course to innovation 8
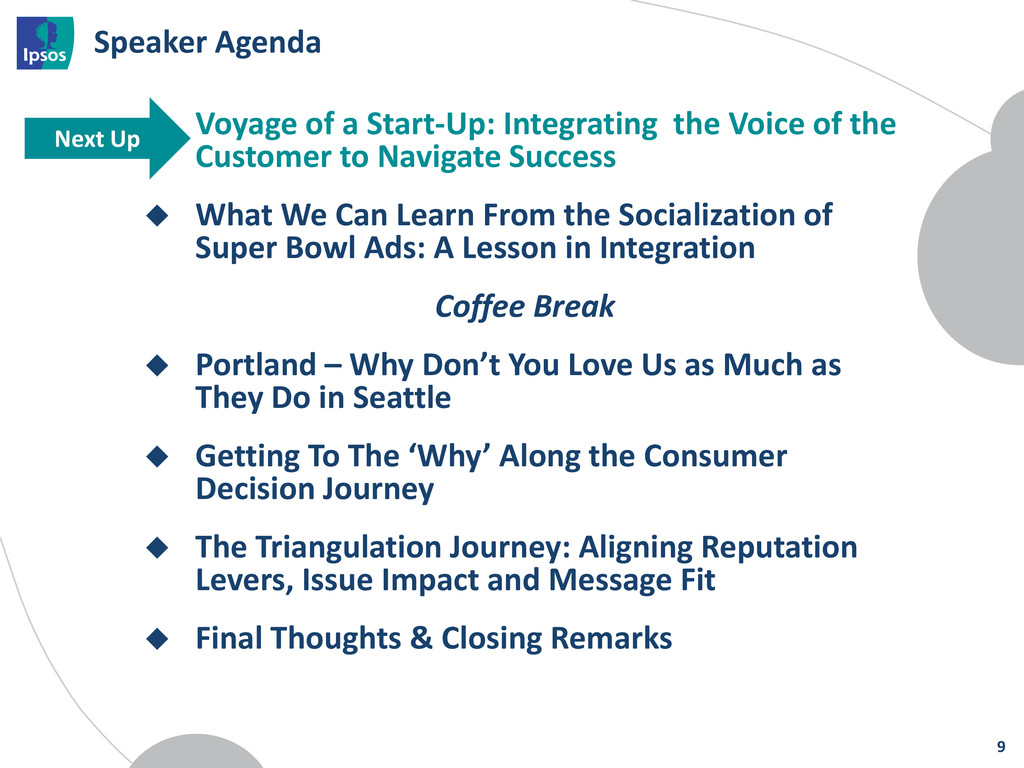
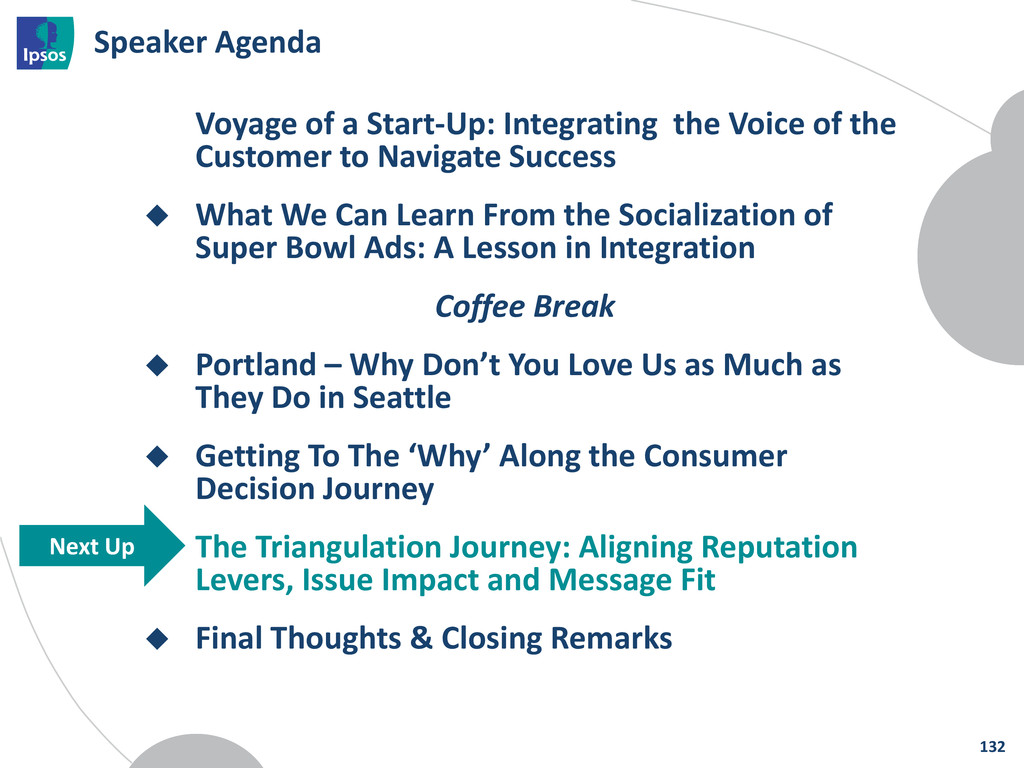
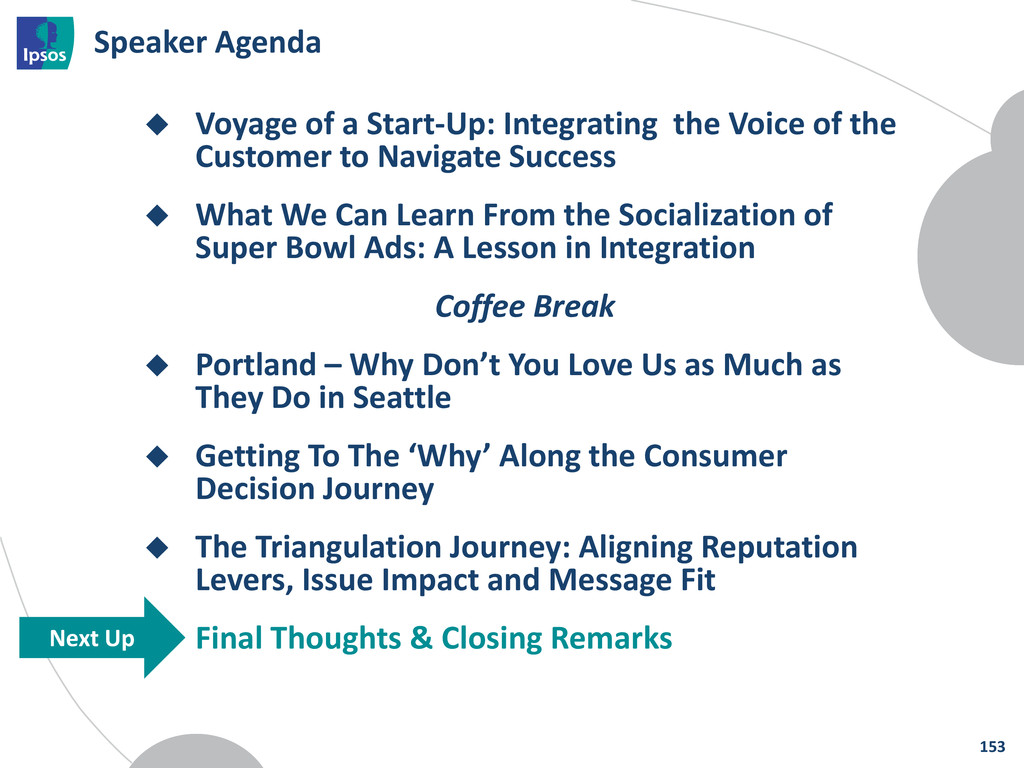
the Customer to Navigate Success What We Can Learn From the Socialization of Super Bowl Ads: A Lesson in Integration Coffee Break Portland – Why Don’t You Love Us as Much as They Do in Seattle Getting To The ‘Why’ Along the Consumer Decision Journey The Triangulation Journey: Aligning Reputation Levers, Issue Impact and Message Fit Final Thoughts & Closing Remarks 9 Next Up
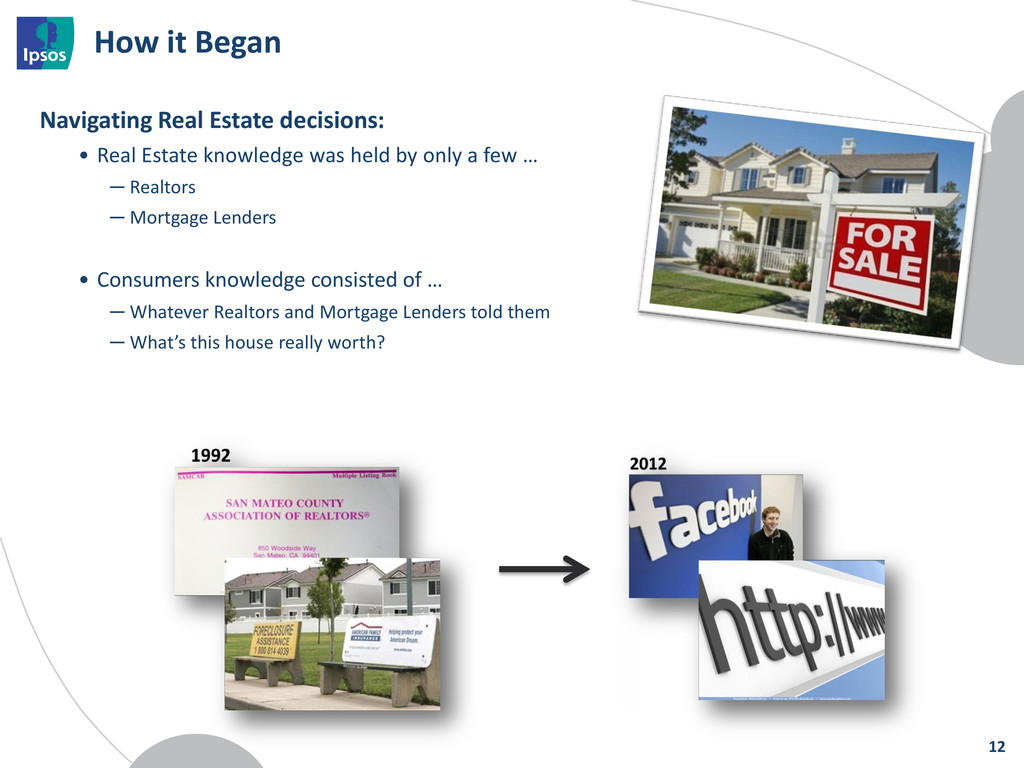
knowledge was held by only a few … ─ Realtors ─ Mortgage Lenders • Consumers knowledge consisted of … ─ Whatever Realtors and Mortgage Lenders told them ─ What’s this house really worth? 12
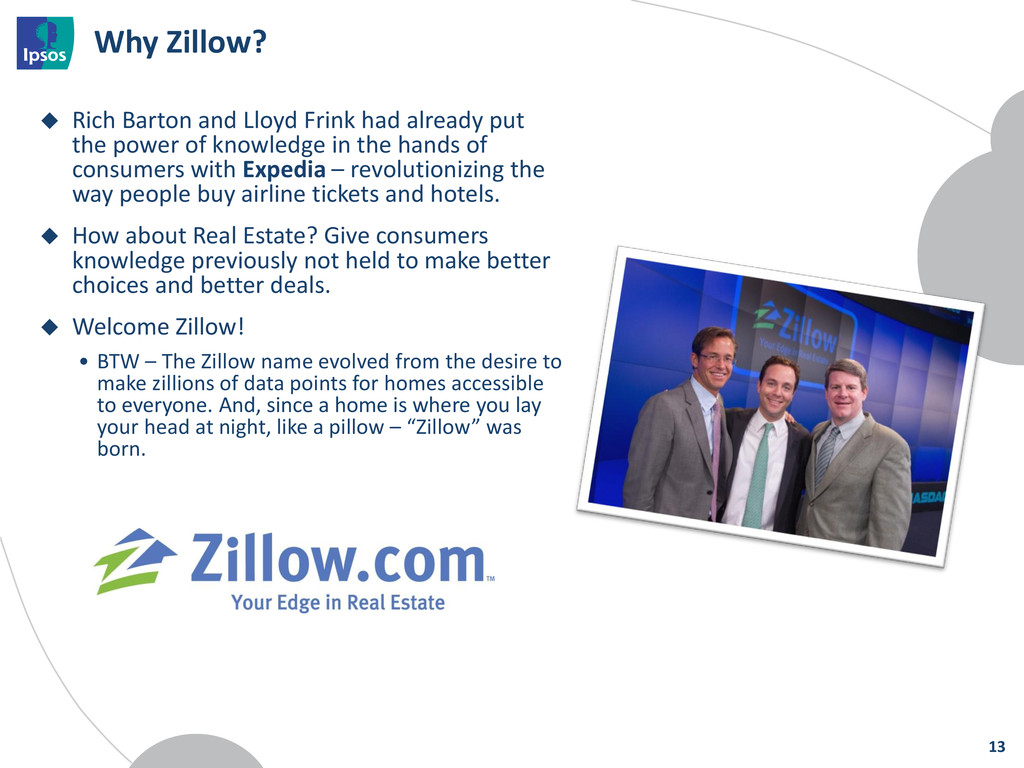
put the power of knowledge in the hands of consumers with Expedia – revolutionizing the way people buy airline tickets and hotels. How about Real Estate? Give consumers knowledge previously not held to make better choices and better deals. Welcome Zillow! • BTW – The Zillow name evolved from the desire to make zillions of data points for homes accessible to everyone. And, since a home is where you lay your head at night, like a pillow – “Zillow” was born. 13
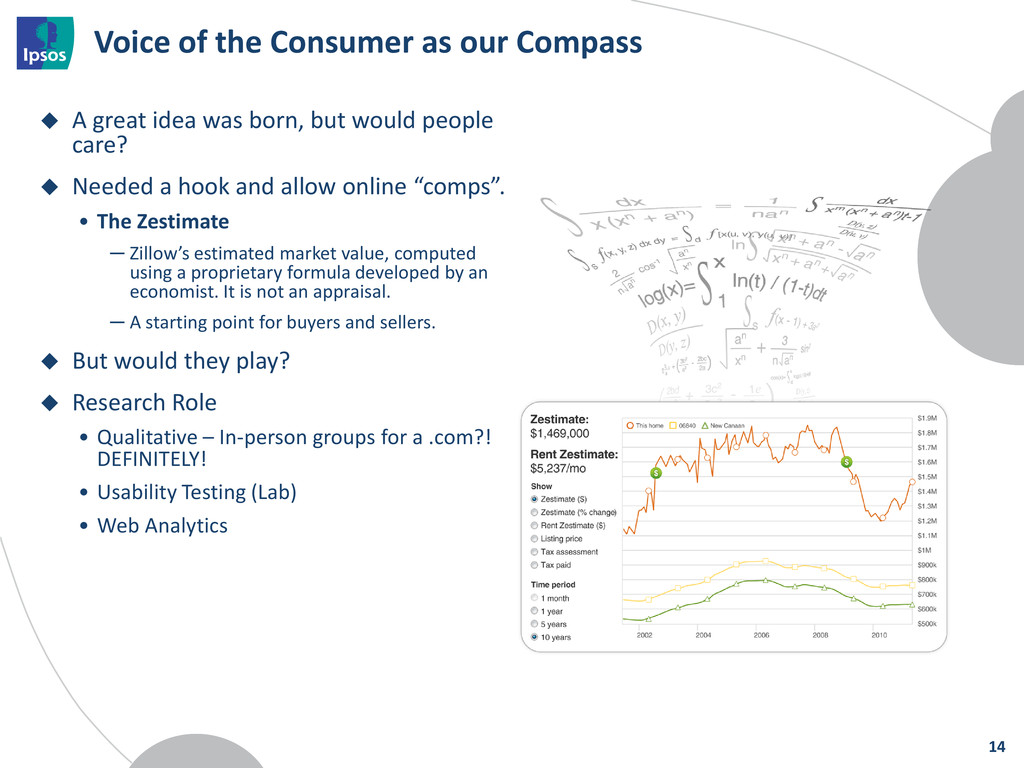
idea was born, but would people care? Needed a hook and allow online “comps”. • The Zestimate ─ Zillow’s estimated market value, computed using a proprietary formula developed by an economist. It is not an appraisal. ─ A starting point for buyers and sellers. But would they play? Research Role • Qualitative – In-person groups for a .com?! DEFINITELY! • Usability Testing (Lab) • Web Analytics 14
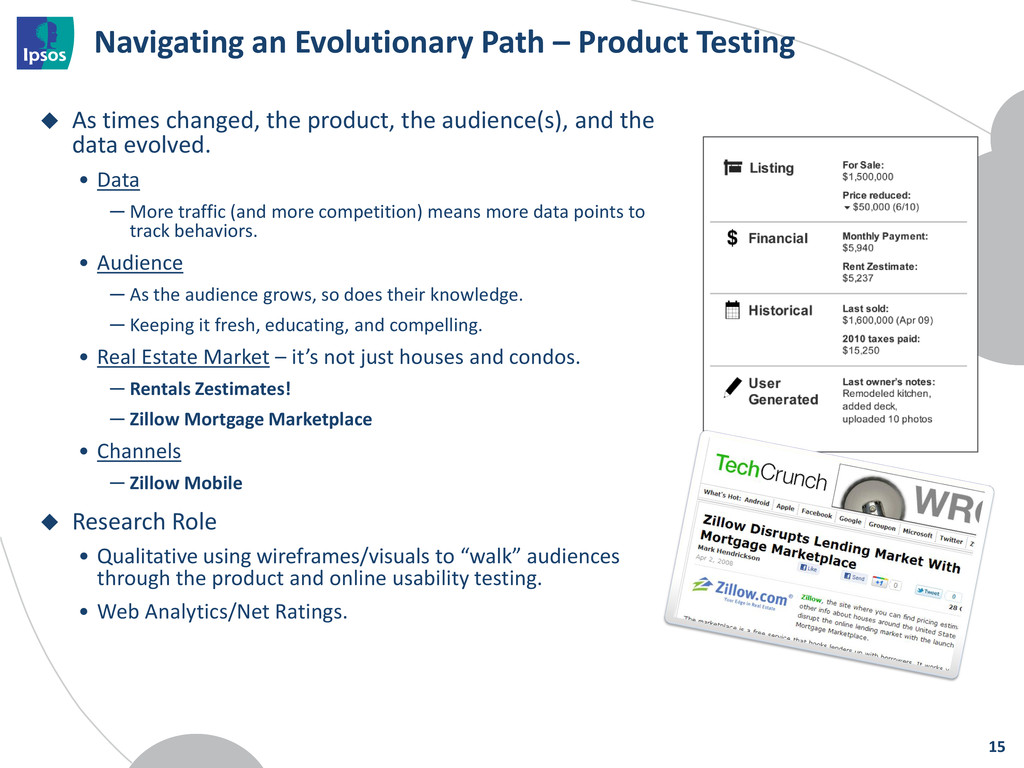
changed, the product, the audience(s), and the data evolved. • Data ─ More traffic (and more competition) means more data points to track behaviors. • Audience ─ As the audience grows, so does their knowledge. ─ Keeping it fresh, educating, and compelling. • Real Estate Market – it’s not just houses and condos. ─ Rentals Zestimates! ─ Zillow Mortgage Marketplace • Channels ─ Zillow Mobile Research Role • Qualitative using wireframes/visuals to “walk” audiences through the product and online usability testing. • Web Analytics/Net Ratings. 15
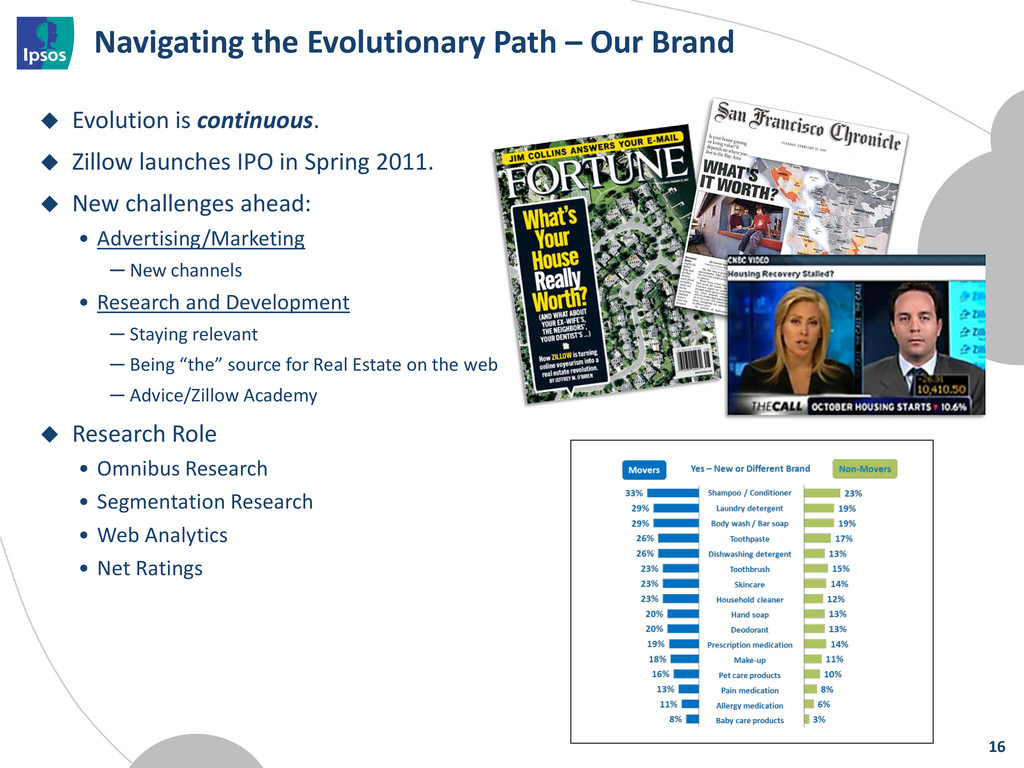
continuous. Zillow launches IPO in Spring 2011. New challenges ahead: • Advertising/Marketing ─ New channels • Research and Development ─ Staying relevant ─ Being “the” source for Real Estate on the web ─ Advice/Zillow Academy Research Role • Omnibus Research • Segmentation Research • Web Analytics • Net Ratings 16
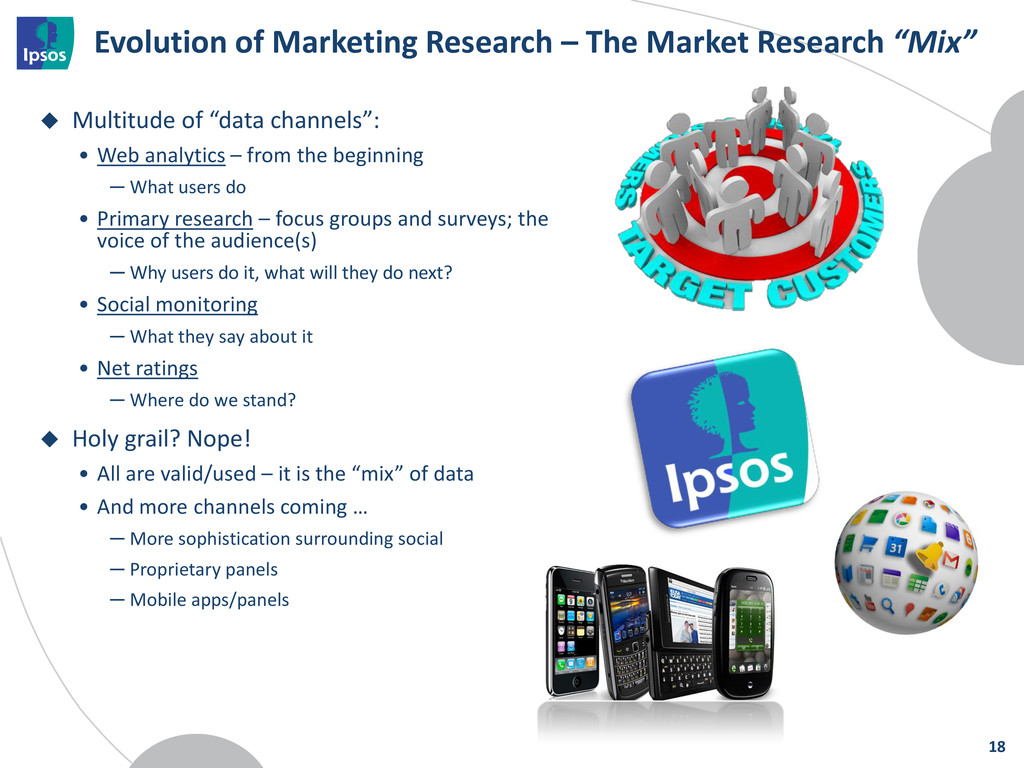
Multitude of “data channels”: • Web analytics – from the beginning ─ What users do • Primary research – focus groups and surveys; the voice of the audience(s) ─ Why users do it, what will they do next? • Social monitoring ─ What they say about it • Net ratings ─ Where do we stand? Holy grail? Nope! • All are valid/used – it is the “mix” of data • And more channels coming … ─ More sophistication surrounding social ─ Proprietary panels ─ Mobile apps/panels 18
of the Customer to Navigate Success What We Can Learn From the Socialization of Super Bowl Ads: A Lesson in Integration Coffee Break Portland – Why Don’t You Love Us as Much as They Do in Seattle Getting To The ‘Why’ Along the Consumer Decision Journey The Triangulation Journey: Aligning Reputation Levers, Issue Impact and Message Fit Final Thoughts & Closing Remarks 20 Next Up
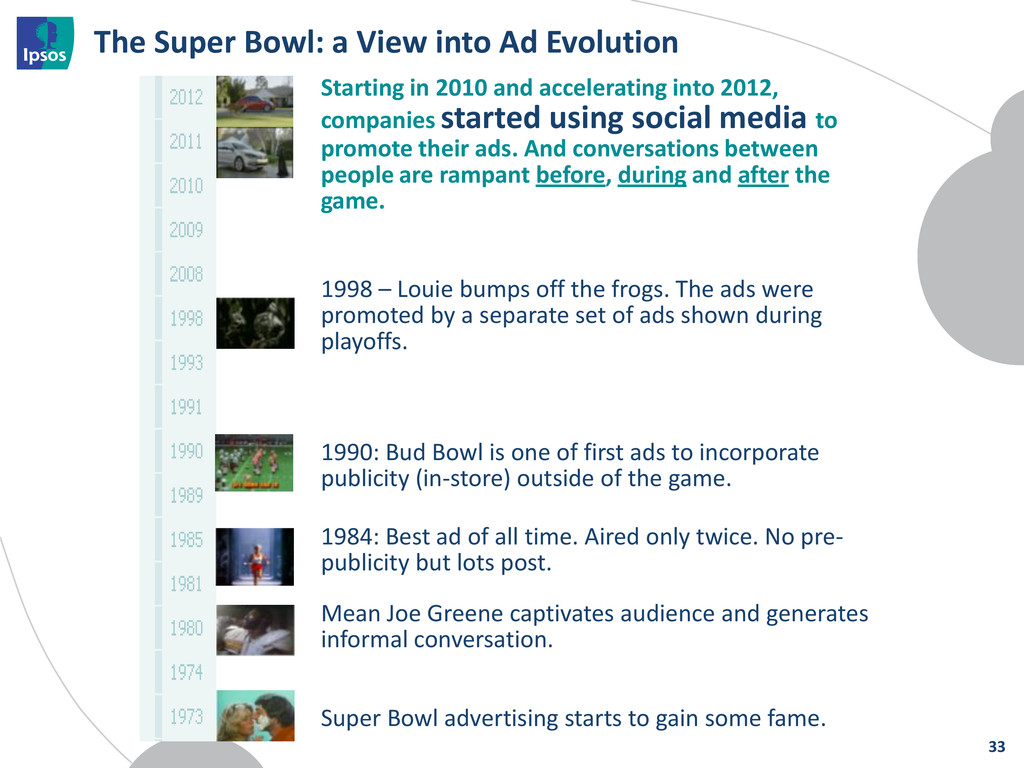
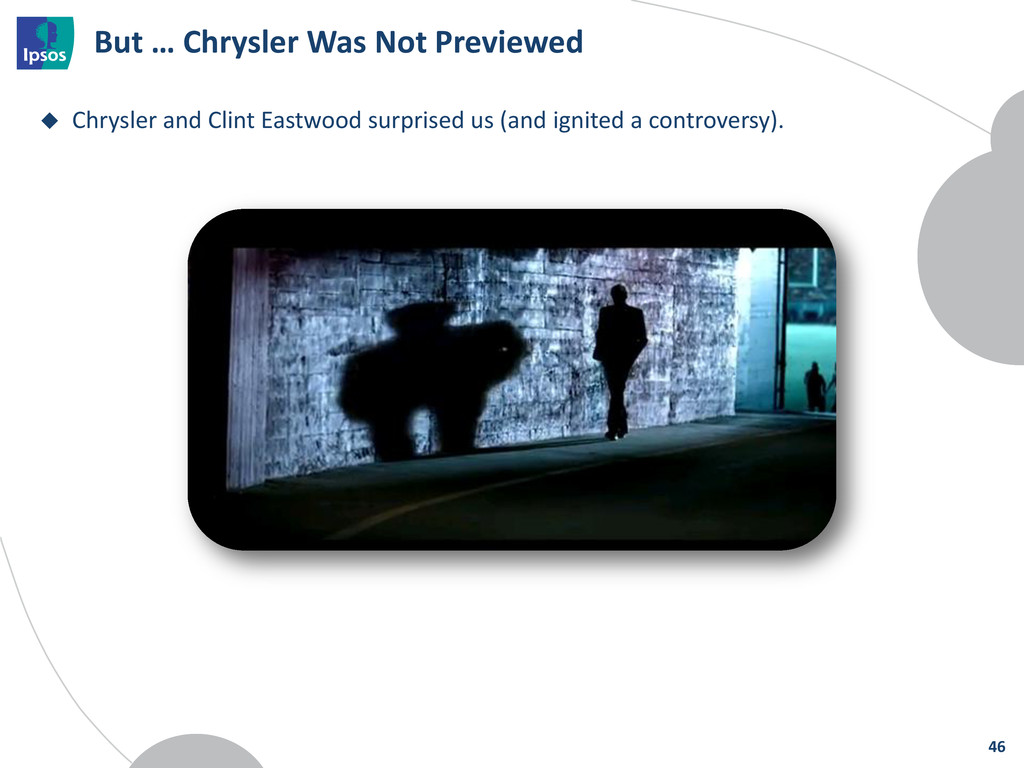
advertising starts to gain some fame. Mean Joe Greene captivates audience and generates informal conversation. 1990: Bud Bowl is one of first ads to incorporate publicity (in-store) outside of the game. 1998 – Louie bumps off the frogs. The ads were promoted by a separate set of ads shown during playoffs. 1984: Best ad of all time. Aired only twice. No pre- publicity but lots post. Starting in 2010 and accelerating into 2012, companies started using social media to promote their ads. And conversations between people are rampant before, during and after the game. 33
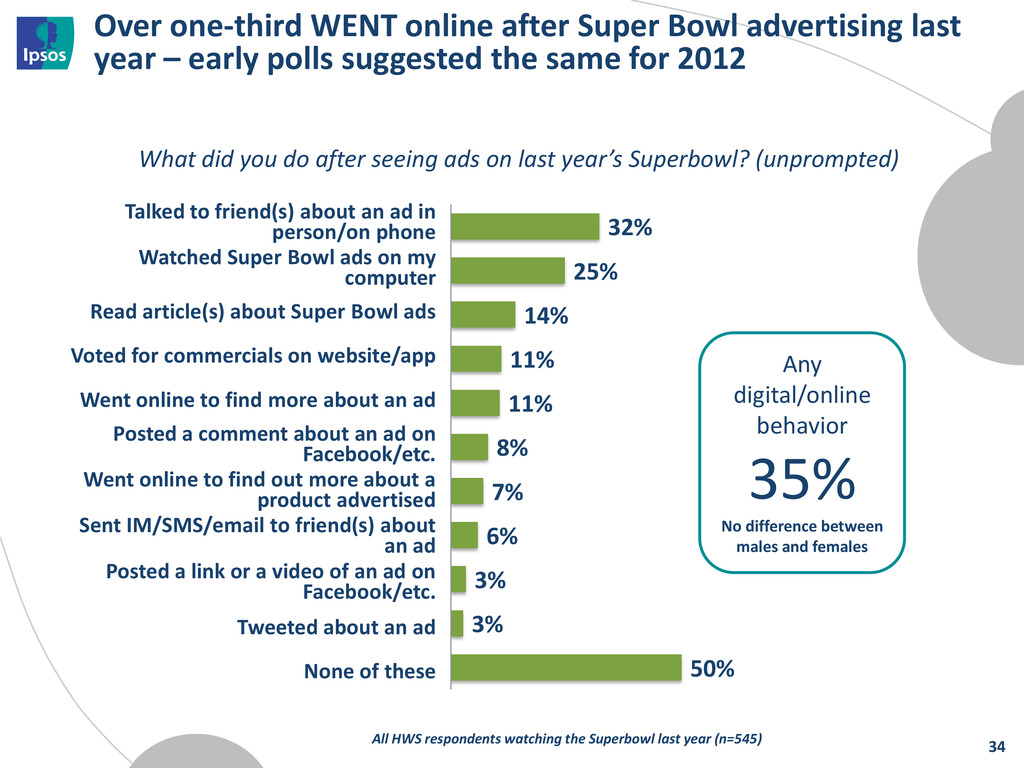
– early polls suggested the same for 2012 32% 25% 14% 11% 11% 8% 7% 6% 3% 3% 50% What did you do after seeing ads on last year’s Superbowl? (unprompted) All HWS respondents watching the Superbowl last year (n=545) Any digital/online behavior 35% No difference between males and females 34 Talked to friend(s) about an ad in person/on phone Watched Super Bowl ads on my computer Read article(s) about Super Bowl ads Voted for commercials on website/app Went online to find more about an ad Posted a comment about an ad on Facebook/etc. Went online to find out more about a product advertised Sent IM/SMS/email to friend(s) about an ad Posted a link or a video of an ad on Facebook/etc. Tweeted about an ad None of these
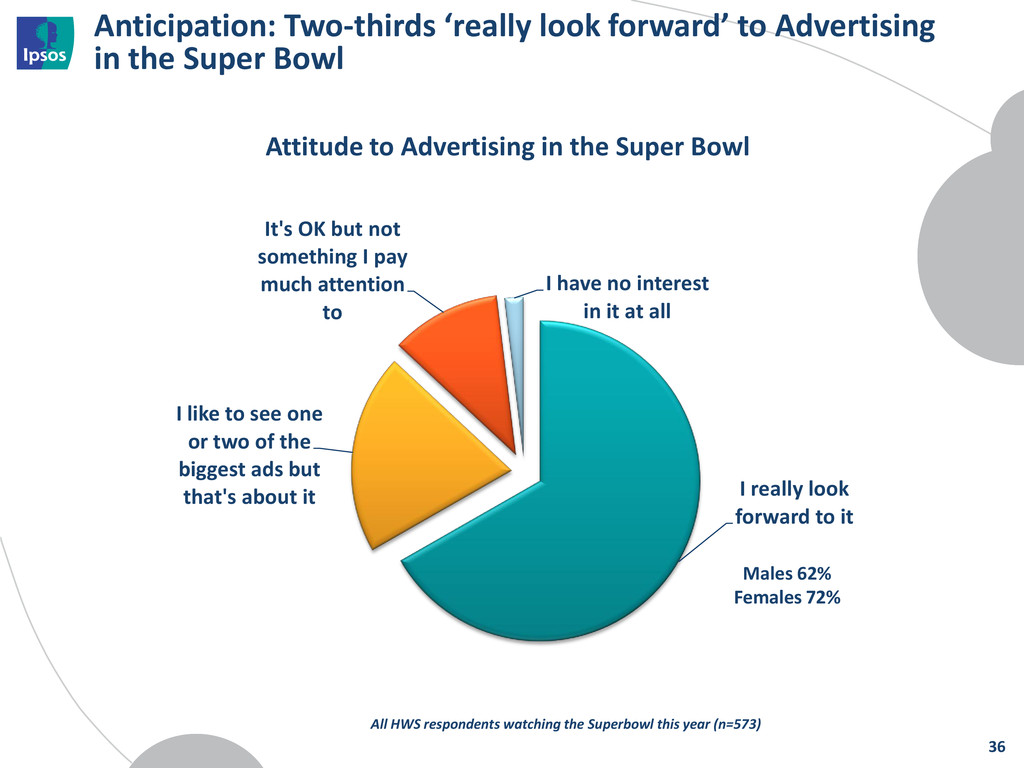
Bowl I really look forward to it I like to see one or two of the biggest ads but that's about it It's OK but not something I pay much attention to I have no interest in it at all Attitude to Advertising in the Super Bowl All HWS respondents watching the Superbowl this year (n=573) Males 62% Females 72% 36
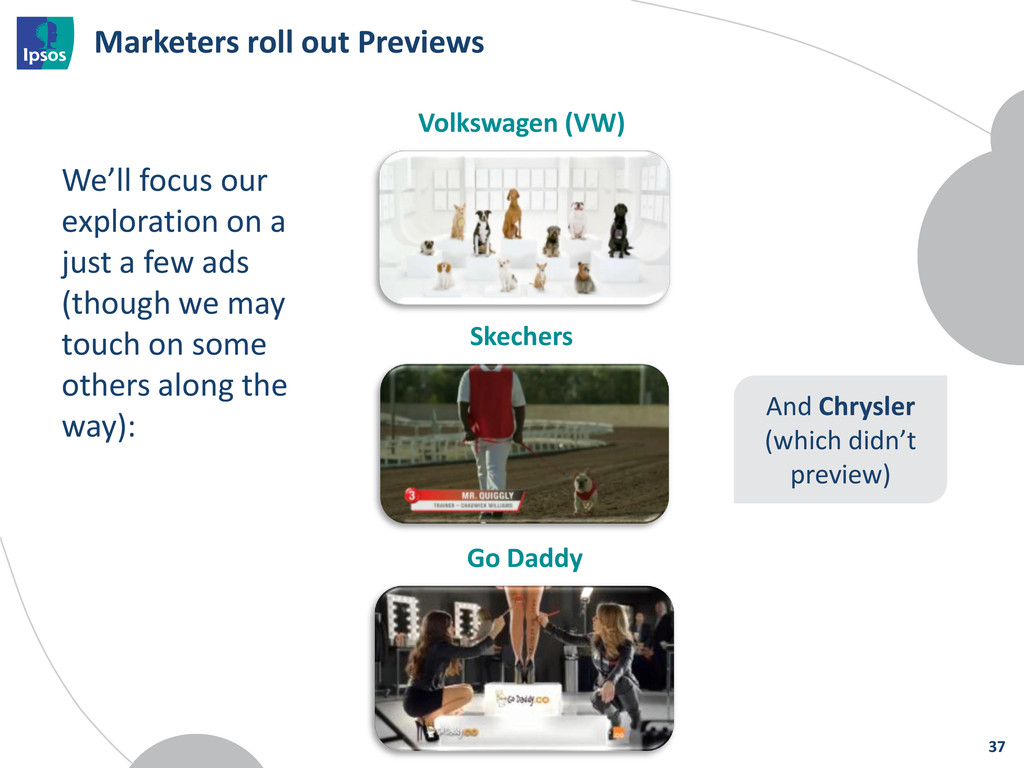
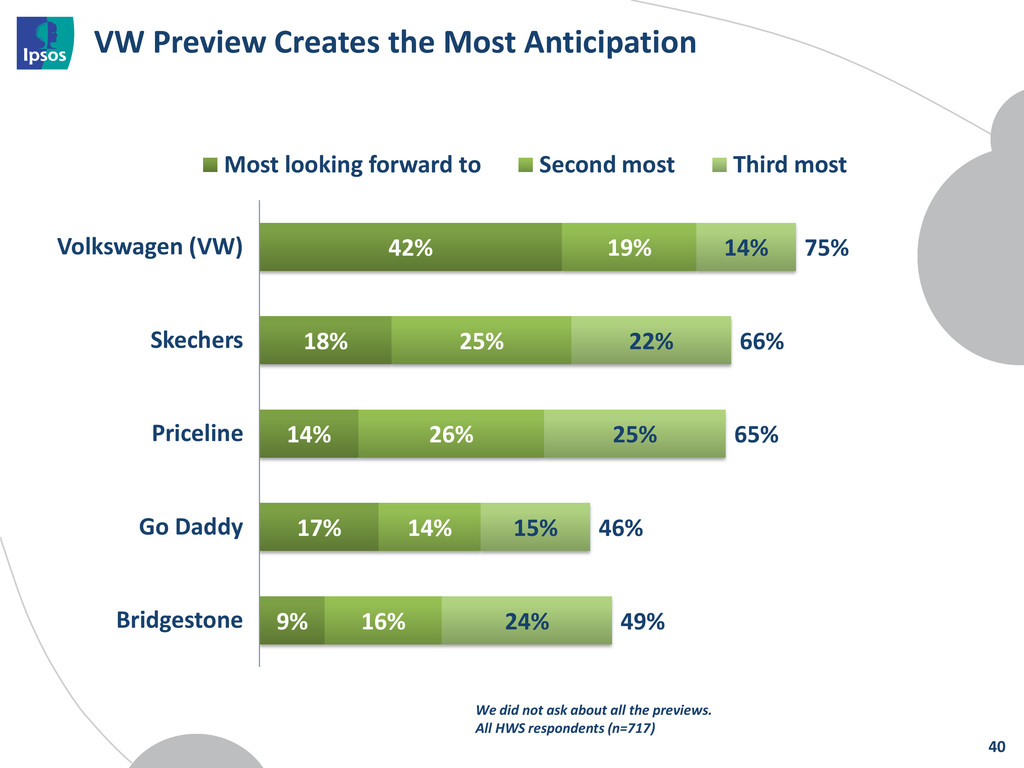
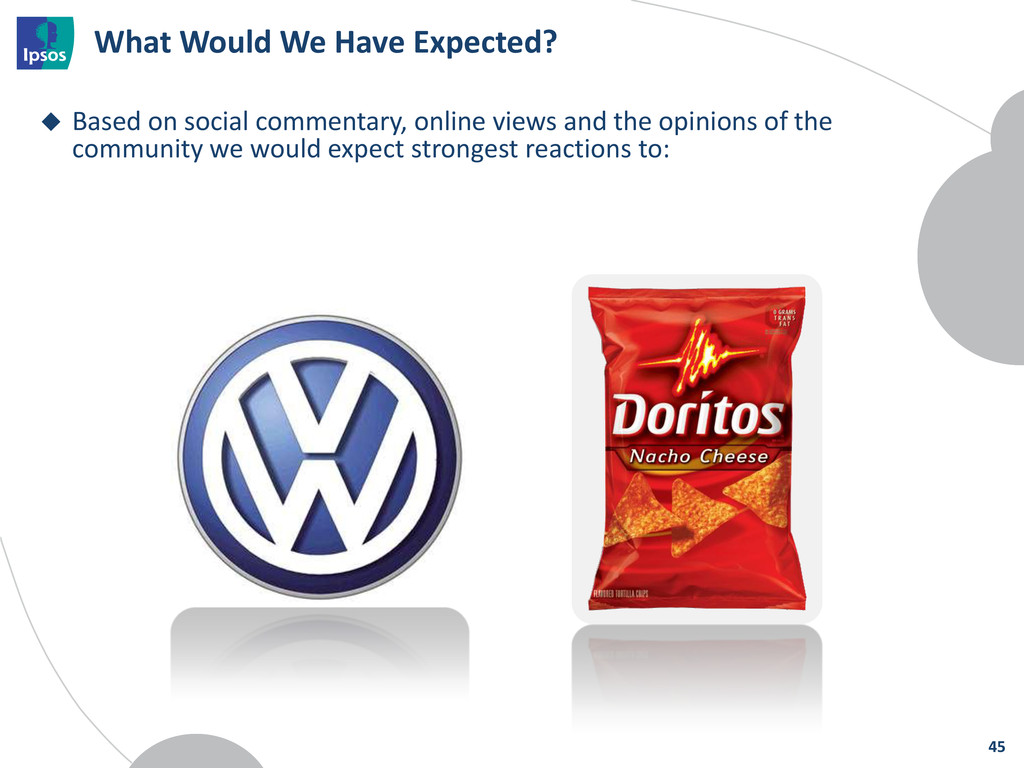
9% 19% 25% 26% 14% 16% 14% 22% 25% 15% 24% 75% 66% 65% 46% 49% Volkswagen (VW) Skechers Priceline Go Daddy Bridgestone Most looking forward to Second most Third most We did not ask about all the previews. All HWS respondents (n=717) 40
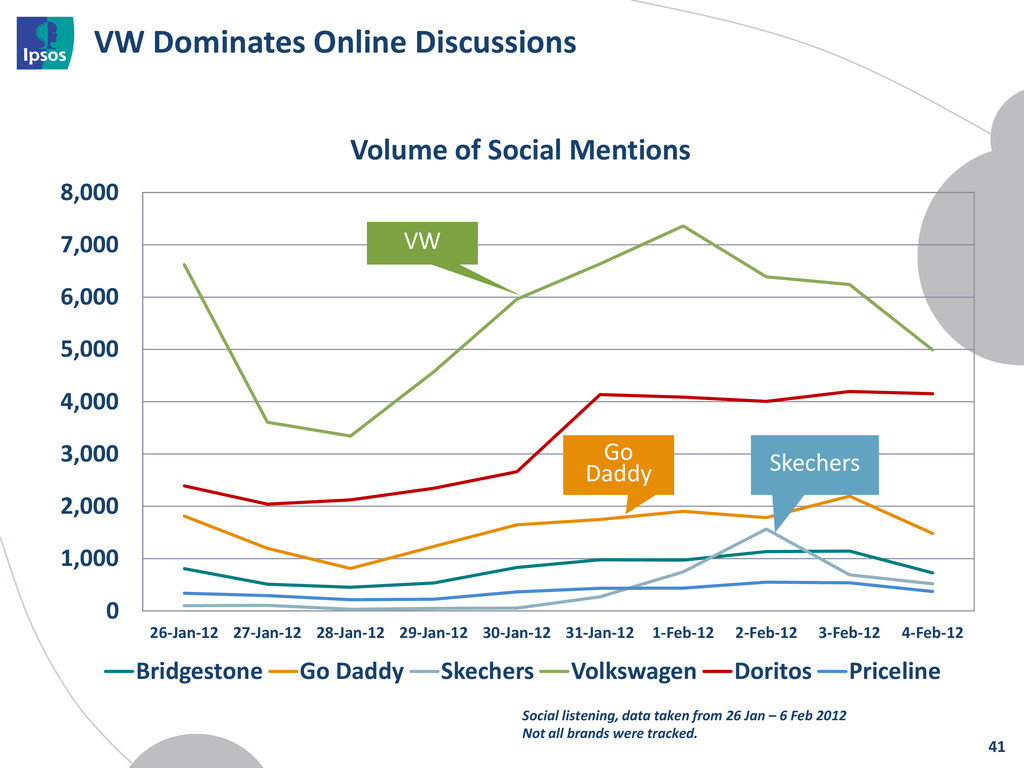
6,000 7,000 8,000 26-Jan-12 27-Jan-12 28-Jan-12 29-Jan-12 30-Jan-12 31-Jan-12 1-Feb-12 2-Feb-12 3-Feb-12 4-Feb-12 Volume of Social Mentions Bridgestone Go Daddy Skechers Volkswagen Doritos Priceline Social listening, data taken from 26 Jan – 6 Feb 2012 Not all brands were tracked. VW Skechers Go Daddy 41
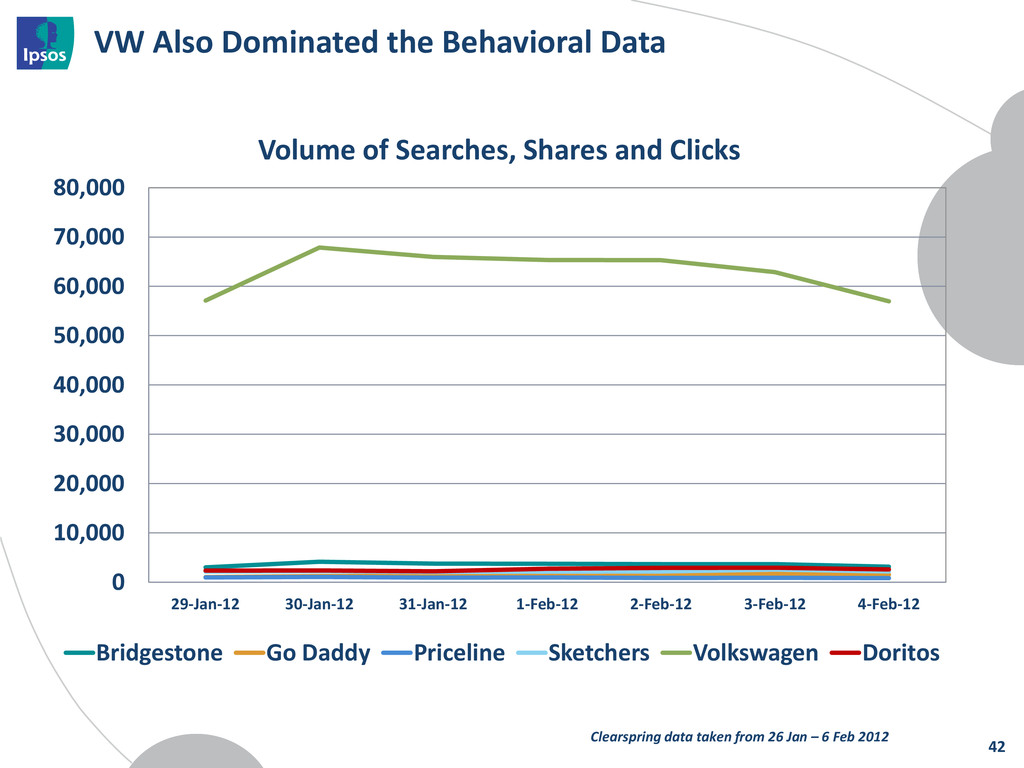
40,000 50,000 60,000 70,000 80,000 29-Jan-12 30-Jan-12 31-Jan-12 1-Feb-12 2-Feb-12 3-Feb-12 4-Feb-12 Volume of Searches, Shares and Clicks Bridgestone Go Daddy Priceline Sketchers Volkswagen Doritos Clearspring data taken from 26 Jan – 6 Feb 2012 42
during, and after Passive behavioral tracking up to, during, and after Ipsos ASI Next*Connect Ad Test results Innerscope biometrics – collected live 44
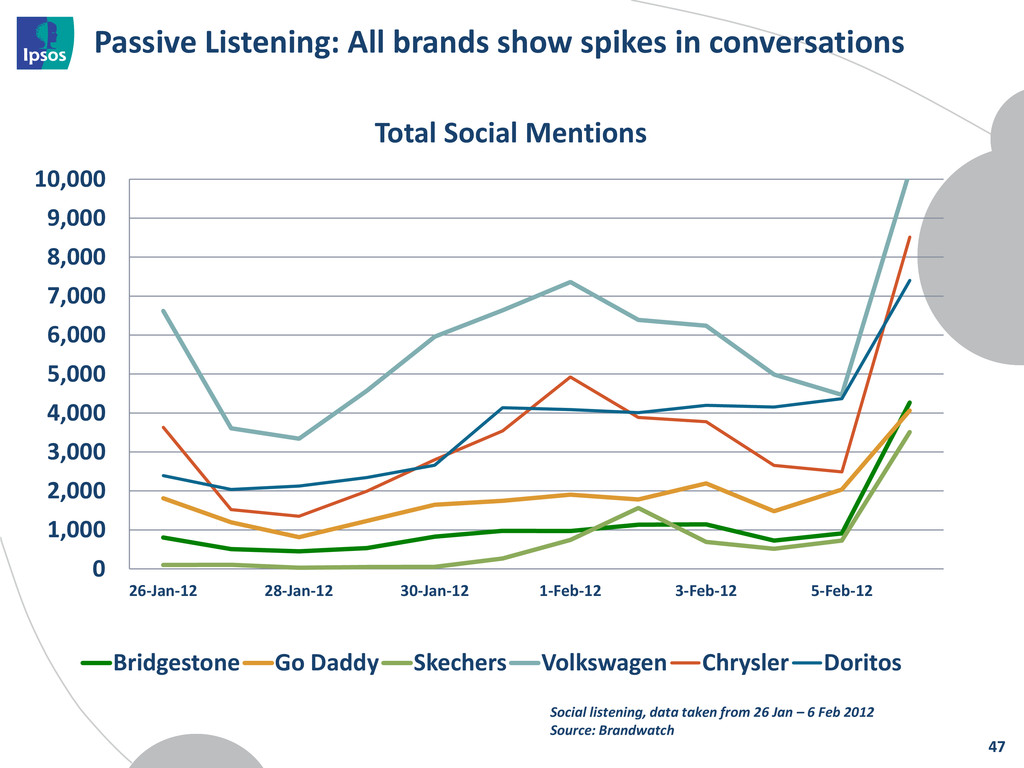
2,000 3,000 4,000 5,000 6,000 7,000 8,000 9,000 10,000 26-Jan-12 28-Jan-12 30-Jan-12 1-Feb-12 3-Feb-12 5-Feb-12 Total Social Mentions Bridgestone Go Daddy Skechers Volkswagen Chrysler Doritos Social listening, data taken from 26 Jan – 6 Feb 2012 Source: Brandwatch 47
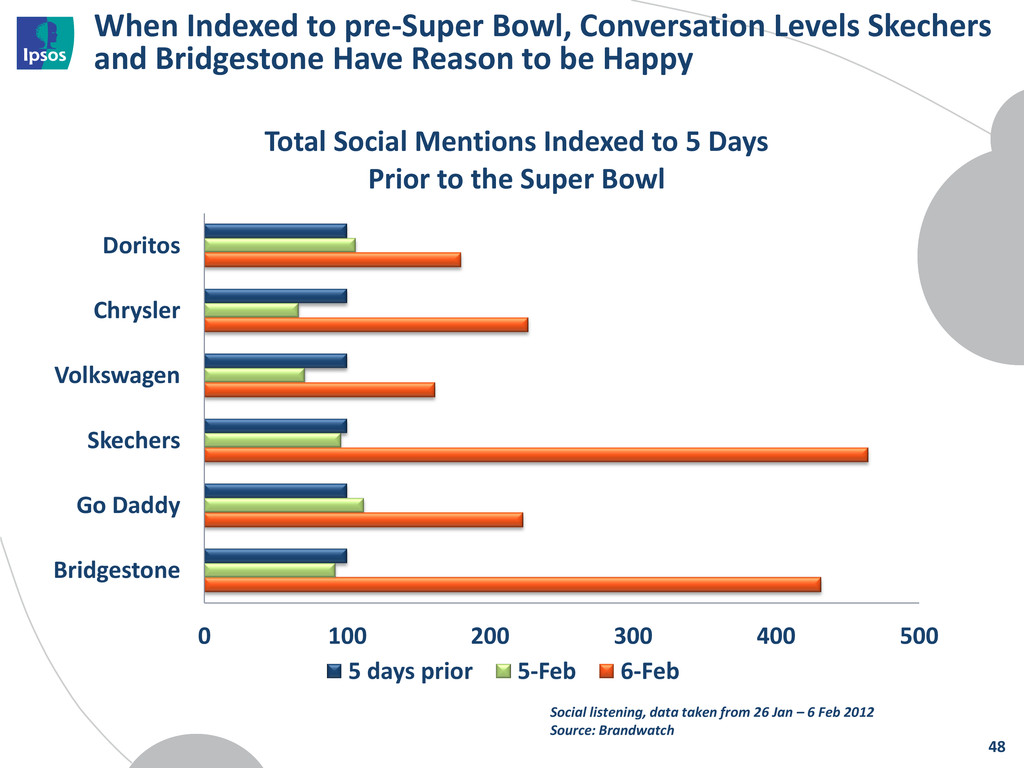
Have Reason to be Happy 0 100 200 300 400 500 Bridgestone Go Daddy Skechers Volkswagen Chrysler Doritos Total Social Mentions Indexed to 5 Days Prior to the Super Bowl 5 days prior 5-Feb 6-Feb 48 Social listening, data taken from 26 Jan – 6 Feb 2012 Source: Brandwatch
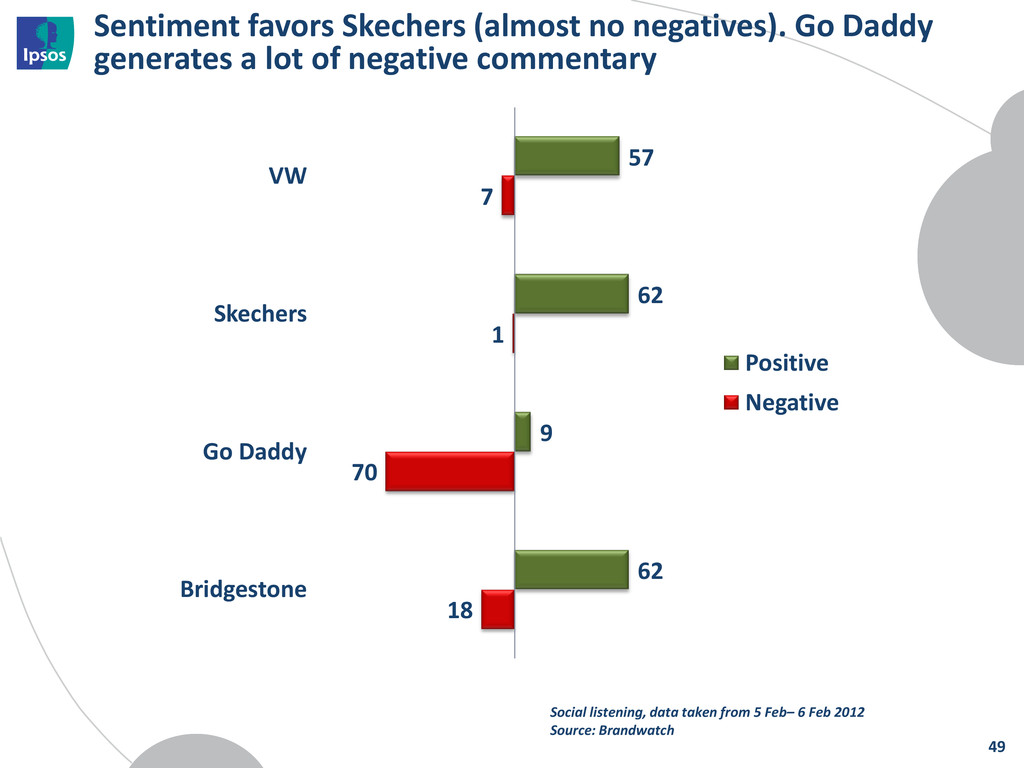
lot of negative commentary 49 57 62 9 62 7 1 70 18 VW Skechers Go Daddy Bridgestone Positive Negative Social listening, data taken from 5 Feb– 6 Feb 2012 Source: Brandwatch
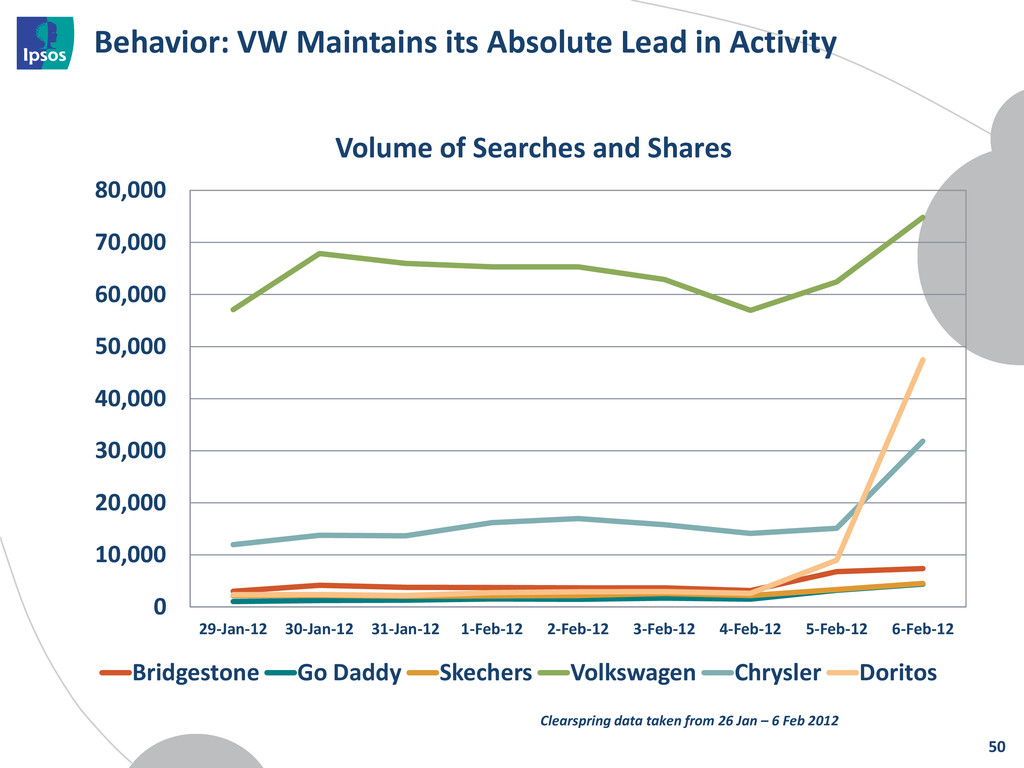
20,000 30,000 40,000 50,000 60,000 70,000 80,000 29-Jan-12 30-Jan-12 31-Jan-12 1-Feb-12 2-Feb-12 3-Feb-12 4-Feb-12 5-Feb-12 6-Feb-12 Volume of Searches and Shares Bridgestone Go Daddy Skechers Volkswagen Chrysler Doritos Clearspring data taken from 26 Jan – 6 Feb 2012 50
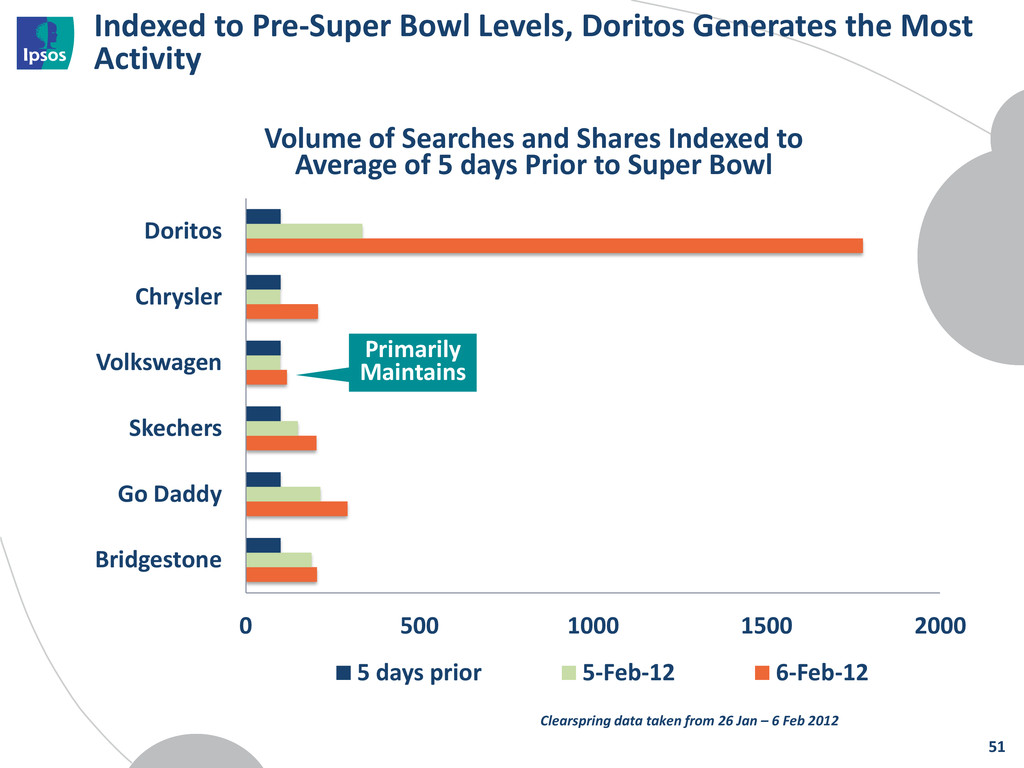
0 500 1000 1500 2000 Bridgestone Go Daddy Skechers Volkswagen Chrysler Doritos Volume of Searches and Shares Indexed to Average of 5 days Prior to Super Bowl 5 days prior 5-Feb-12 6-Feb-12 Primarily Maintains Clearspring data taken from 26 Jan – 6 Feb 2012 51
volume, but this can be attributed to the pre-Super Bowl hype. Lesson: The ad itself doesn’t appear to have added much but the social component helped maintain momentum. Skechers is a winner in parts of the social media world (except YouTube). Lesson: There is more to life than YouTube views. Chrysler emerges as strong. Lesson: The power of creative to drive results is comparable to those with heavy hype. Go Daddy also generates some buzz. Lesson: Not all buzz is good buzz. 52
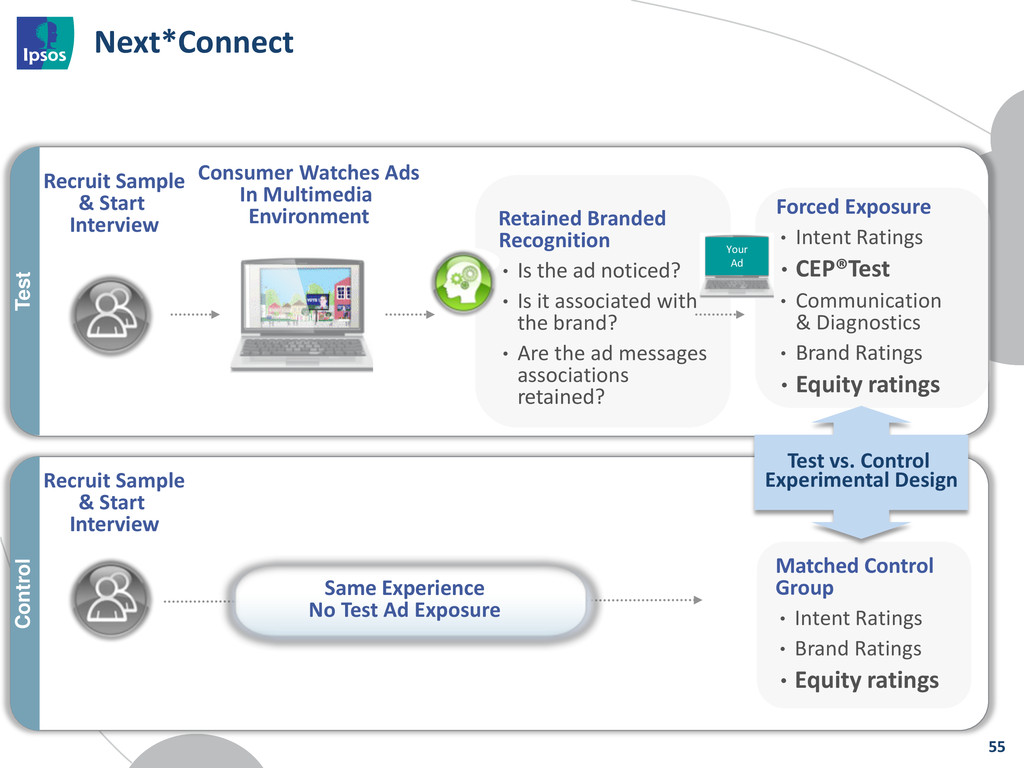
In Multimedia Environment Forced Exposure • Intent Ratings •CEP®Test • Communication & Diagnostics • Brand Ratings •Equity ratings Matched Control Group • Intent Ratings • Brand Ratings •Equity ratings Retained Branded Recognition • Is the ad noticed? • Is it associated with the brand? • Are the ad messages associations retained? Recruit Sample & Start Interview Recruit Sample & Start Interview Test vs. Control Experimental Design Control Test Your Ad 55
GoDaddy Paint Doritos Sling Baby Doritos Man's Best Friend Skechers Chrysler VW M&Ms Indexed To Average of Super Bowl Ads Impact on Opinion Breakthrough M&Ms and Doritos show strength in these measures of potential business success. GoDaddy is noticed and well branded but not a positive impact on the brand. Chrysler has some branding issues but does have a positive impact on opinion. 56
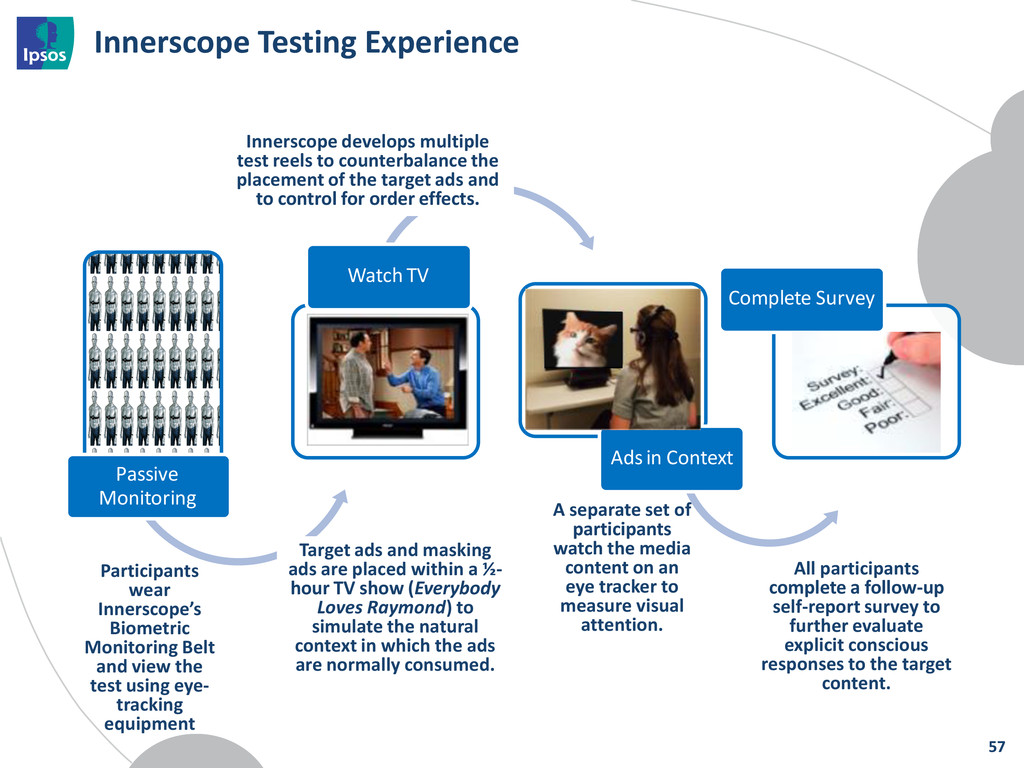
Testing Experience Participants wear Innerscope’s Biometric Monitoring Belt and view the test using eye- tracking equipment Target ads and masking ads are placed within a ½- hour TV show (Everybody Loves Raymond) to simulate the natural context in which the ads are normally consumed. Innerscope develops multiple test reels to counterbalance the placement of the target ads and to control for order effects. All participants complete a follow-up self-report survey to further evaluate explicit conscious responses to the target content. A separate set of participants watch the media content on an eye tracker to measure visual attention. 57
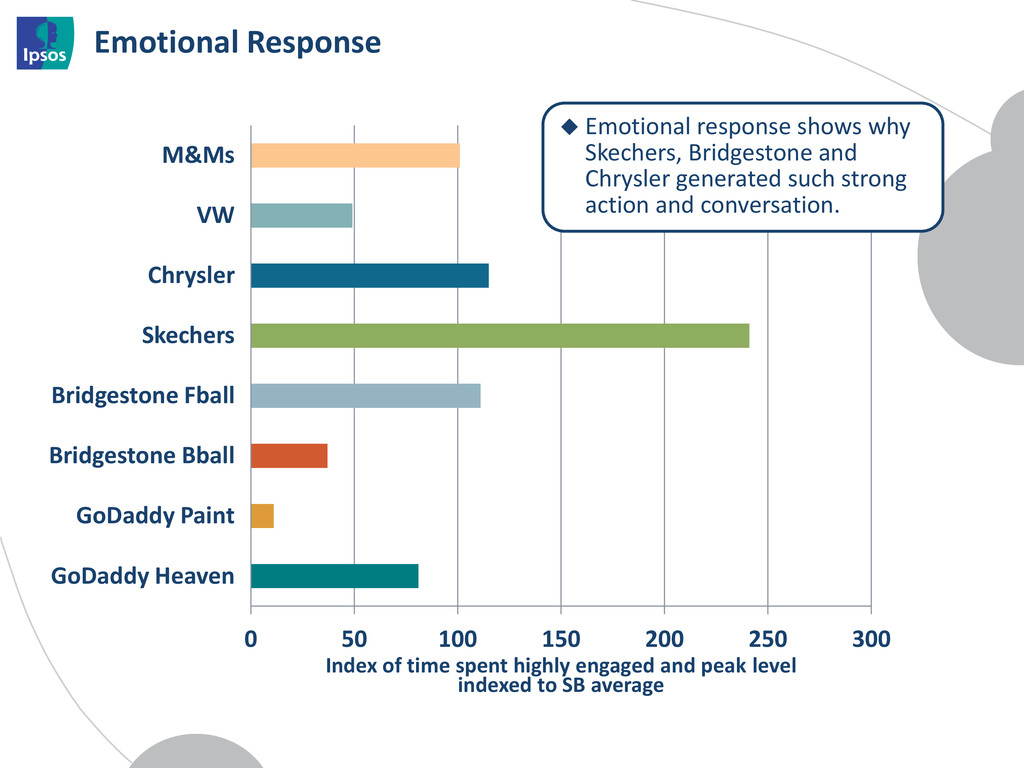
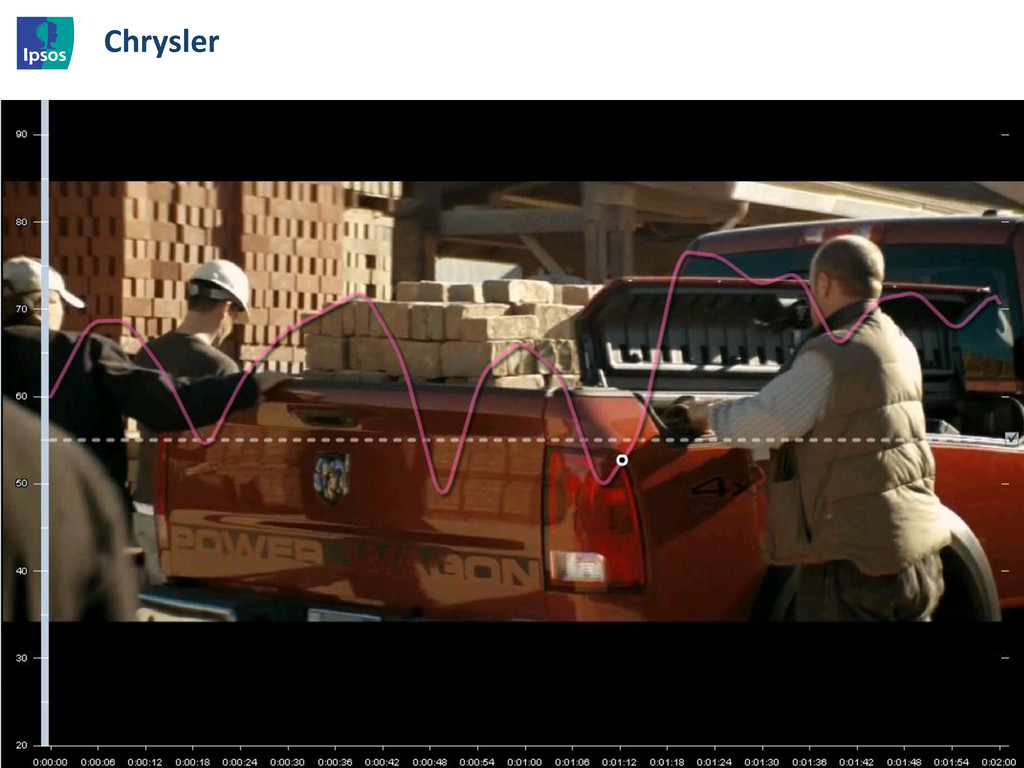
Heaven GoDaddy Paint Bridgestone Bball Bridgestone Fball Skechers Chrysler VW M&Ms Index of time spent highly engaged and peak level indexed to SB average Emotional response shows why Skechers, Bridgestone and Chrysler generated such strong action and conversation.
2011 success and generated huge amounts of anticipation. The ad didn’t pay this off but the social media hype kept the ad top-of-mind and it did have an impact on the brand. Chrysler: No hype but this “anthem” ad showed strong emotional resonance which created a lot of activity and buzz. The ad was as much an auto ad as a Chrysler ad so not as strong an impact on brand as might otherwise be. But strong impact on activity can also benefit brand. Skechers: Not enough hype pre-game to bring this brand to public consciousness but very strong emotional response brought the brand into the discussion. Like Chrysler, the biggest benefit came from buzz and activity. Ad itself not that effective. GoDaddy: Tough to explain this brand. Lots of negative buzz, mixed set of ads which themselves are not effective. Yet it remains in the public spotlight. 64
no longer tightly contained or controlled. We need to look at multiple data sources to understand the whole picture. We can learn as much from observing as we can from asking questions. Conversation, activity monitoring, and passive biometric measurement reveal unique insights. 65
of the Customer to Navigate Success What We Can Learn From the Socialization of Super Bowl Ads: A Lesson in Integration Coffee Break Portland – Why Don’t You Love Us as Much as They Do in Seattle Getting To The ‘Why’ Along the Consumer Decision Journey The Triangulation Journey: Aligning Reputation Levers, Issue Impact and Message Fit Final Thoughts & Closing Remarks 66 Next Up
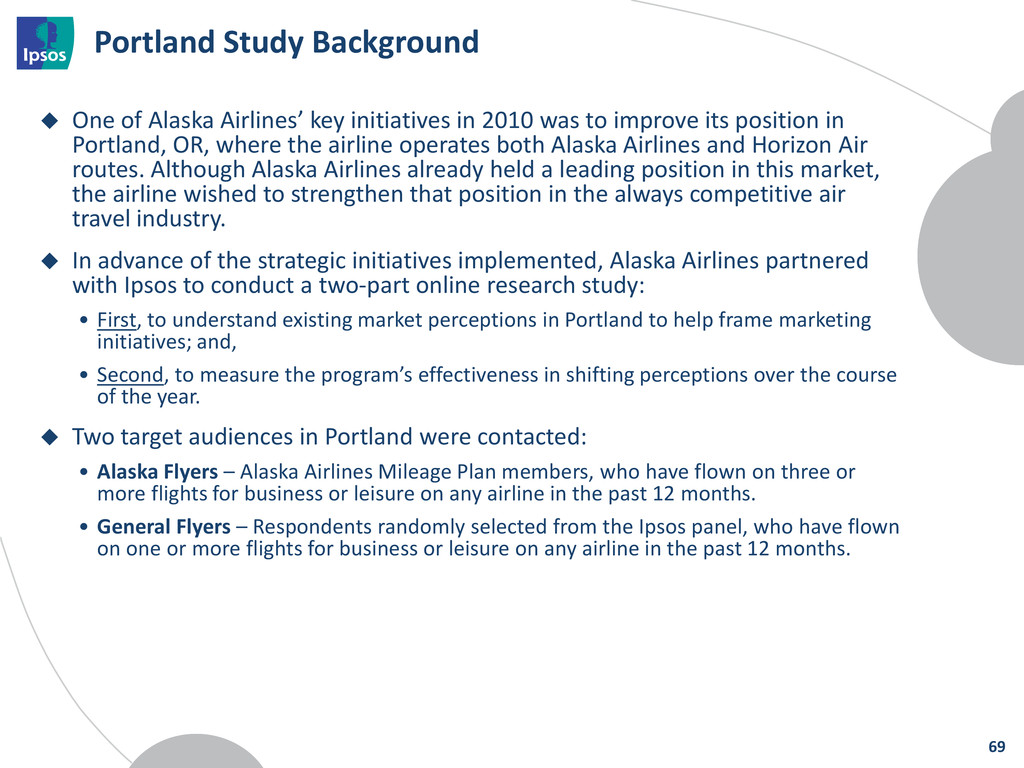
in 2010 was to improve its position in Portland, OR, where the airline operates both Alaska Airlines and Horizon Air routes. Although Alaska Airlines already held a leading position in this market, the airline wished to strengthen that position in the always competitive air travel industry. In advance of the strategic initiatives implemented, Alaska Airlines partnered with Ipsos to conduct a two-part online research study: • First, to understand existing market perceptions in Portland to help frame marketing initiatives; and, • Second, to measure the program’s effectiveness in shifting perceptions over the course of the year. Two target audiences in Portland were contacted: • Alaska Flyers – Alaska Airlines Mileage Plan members, who have flown on three or more flights for business or leisure on any airline in the past 12 months. • General Flyers – Respondents randomly selected from the Ipsos panel, who have flown on one or more flights for business or leisure on any airline in the past 12 months. 69
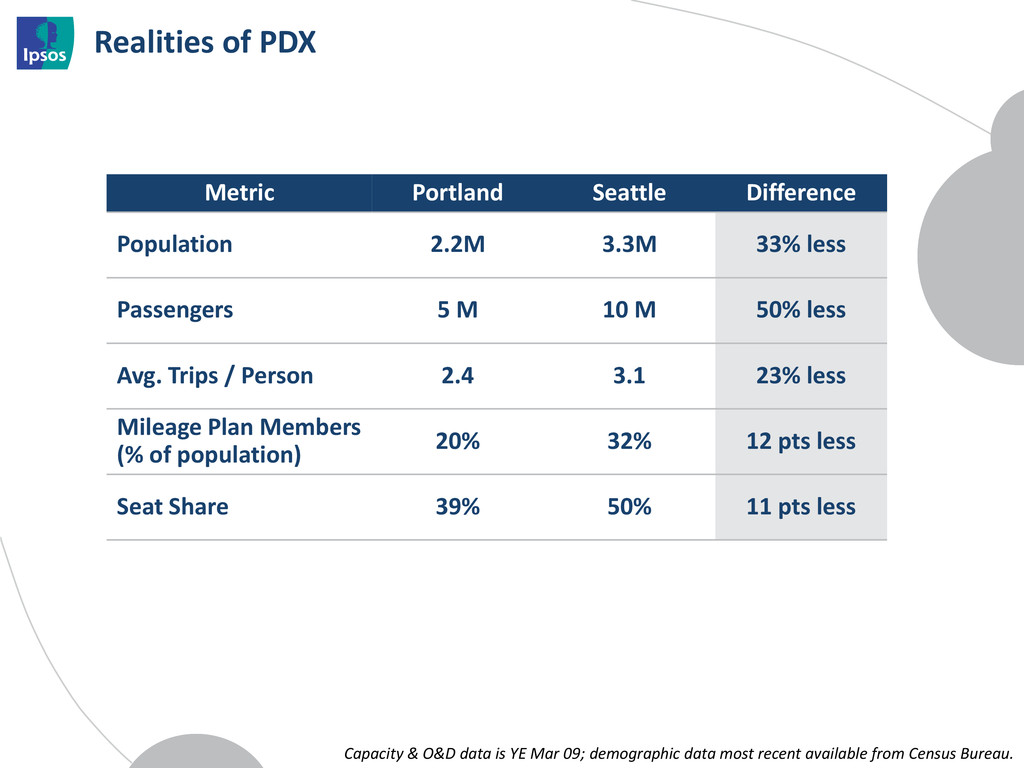
most recent available from Census Bureau. Metric Portland Seattle Difference Population 2.2M 3.3M 33% less Passengers 5 M 10 M 50% less Avg. Trips / Person 2.4 3.1 23% less Mileage Plan Members (% of population) 20% 32% 12 pts less Seat Share 39% 50% 11 pts less Realities of PDX
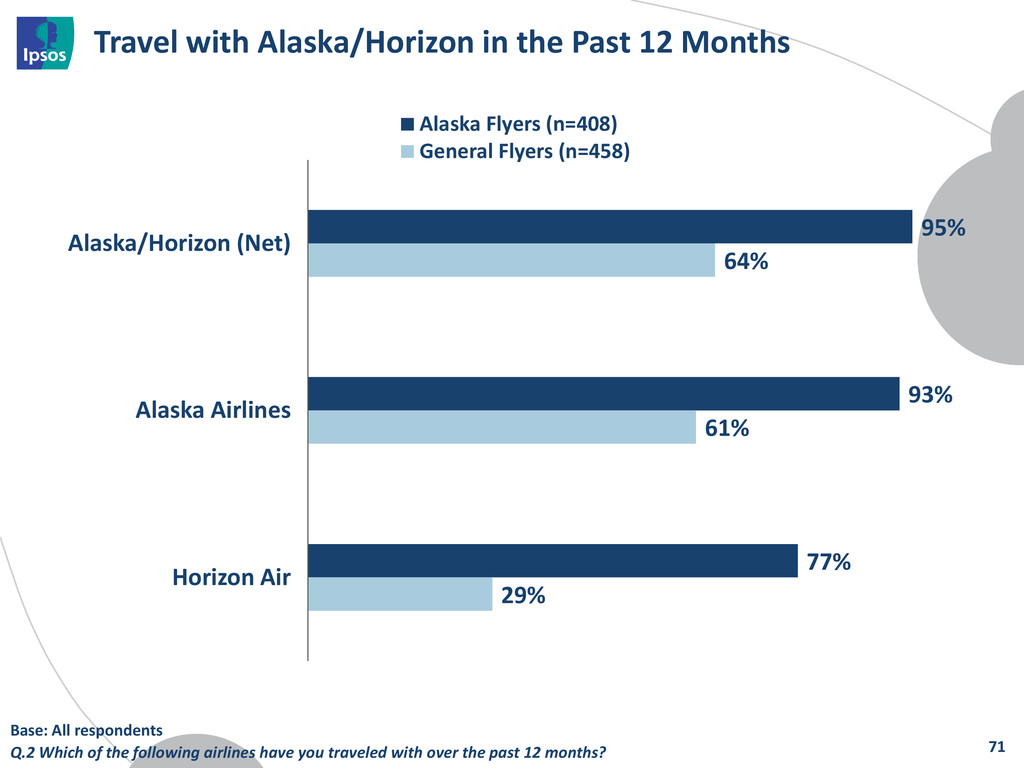
77% 64% 61% 29% Alaska/Horizon (Net) Alaska Airlines Horizon Air Alaska Flyers (n=408) General Flyers (n=458) 71 Base: All respondents Q.2 Which of the following airlines have you traveled with over the past 12 months?
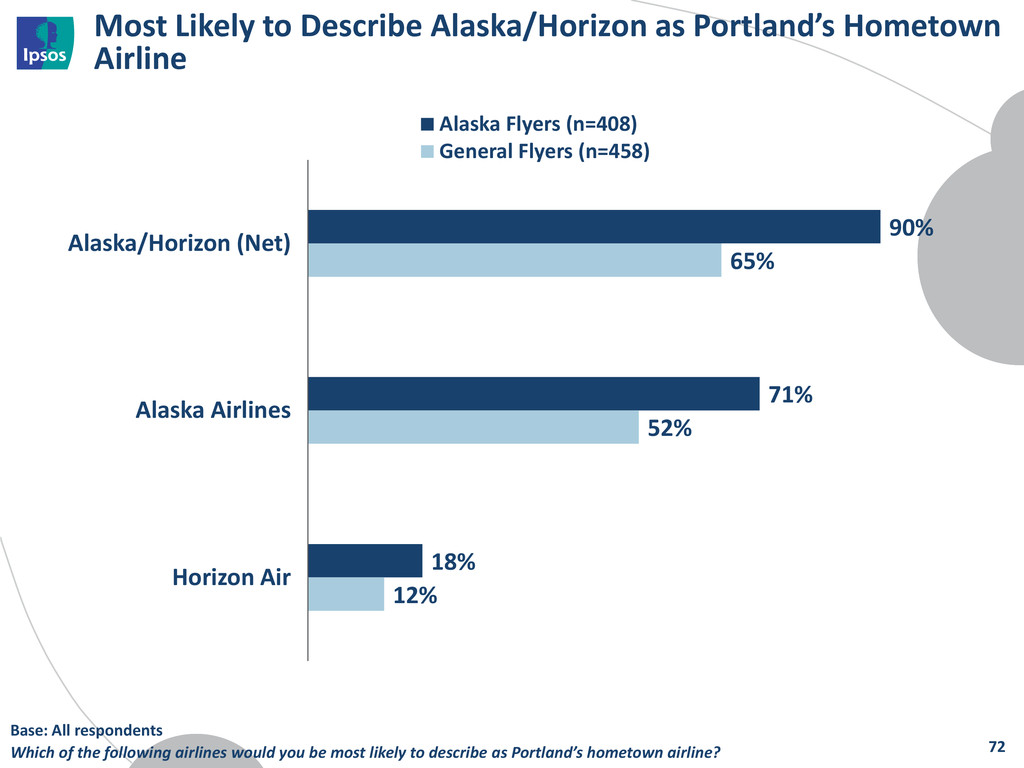
71% 18% 65% 52% 12% Alaska/Horizon (Net) Alaska Airlines Horizon Air Alaska Flyers (n=408) General Flyers (n=458) 72 Base: All respondents Which of the following airlines would you be most likely to describe as Portland’s hometown airline?
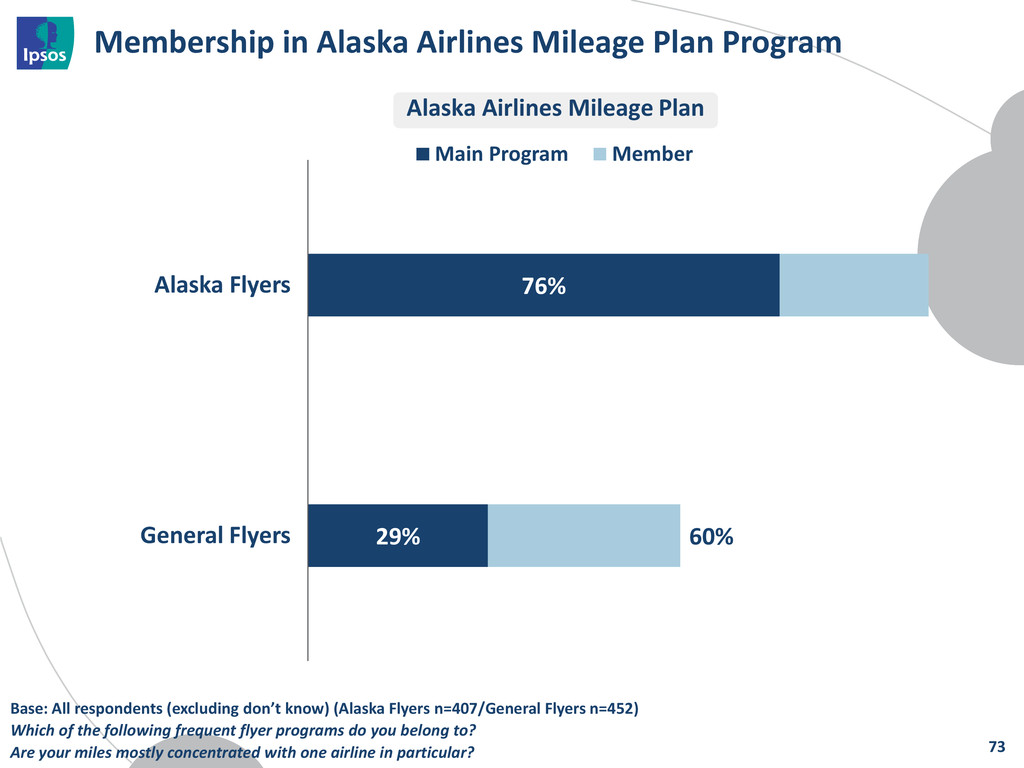
Alaska Flyers General Flyers Main Program Member 73 Alaska Airlines Mileage Plan Base: All respondents (excluding don’t know) (Alaska Flyers n=407/General Flyers n=452) Which of the following frequent flyer programs do you belong to? Are your miles mostly concentrated with one airline in particular?
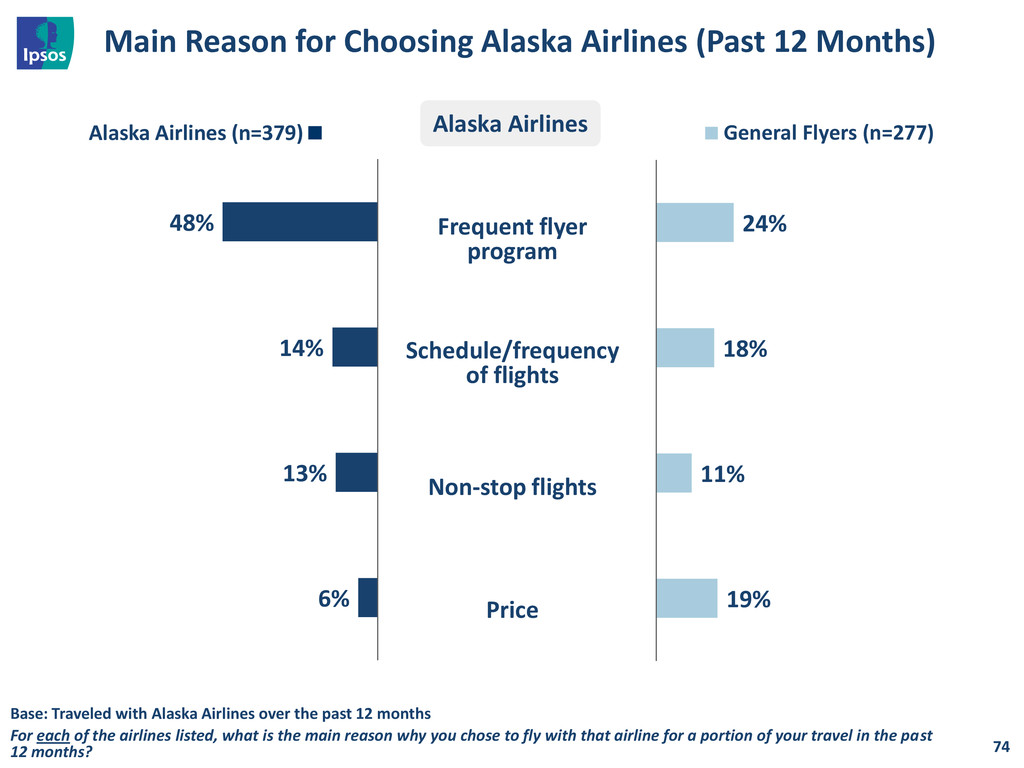
(Past 12 Months) 74 Frequent flyer program Schedule/frequency of flights Non-stop flights Price Base: Traveled with Alaska Airlines over the past 12 months For each of the airlines listed, what is the main reason why you chose to fly with that airline for a portion of your travel in the past 12 months? Alaska Airlines Alaska Airlines (n=379) 24% 18% 11% 19% General Flyers (n=277)
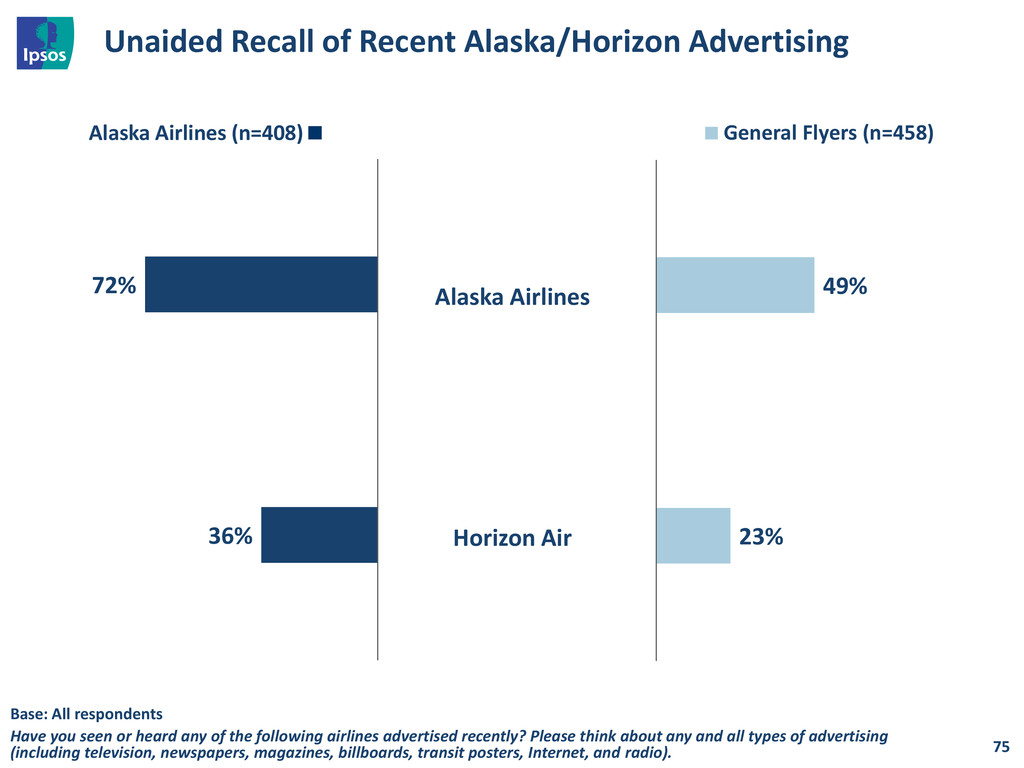
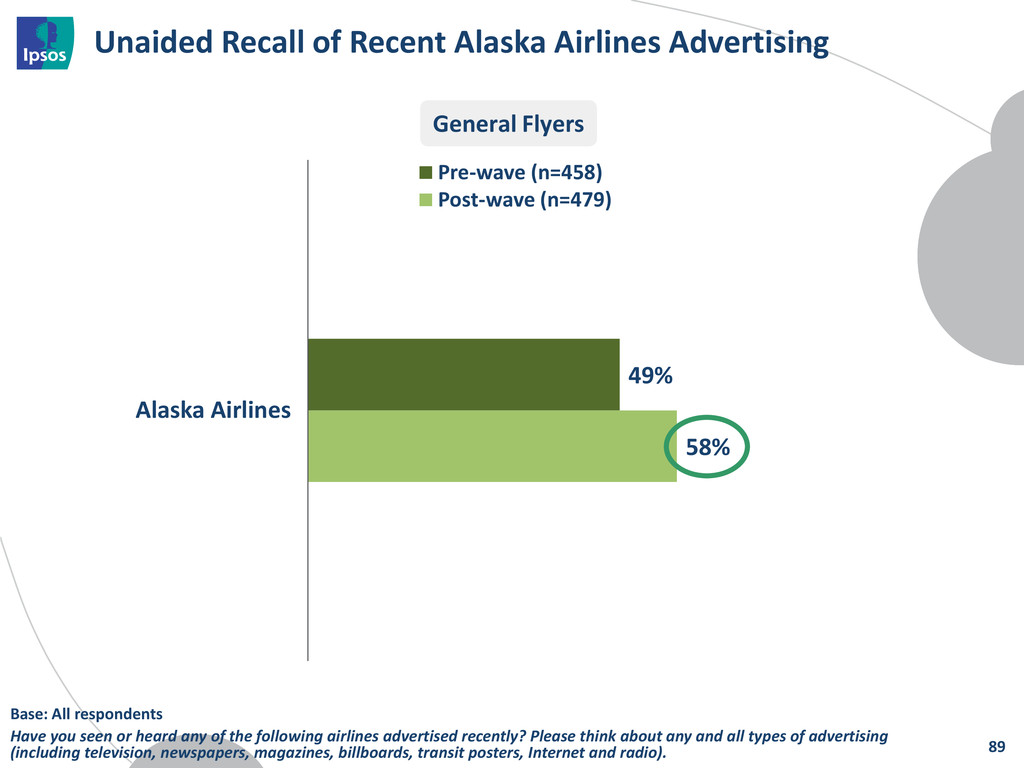
Airlines Horizon Air Alaska Airlines (n=408) 49% 23% General Flyers (n=458) Base: All respondents Have you seen or heard any of the following airlines advertised recently? Please think about any and all types of advertising (including television, newspapers, magazines, billboards, transit posters, Internet, and radio).
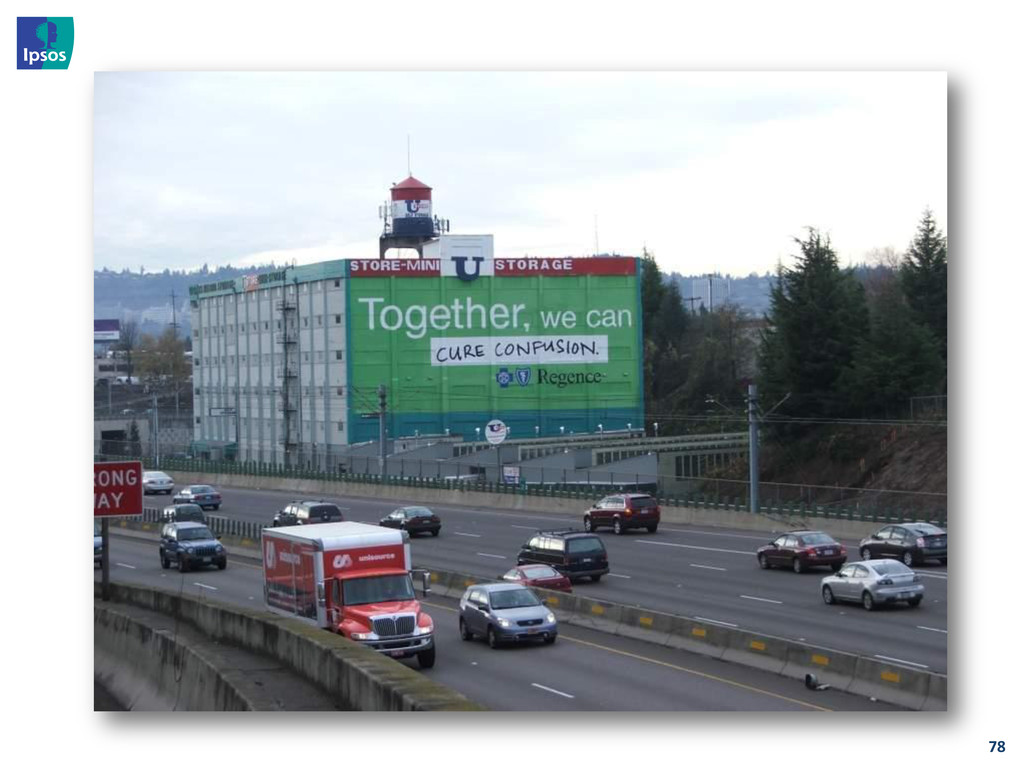
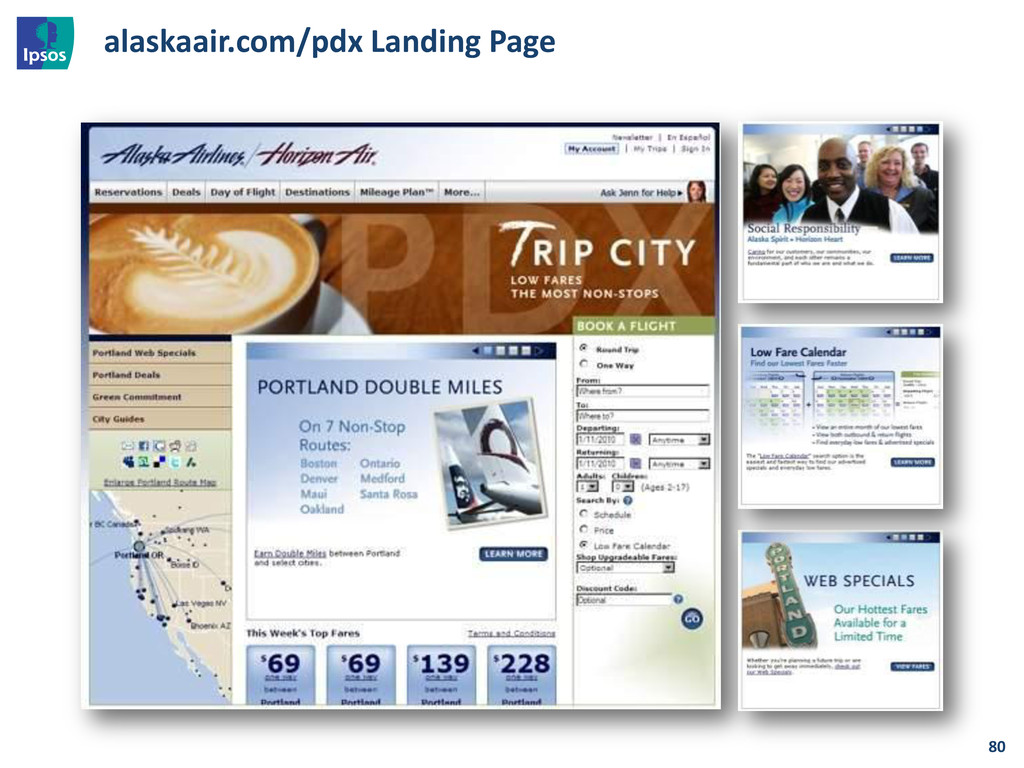
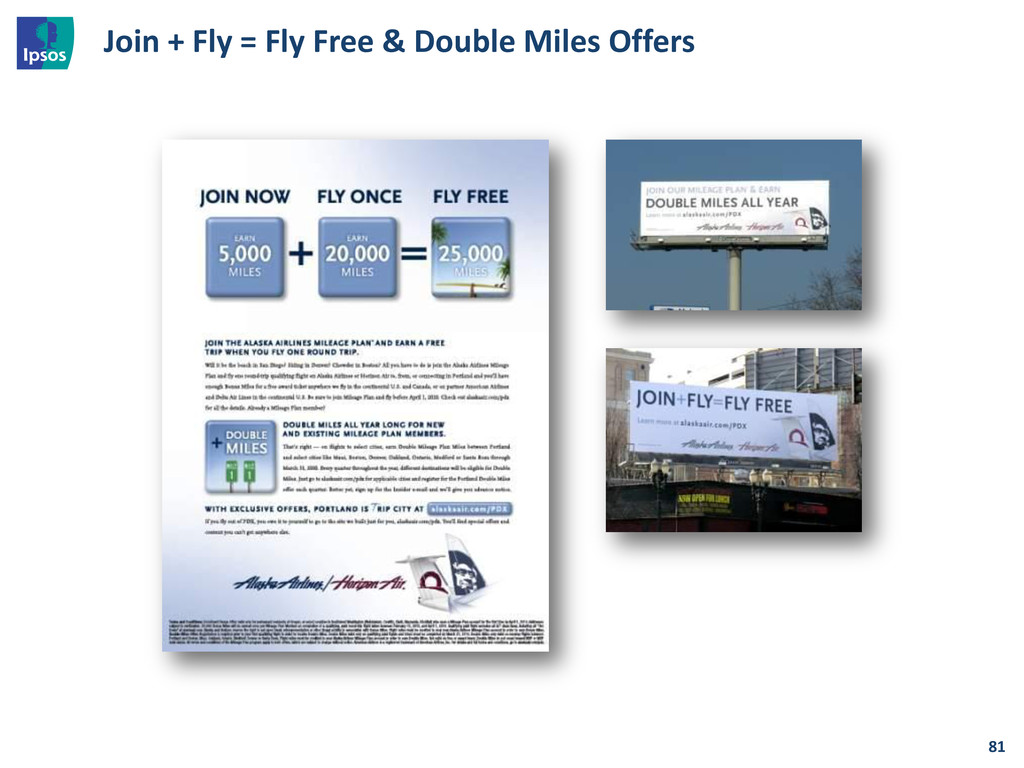
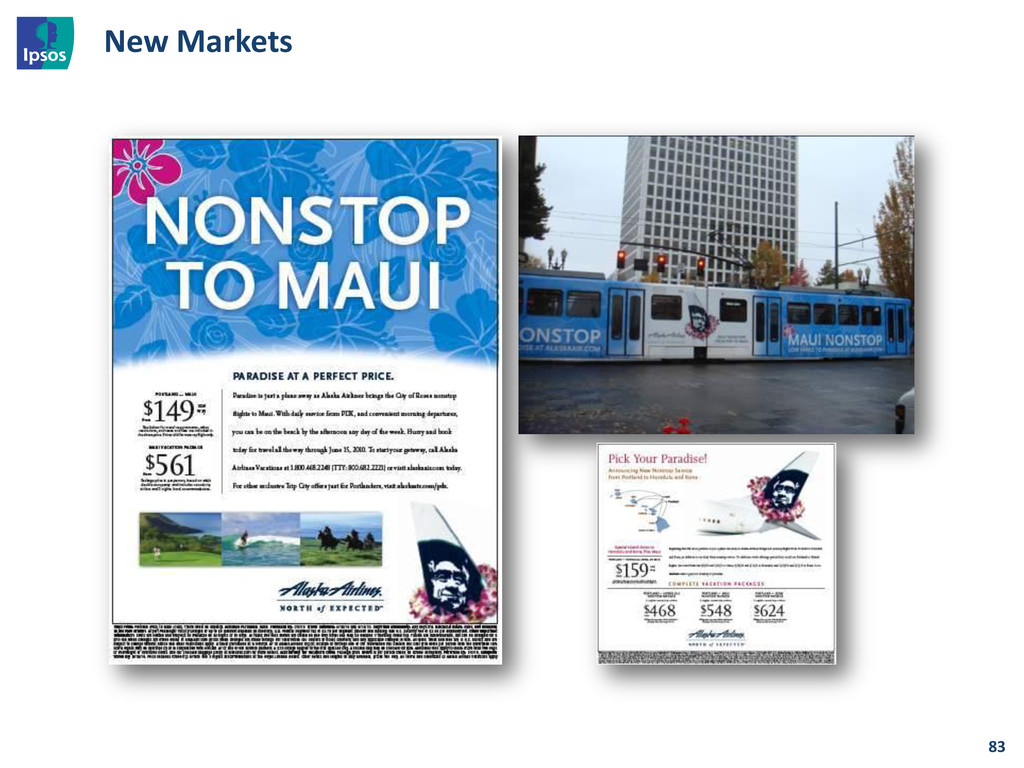
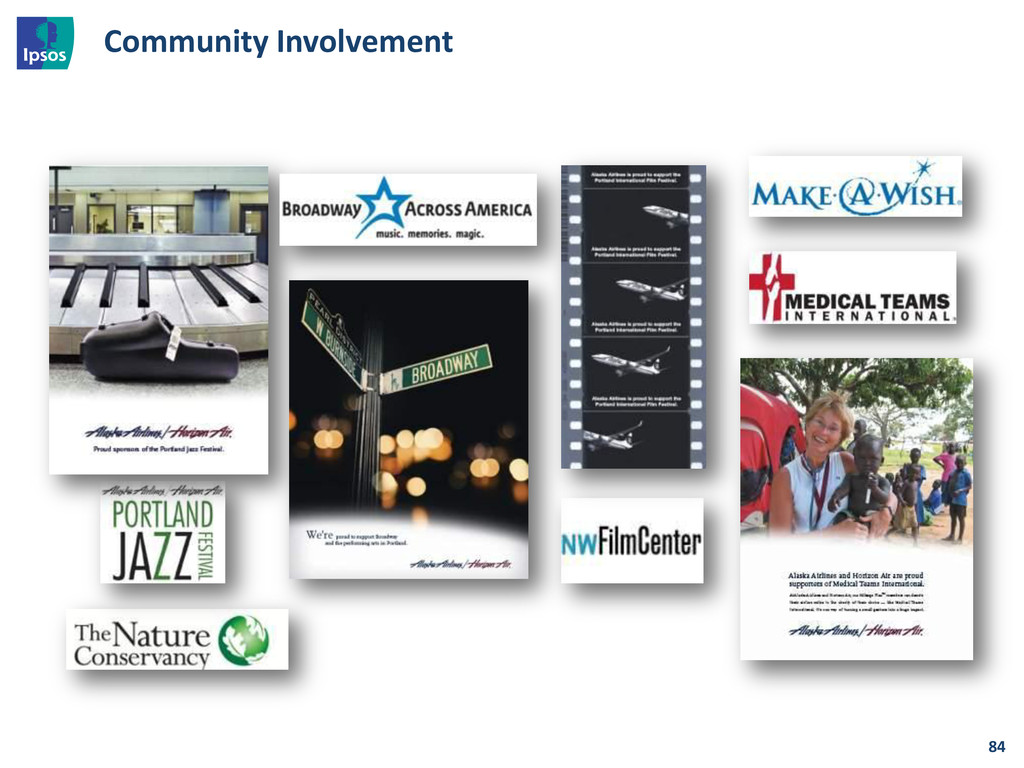
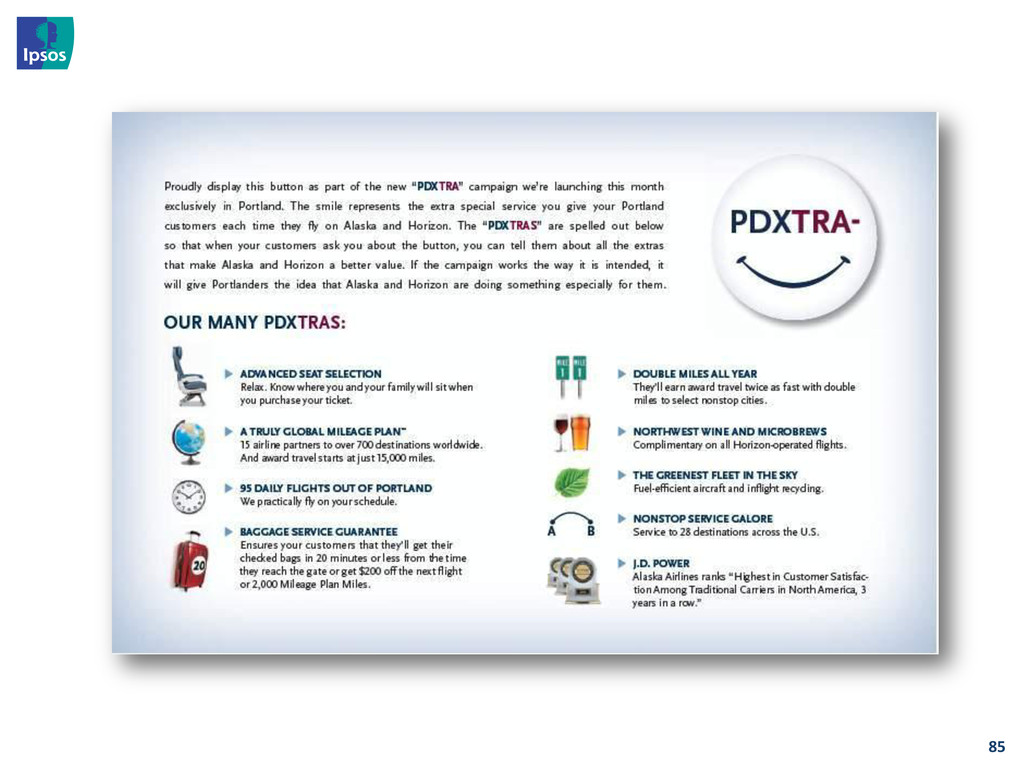
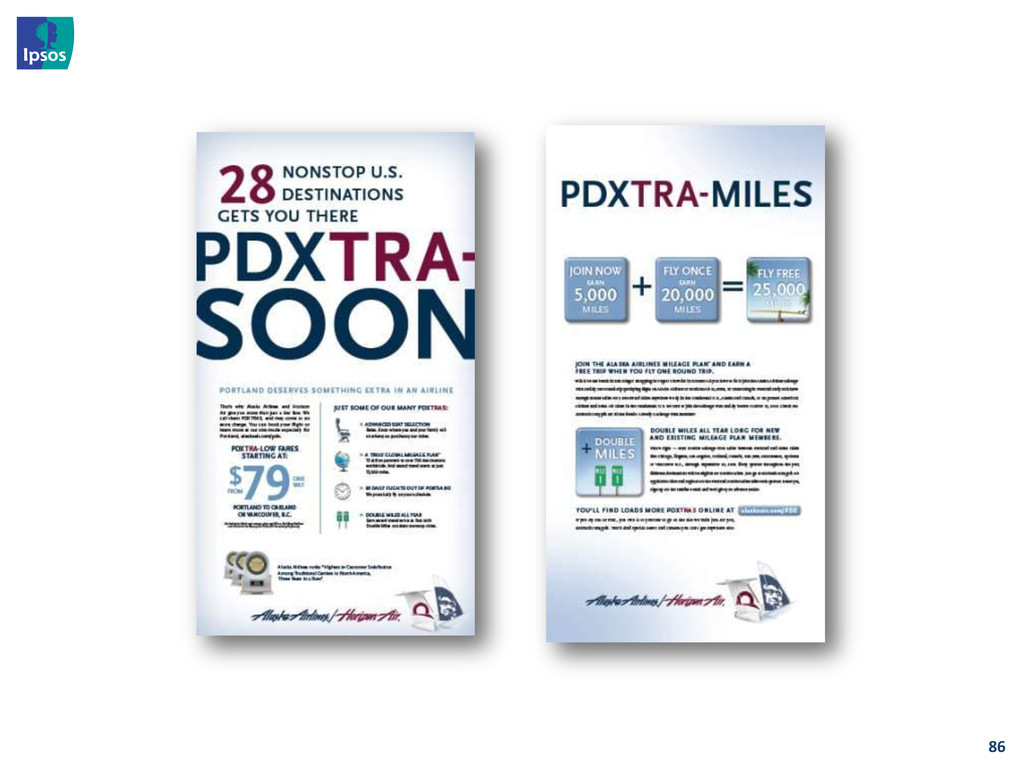
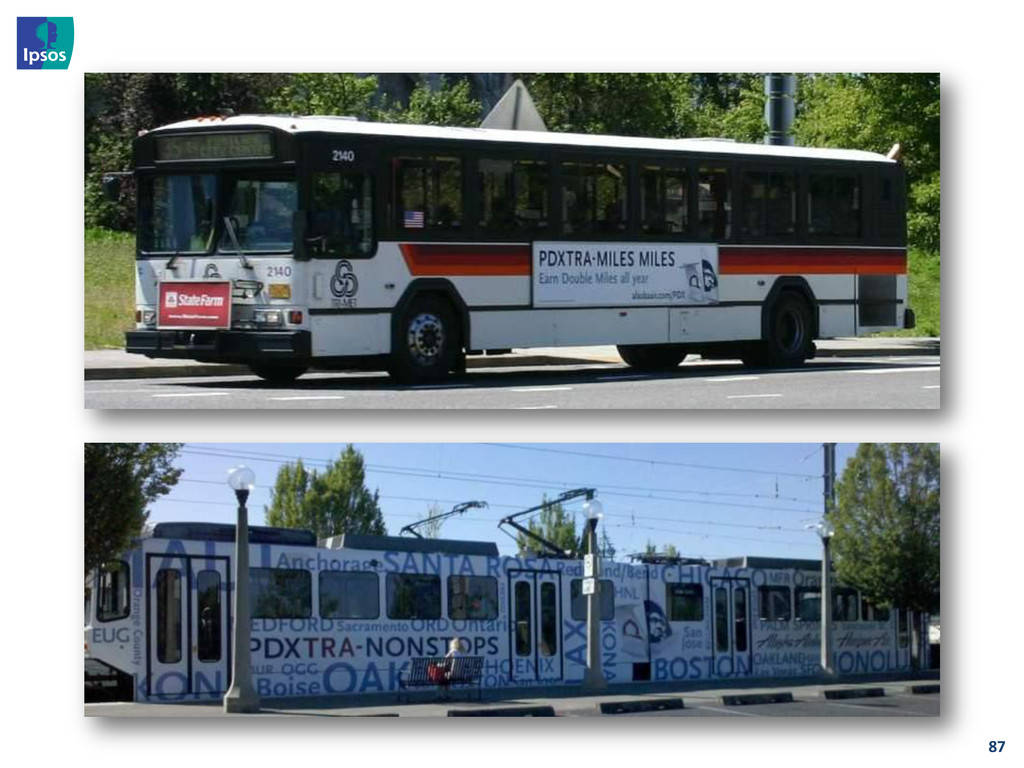
airport call letters (PDX). The key objectives of the PDXTRA campaign designed for Portland include: • To motivate Portland residents to register with the Mileage Plan program and to trial flying with Alaska Airlines/Horizon Air. • To communicate that the airline is focused on Portland as a key hub for its routes. • To communicate the new routes that Alaska Airlines will service from Portland. The campaign was concentrated in the following media: • Community involvement • Internet • Outdoor advertising • Transit advertising 77
Airlines Pre-wave (n=458) Post-wave (n=479) 89 Base: All respondents Have you seen or heard any of the following airlines advertised recently? Please think about any and all types of advertising (including television, newspapers, magazines, billboards, transit posters, Internet and radio). General Flyers
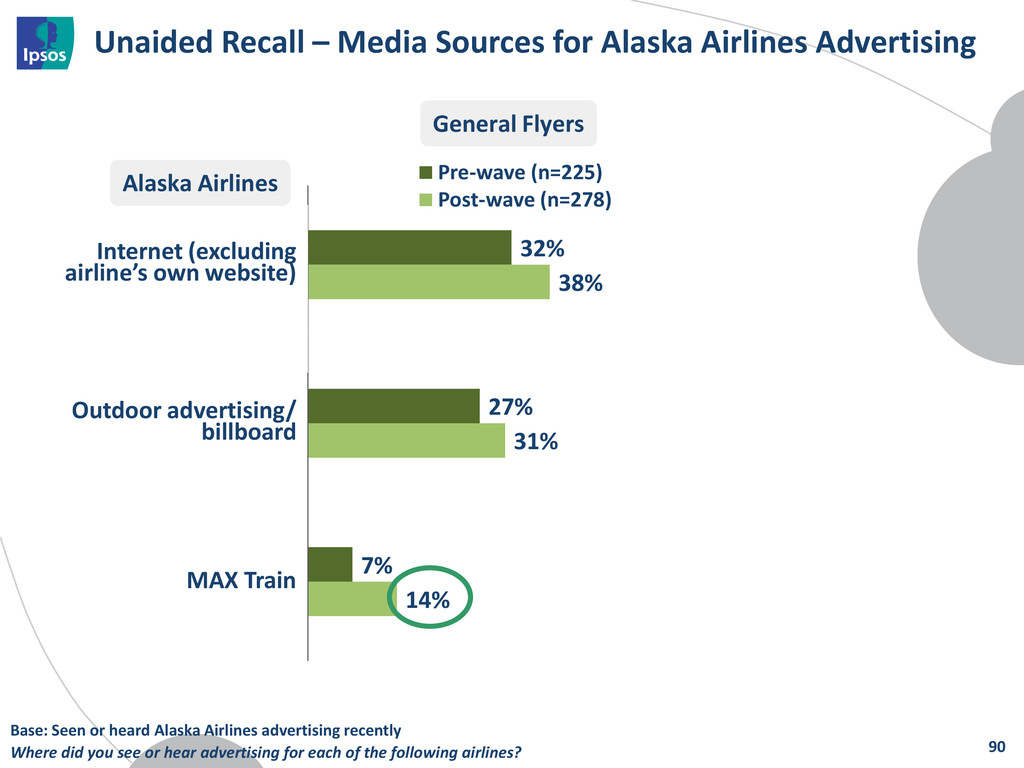
27% 7% 38% 31% 14% Pre-wave (n=225) Post-wave (n=278) 90 General Flyers Base: Seen or heard Alaska Airlines advertising recently Where did you see or hear advertising for each of the following airlines? Internet (excluding airline’s own website) Outdoor advertising/ billboard MAX Train Alaska Airlines
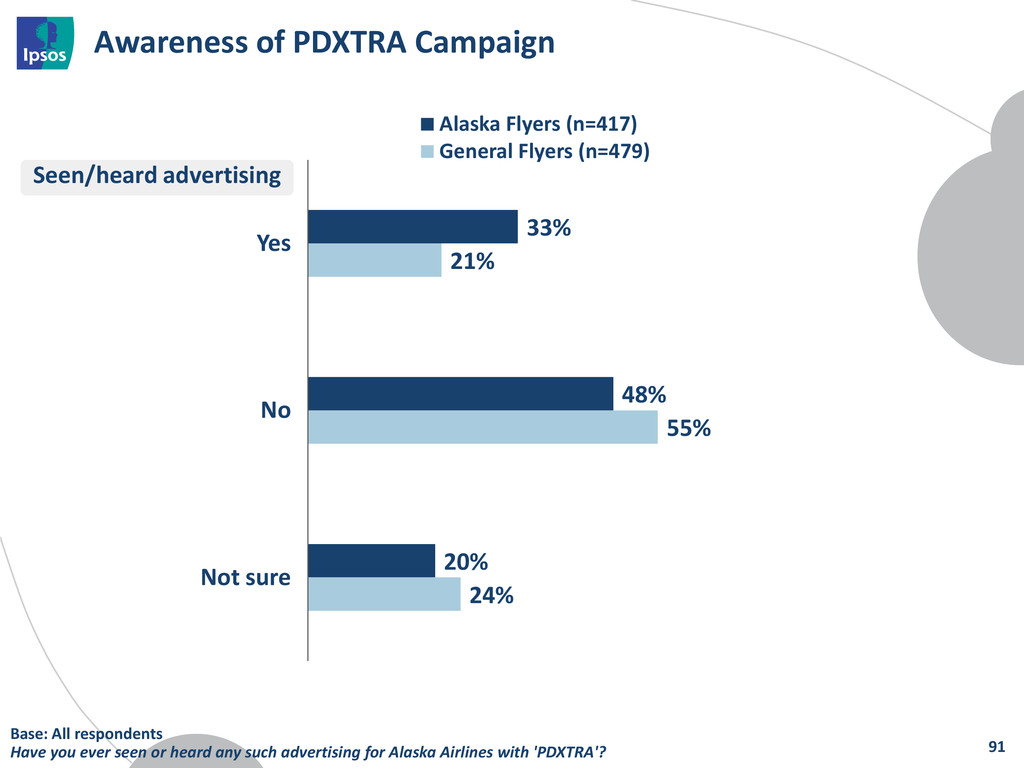
Yes No Not sure Alaska Flyers (n=417) General Flyers (n=479) 91 Base: All respondents Have you ever seen or heard any such advertising for Alaska Airlines with 'PDXTRA'? Seen/heard advertising
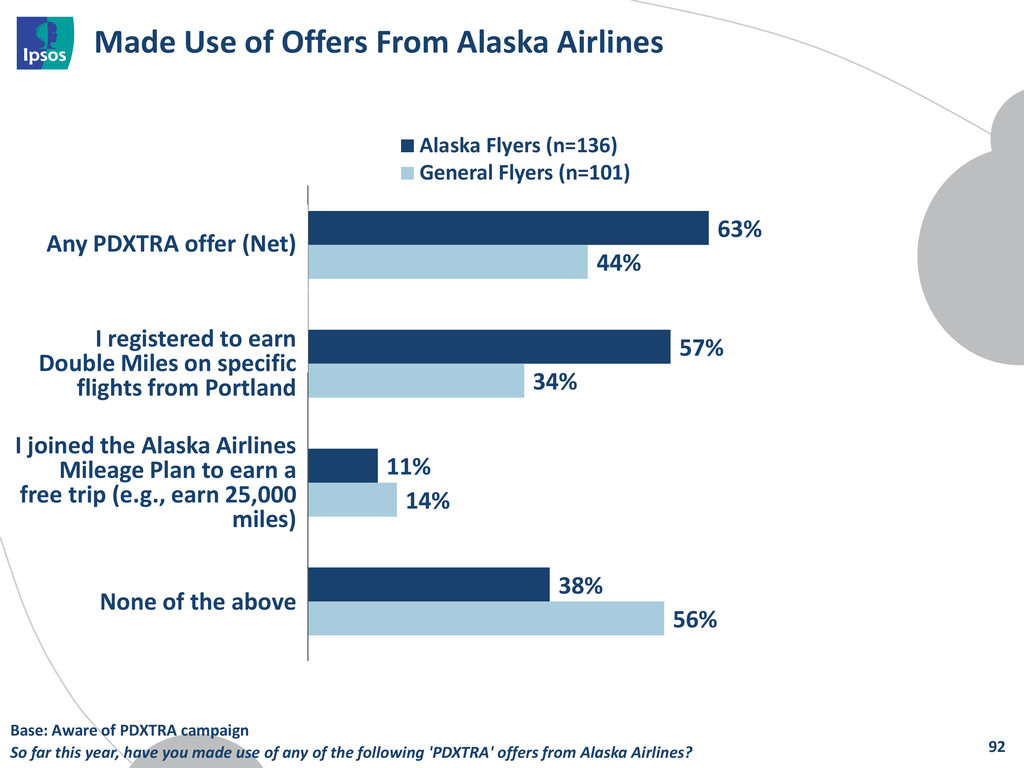
38% 44% 34% 14% 56% Alaska Flyers (n=136) General Flyers (n=101) 92 Any PDXTRA offer (Net) I registered to earn Double Miles on specific flights from Portland I joined the Alaska Airlines Mileage Plan to earn a free trip (e.g., earn 25,000 miles) None of the above Base: Aware of PDXTRA campaign So far this year, have you made use of any of the following 'PDXTRA' offers from Alaska Airlines?
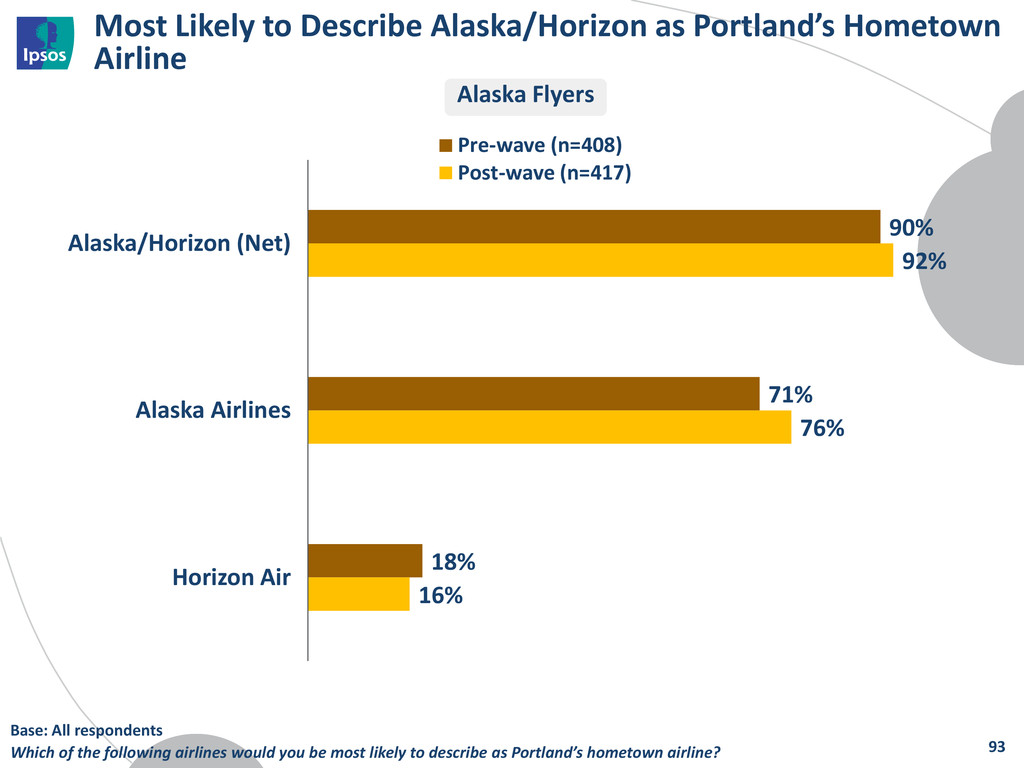
71% 18% 92% 76% 16% Alaska/Horizon (Net) Alaska Airlines Horizon Air Pre-wave (n=408) Post-wave (n=417) 93 Alaska Flyers Base: All respondents Which of the following airlines would you be most likely to describe as Portland’s hometown airline?
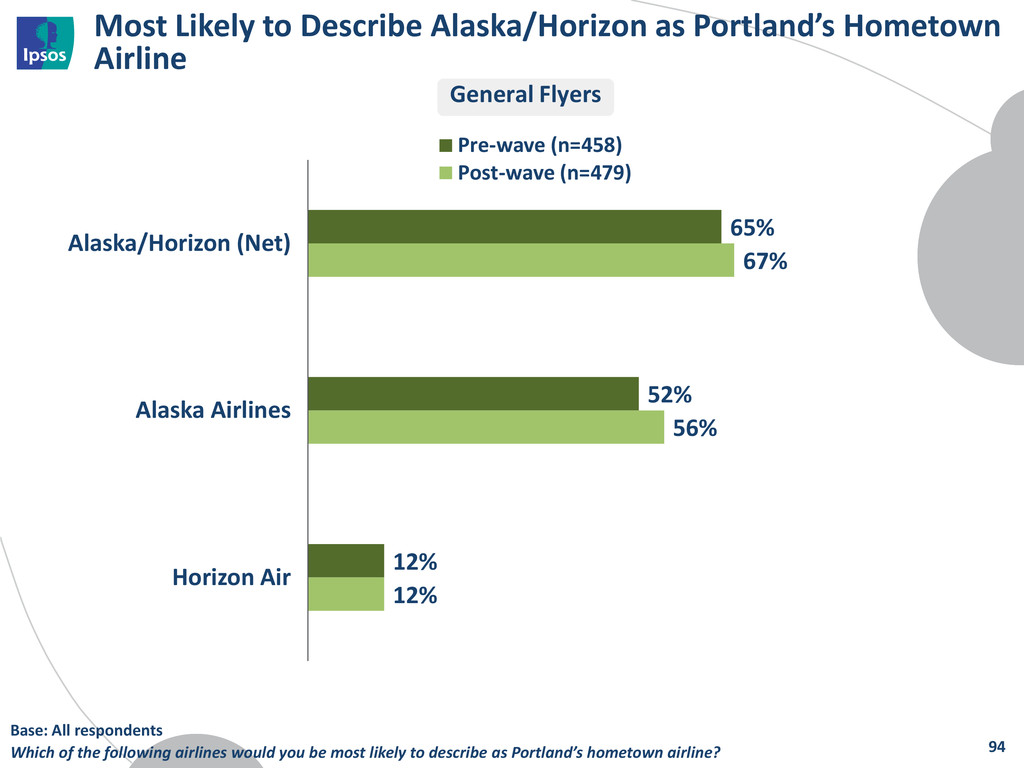
52% 12% 67% 56% 12% Alaska/Horizon (Net) Alaska Airlines Horizon Air Pre-wave (n=458) Post-wave (n=479) 94 General Flyers Base: All respondents Which of the following airlines would you be most likely to describe as Portland’s hometown airline?
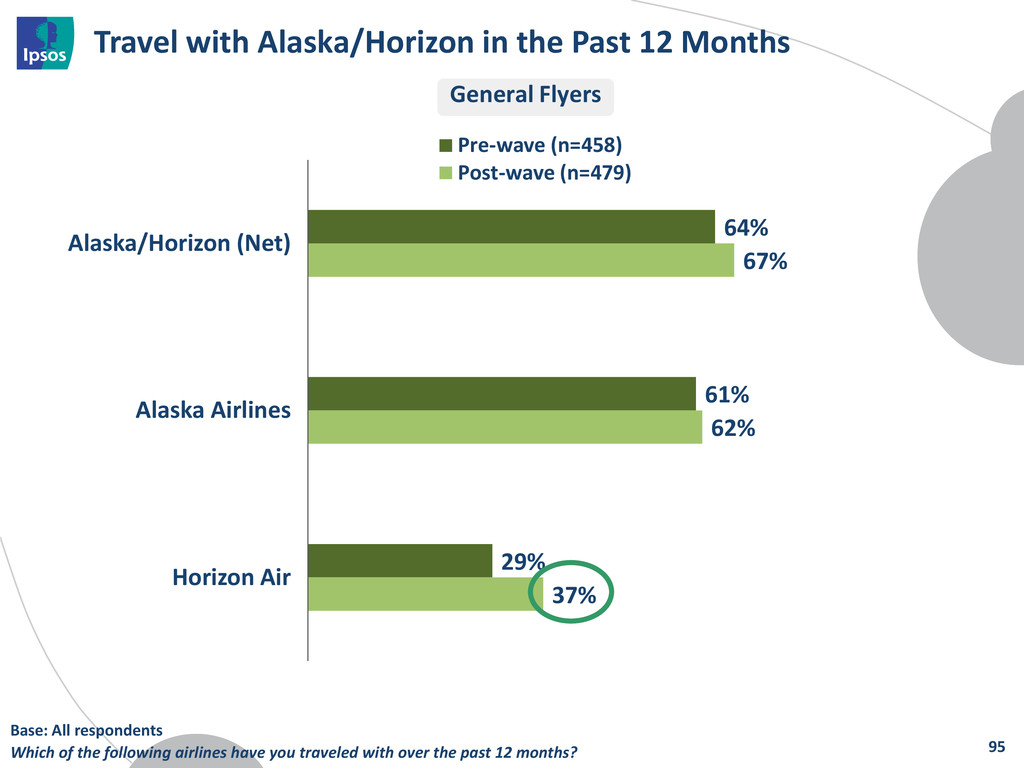
29% 67% 62% 37% Alaska/Horizon (Net) Alaska Airlines Horizon Air Pre-wave (n=458) Post-wave (n=479) 95 General Flyers Base: All respondents Which of the following airlines have you traveled with over the past 12 months?
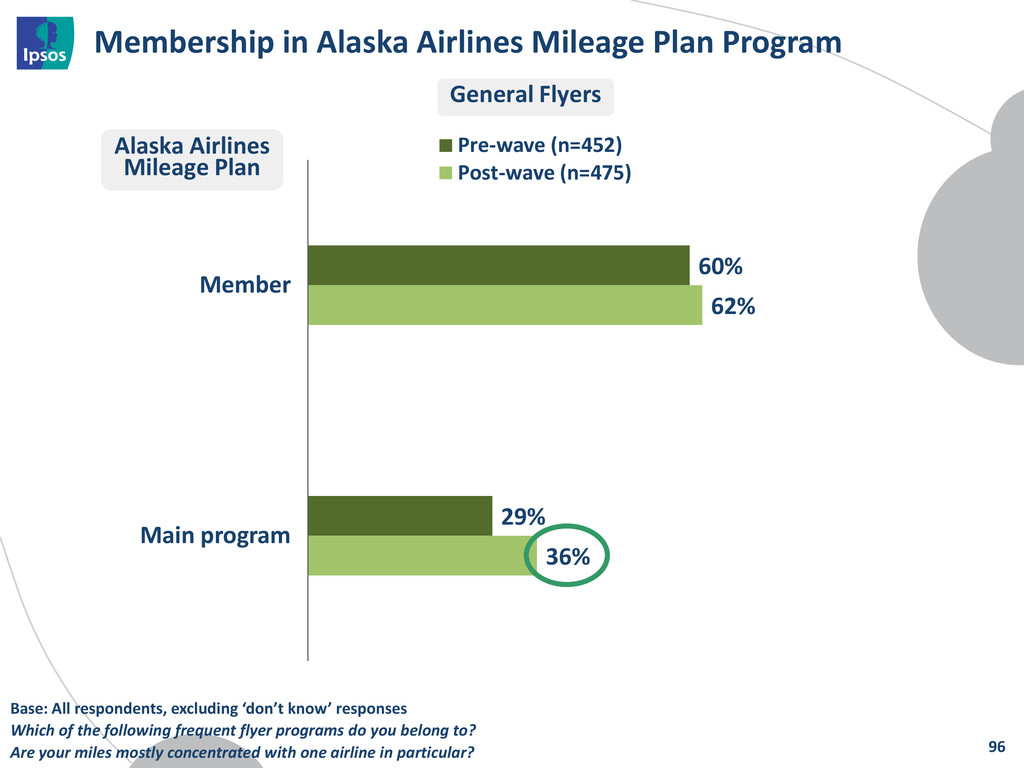
36% Member Main program Pre-wave (n=452) Post-wave (n=475) 96 General Flyers Base: All respondents, excluding ‘don’t know’ responses Which of the following frequent flyer programs do you belong to? Are your miles mostly concentrated with one airline in particular? Alaska Airlines Mileage Plan
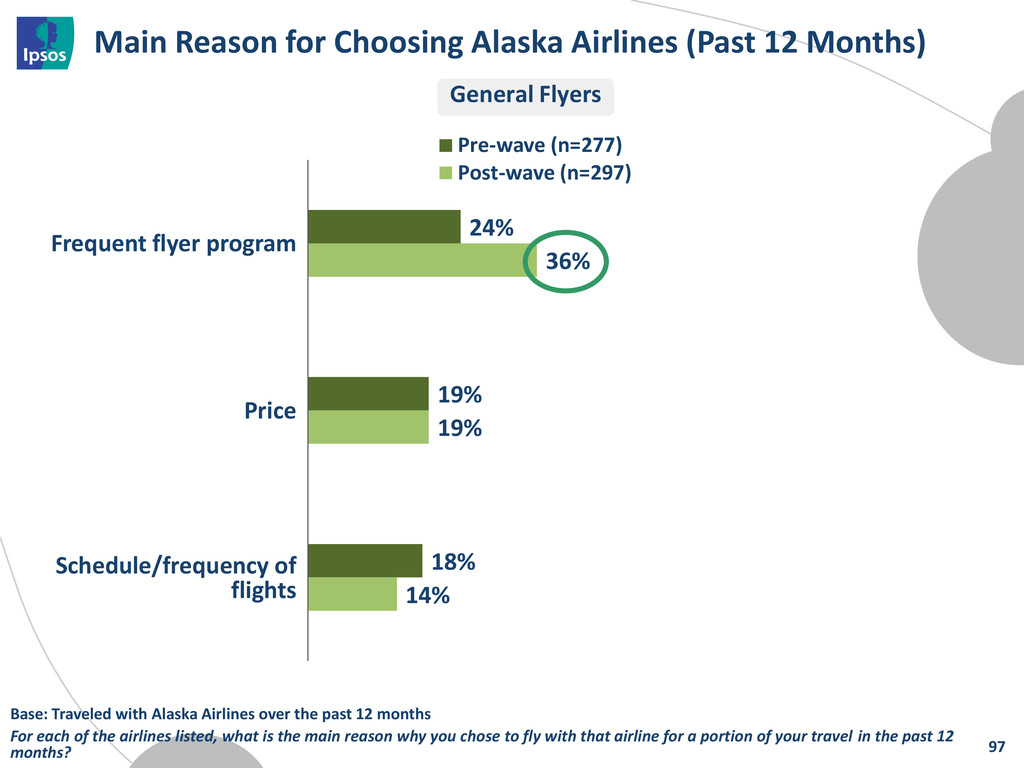
19% 18% 36% 19% 14% Pre-wave (n=277) Post-wave (n=297) 97 General Flyers Base: Traveled with Alaska Airlines over the past 12 months For each of the airlines listed, what is the main reason why you chose to fly with that airline for a portion of your travel in the past 12 months? Frequent flyer program Price Schedule/frequency of flights
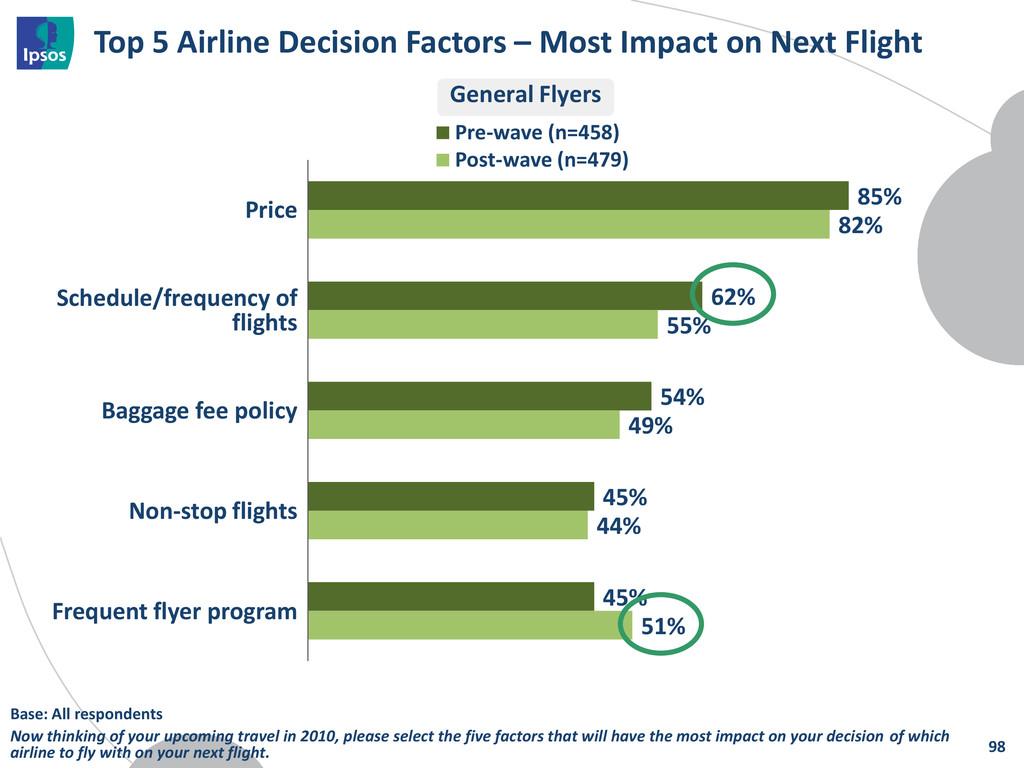
Flight 85% 62% 54% 45% 45% 82% 55% 49% 44% 51% Pre-wave (n=458) Post-wave (n=479) 98 General Flyers Base: All respondents Now thinking of your upcoming travel in 2010, please select the five factors that will have the most impact on your decision of which airline to fly with on your next flight. Price Schedule/frequency of flights Baggage fee policy Non-stop flights Frequent flyer program
of the Customer to Navigate Success What We Can Learn From the Socialization of Super Bowl Ads: A Lesson in Integration Coffee Break Portland – Why Don’t You Love Us as Much as They Do in Seattle Getting To The ‘Why’ Along the Consumer Decision Journey The Triangulation Journey: Aligning Reputation Levers, Issue Impact and Message Fit Final Thoughts & Closing Remarks 102 Next Up
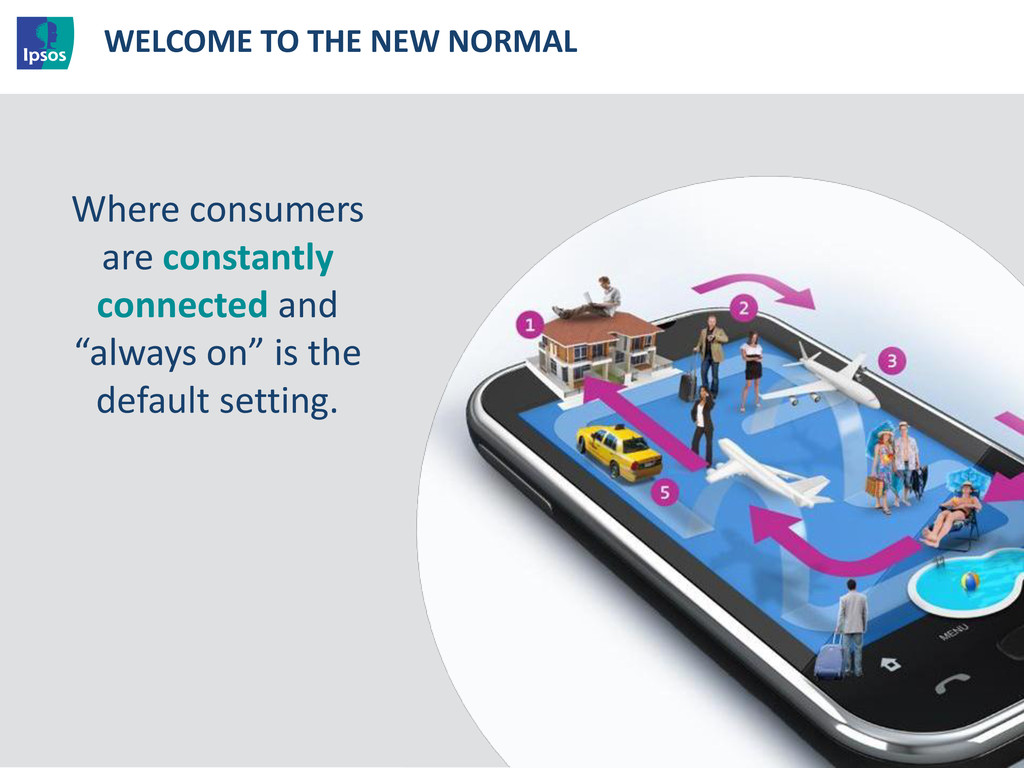
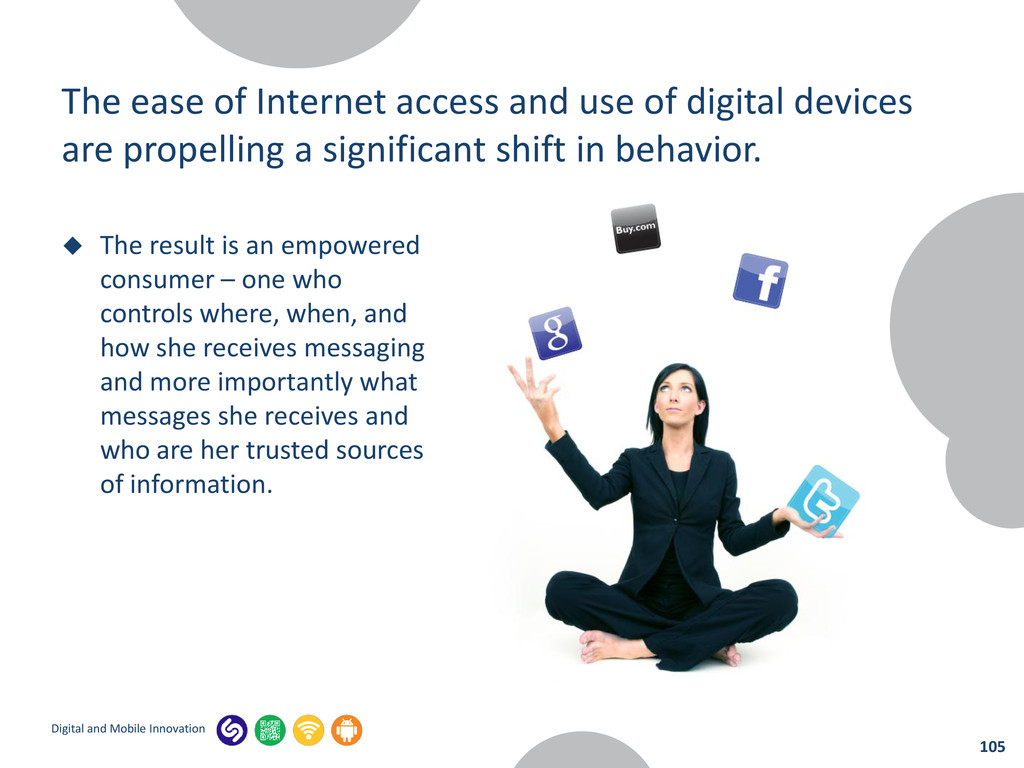
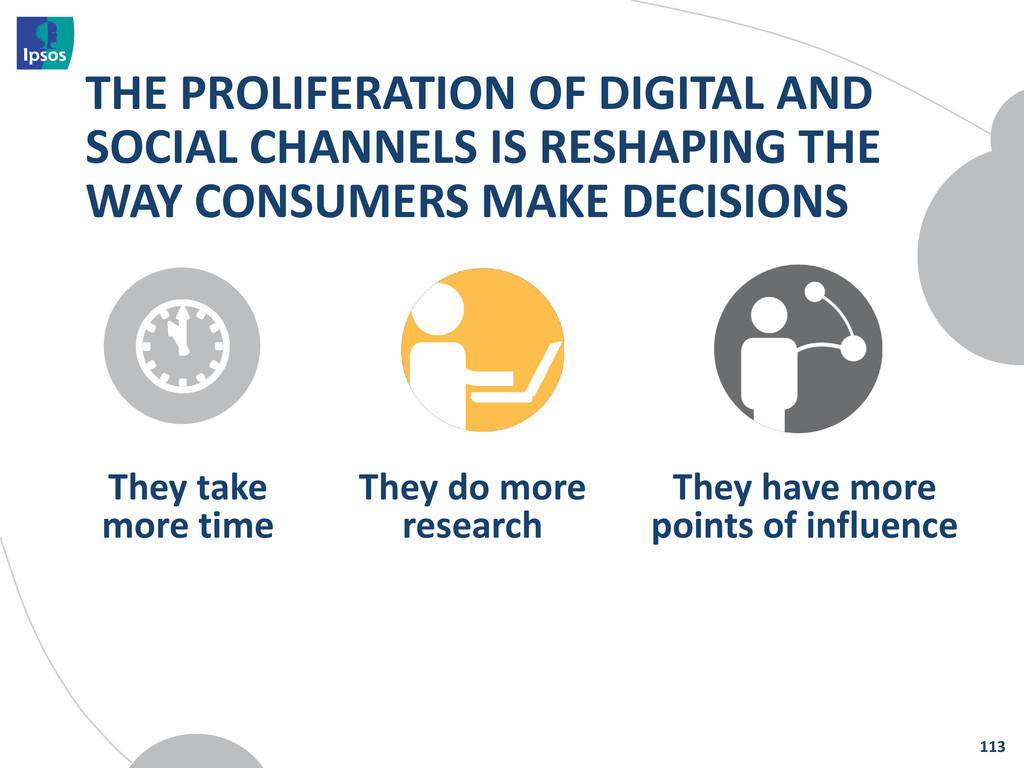
use of digital devices are propelling a significant shift in behavior. The result is an empowered consumer – one who controls where, when, and how she receives messaging and more importantly what messages she receives and who are her trusted sources of information. 105
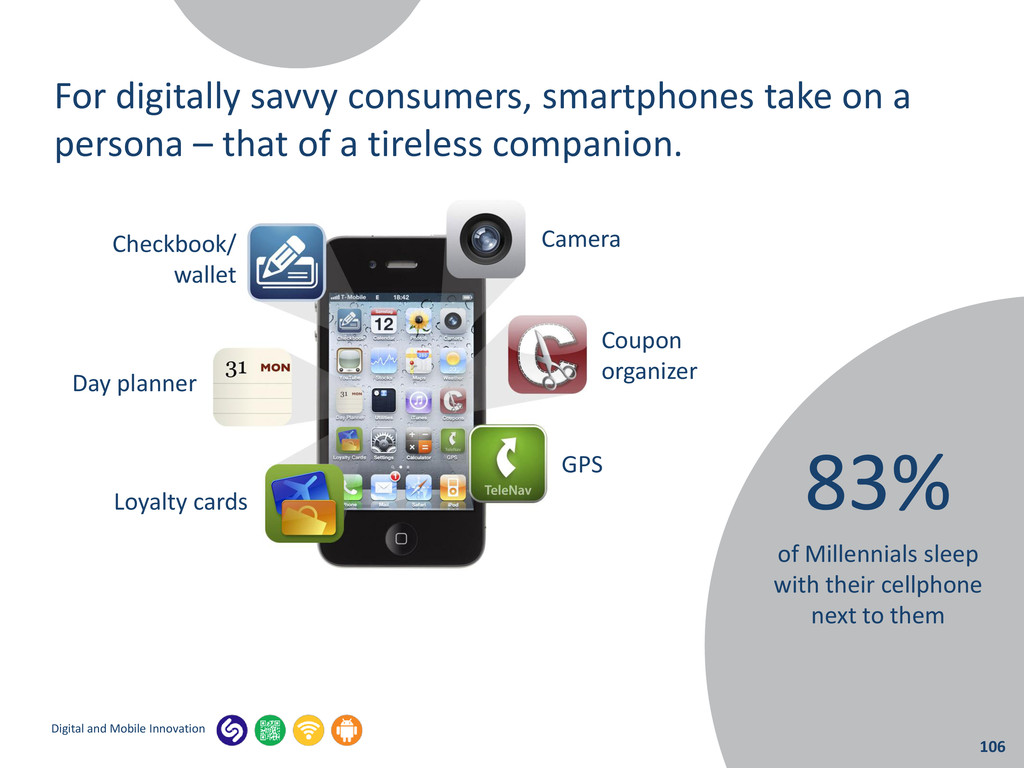
on a persona – that of a tireless companion. 83% of Millennials sleep with their cellphone next to them Camera Coupon organizer GPS Checkbook/ wallet Day planner Loyalty cards 106
in 2011. Estimates vary widely about future growth. Top Purchases Made on a Smartphone 48% Entertainment Items 45% Electronics 45% Clothing or Apparel 26% Beauty & Cosmetic Items 108
media has made connecting with the consumer in a meaningful way more difficult. Smartphones, however, tend to be one constant and even are used while consuming other media. 111
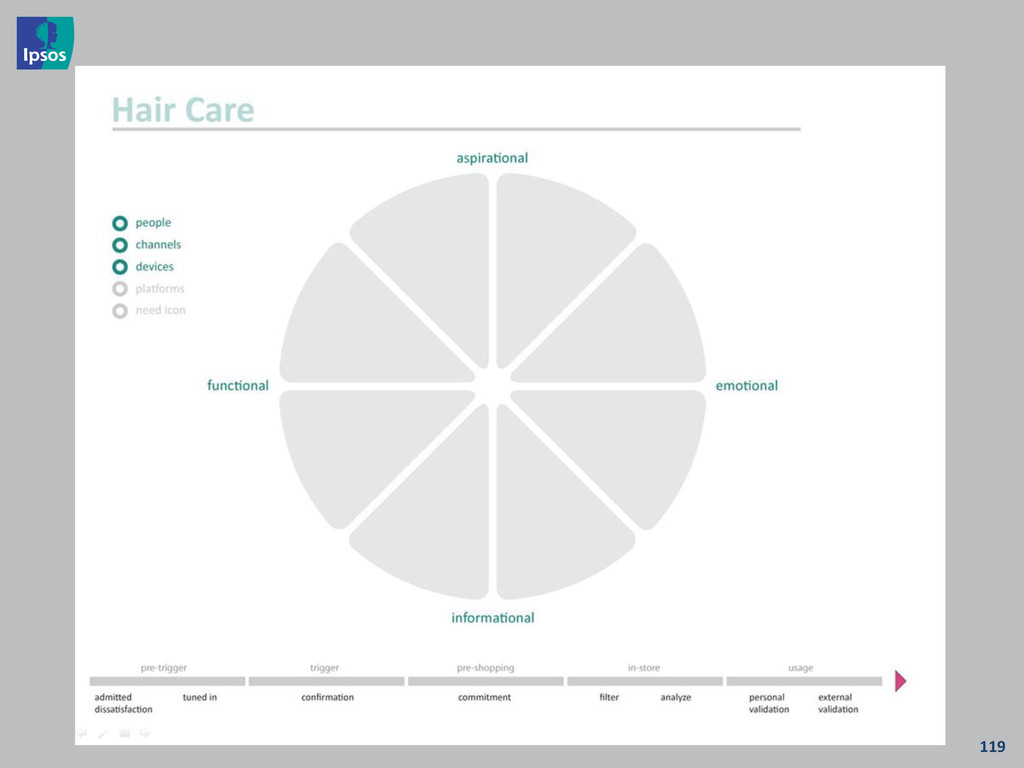
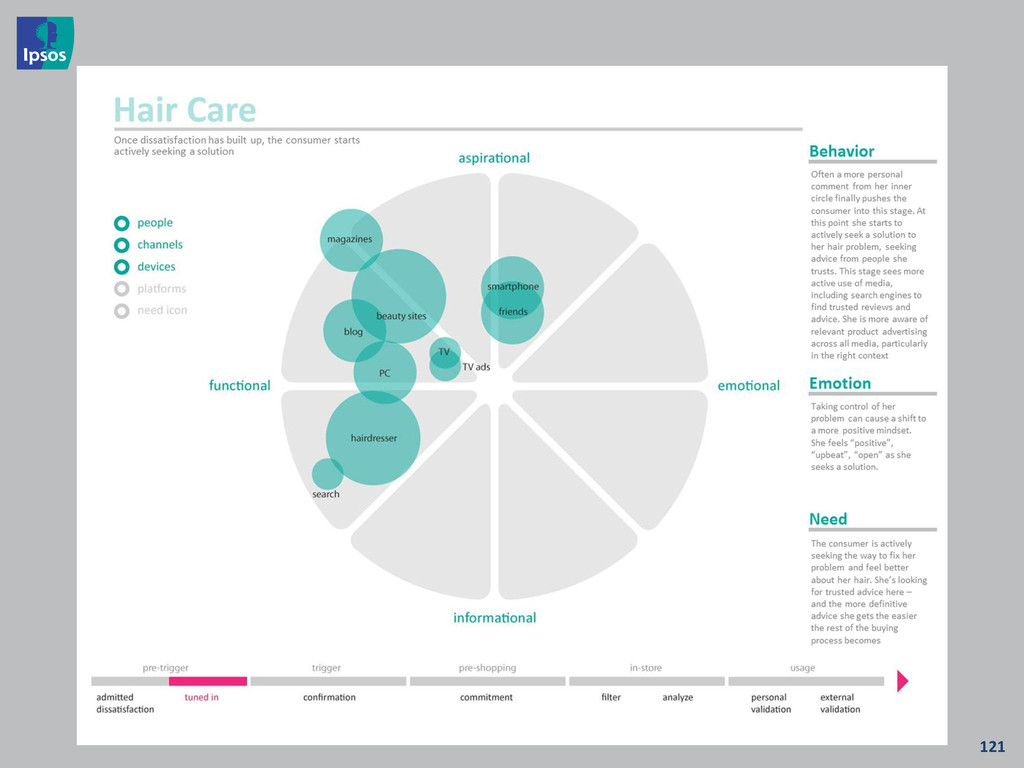
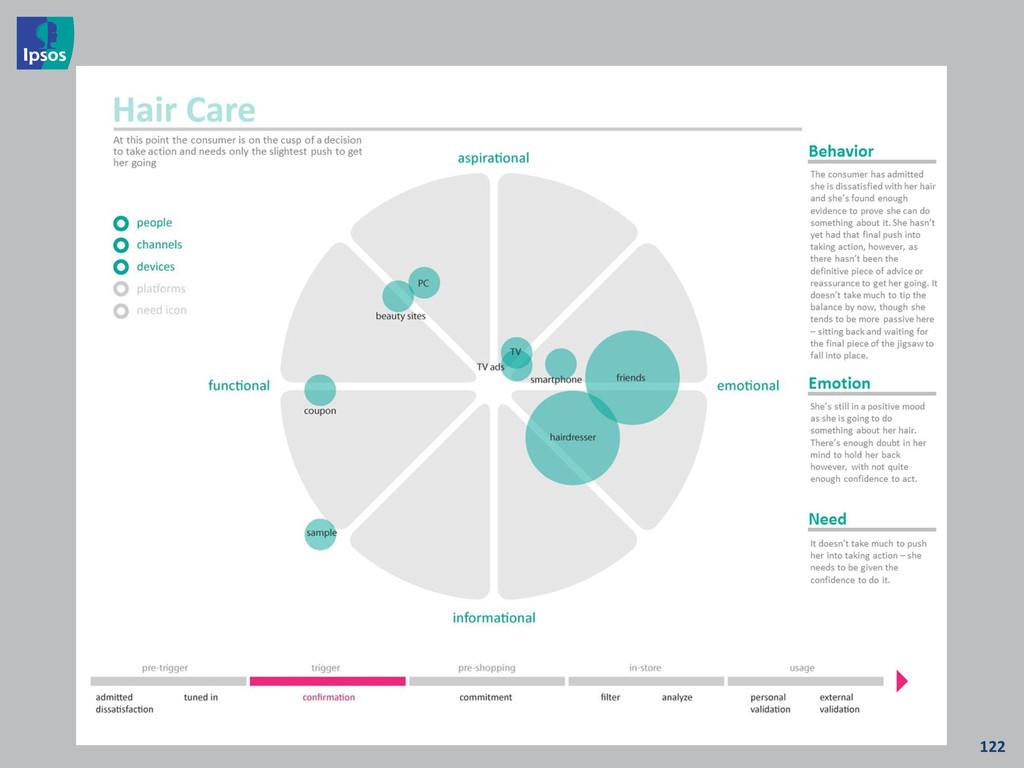
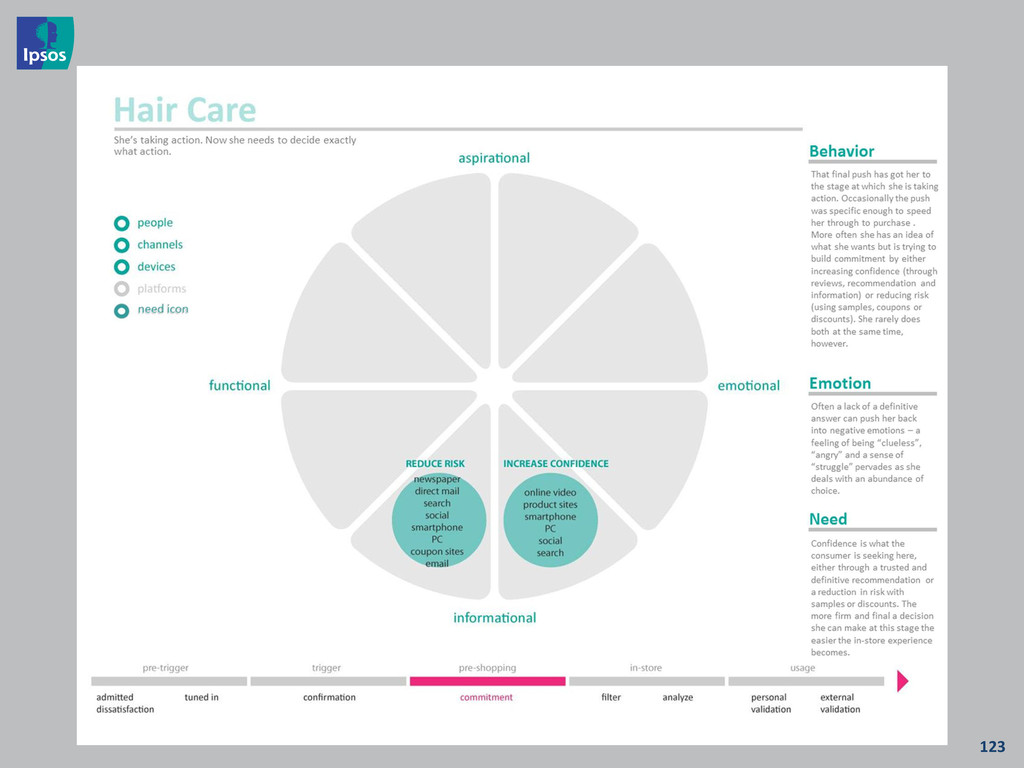
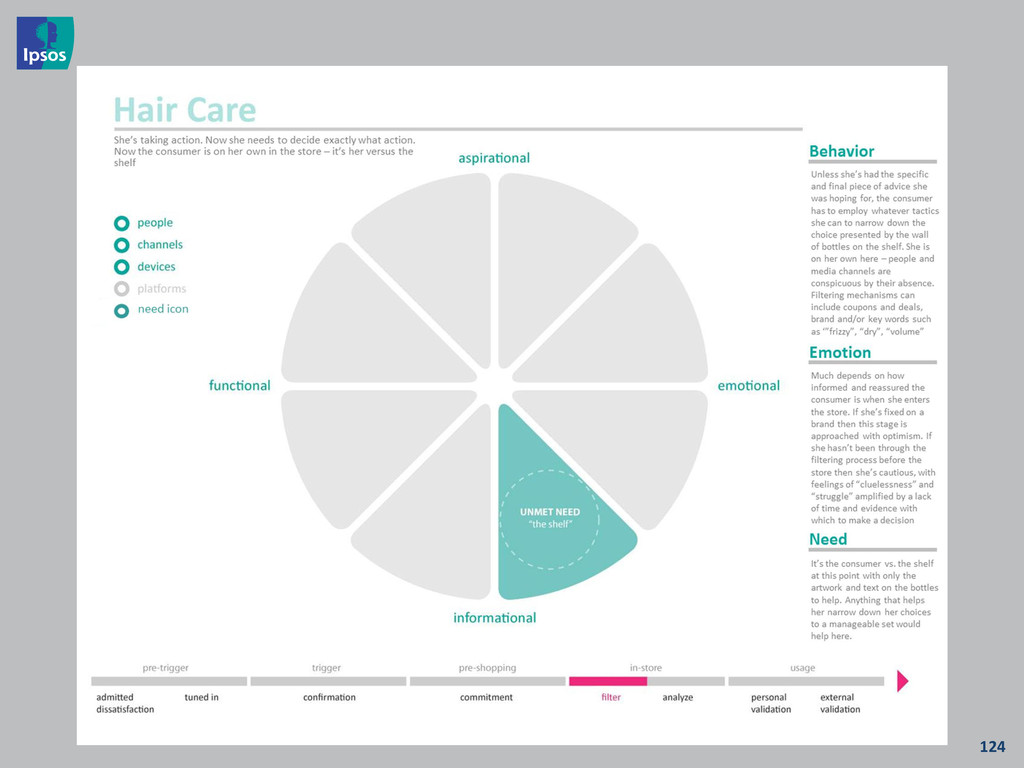
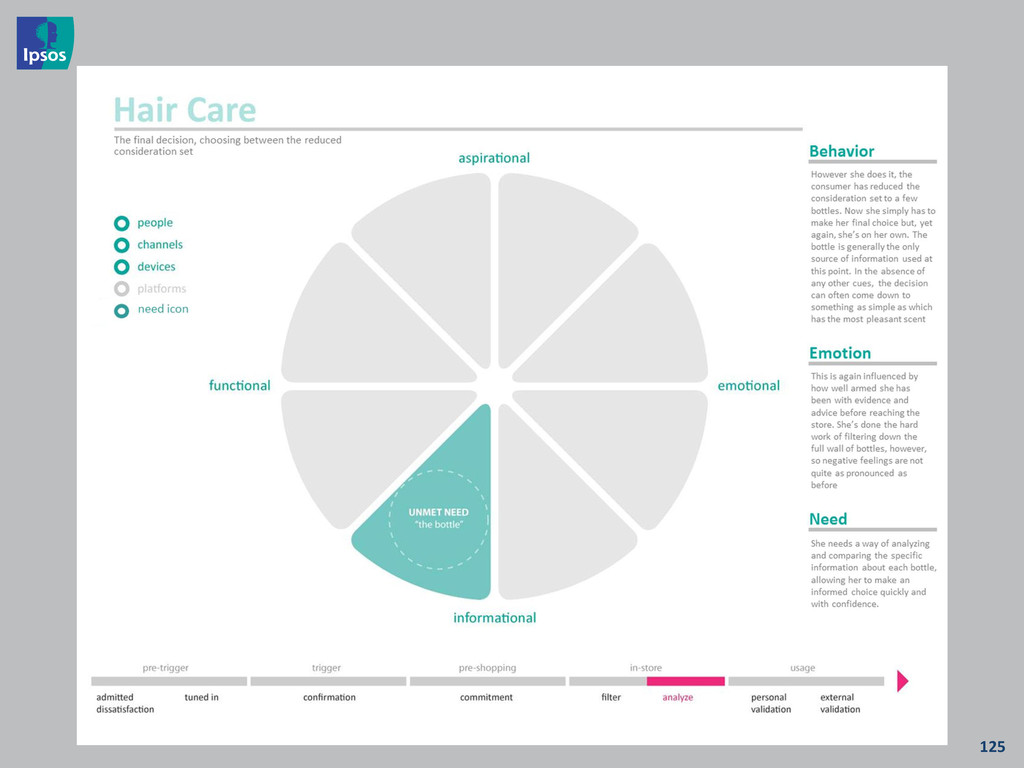
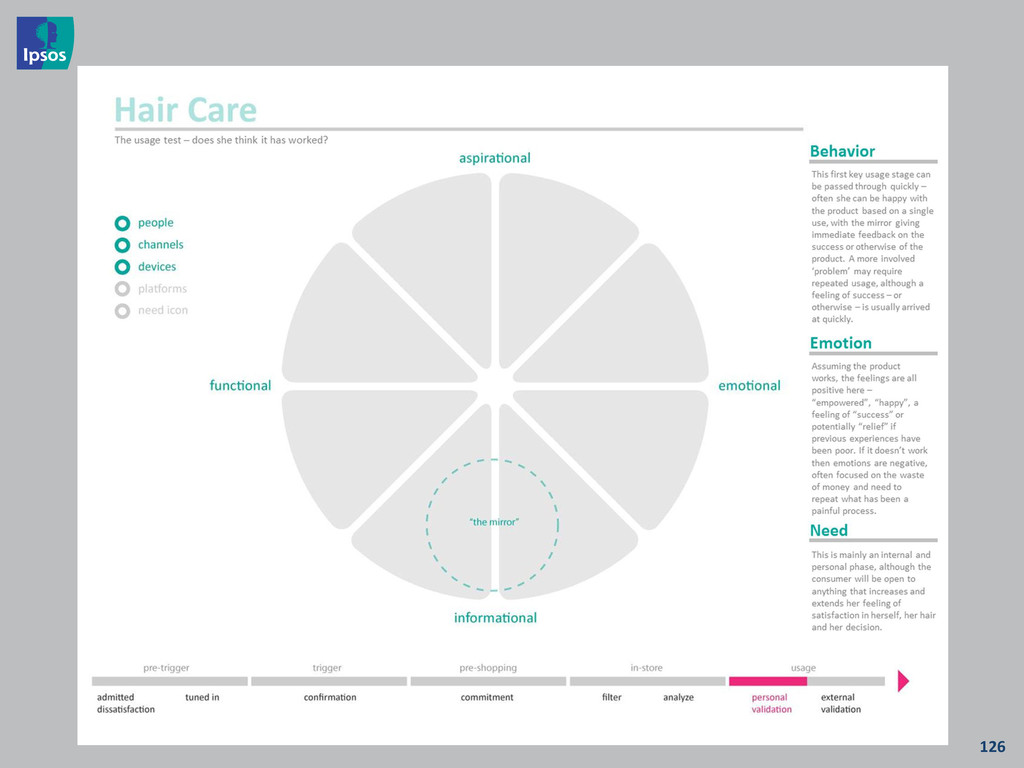
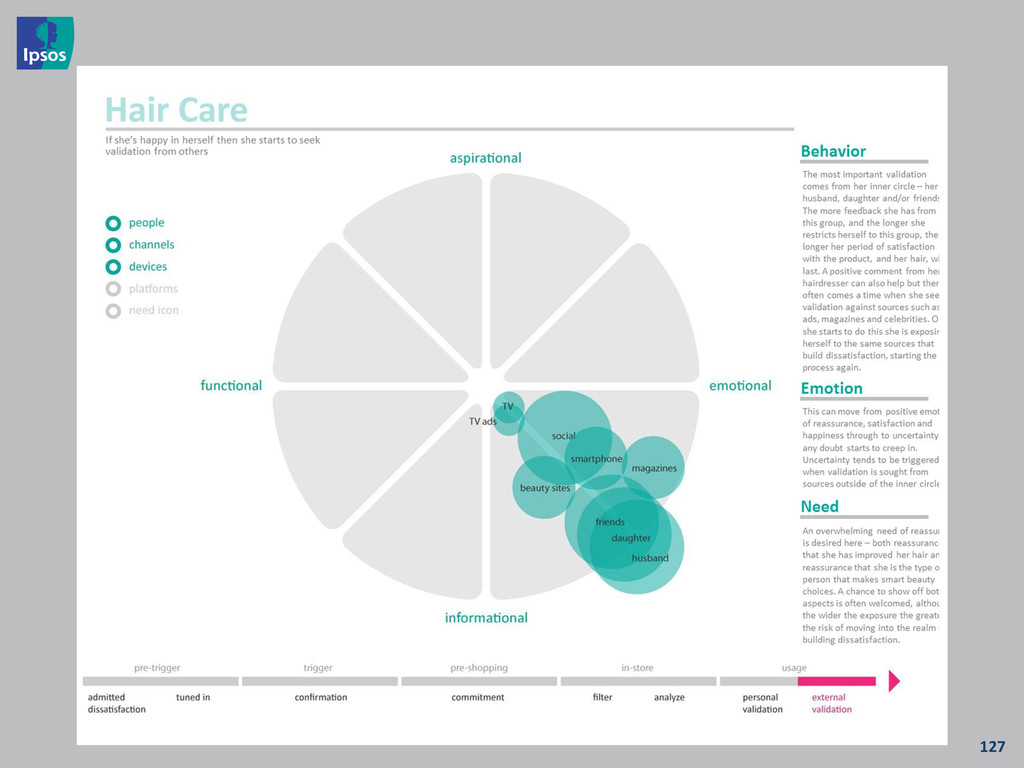
tool for informing marketing, media planning and channel receptivity. Our approach advises the planning, development and deployment of marketing communications and media within a cross platform environment to better connect with people beyond reach and frequency. Let’s look at a recent case study that shows how a woman’s quest for the perfect bottle of shampoo reveals new opportunities for marketers.
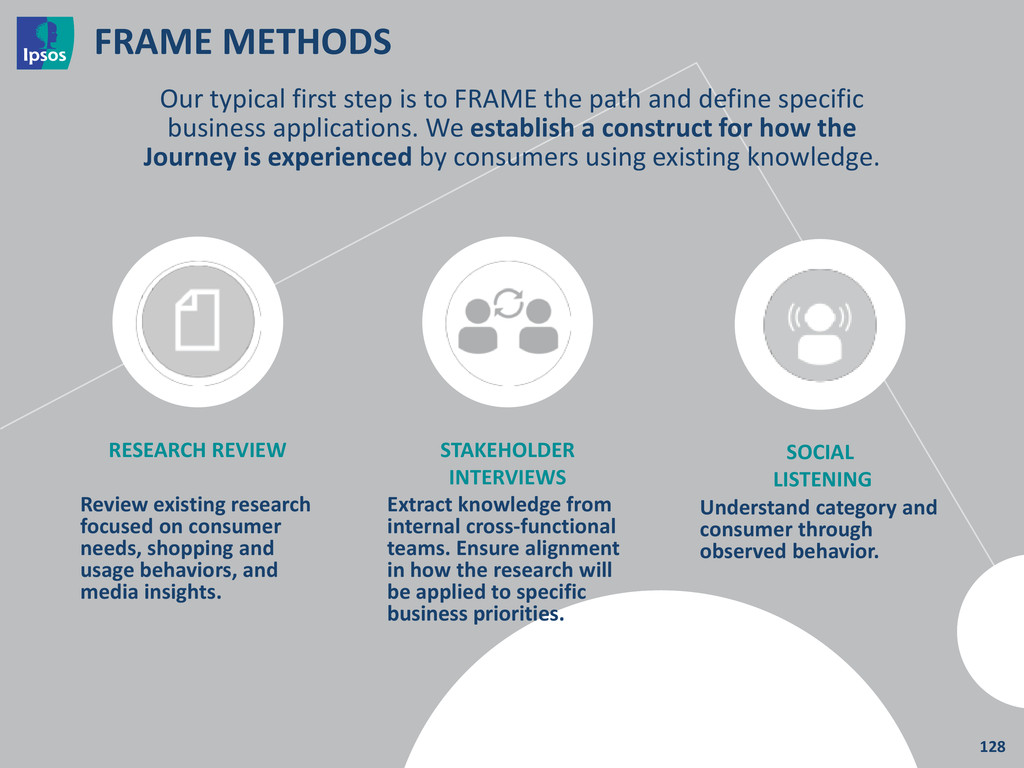
teams. Ensure alignment in how the research will be applied to specific business priorities. Our typical first step is to FRAME the path and define specific business applications. We establish a construct for how the Journey is experienced by consumers using existing knowledge. Review existing research focused on consumer needs, shopping and usage behaviors, and media insights. RESEARCH REVIEW SOCIAL LISTENING Understand category and consumer through observed behavior.
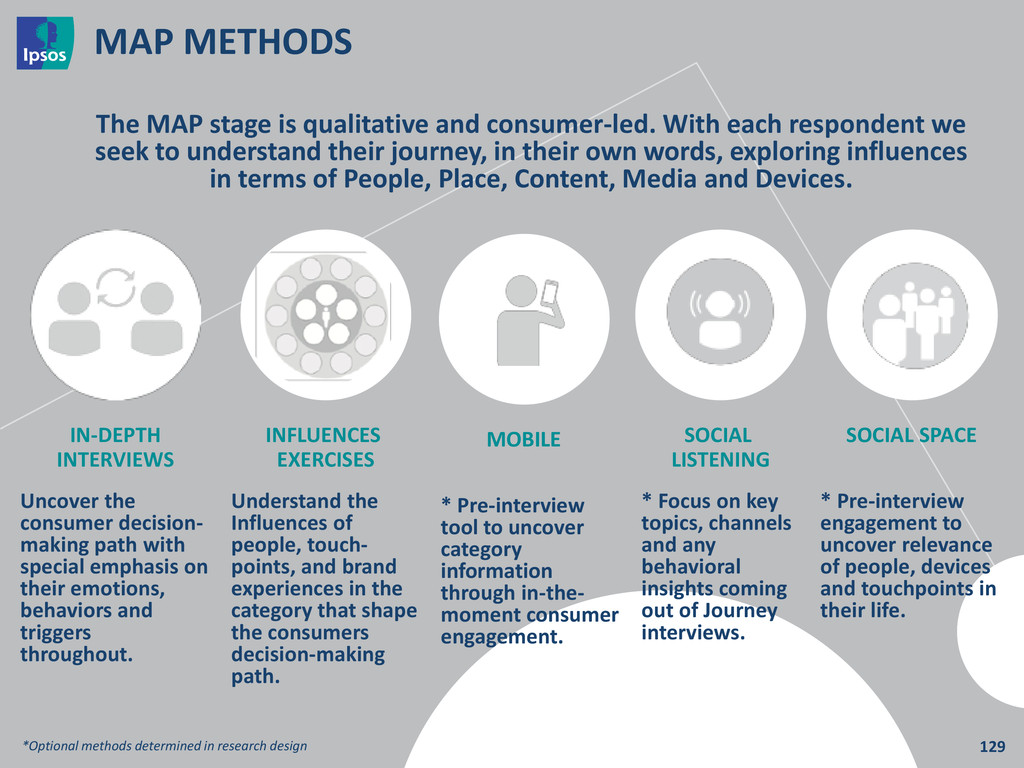
With each respondent we seek to understand their journey, in their own words, exploring influences in terms of People, Place, Content, Media and Devices. INFLUENCES EXERCISES Understand the Influences of people, touch- points, and brand experiences in the category that shape the consumers decision-making path. IN-DEPTH INTERVIEWS Uncover the consumer decision- making path with special emphasis on their emotions, behaviors and triggers throughout. SOCIAL SPACE * Pre-interview engagement to uncover relevance of people, devices and touchpoints in their life. * Pre-interview tool to uncover category information through in-the- moment consumer engagement. MOBILE SOCIAL LISTENING * Focus on key topics, channels and any behavioral insights coming out of Journey interviews. *Optional methods determined in research design
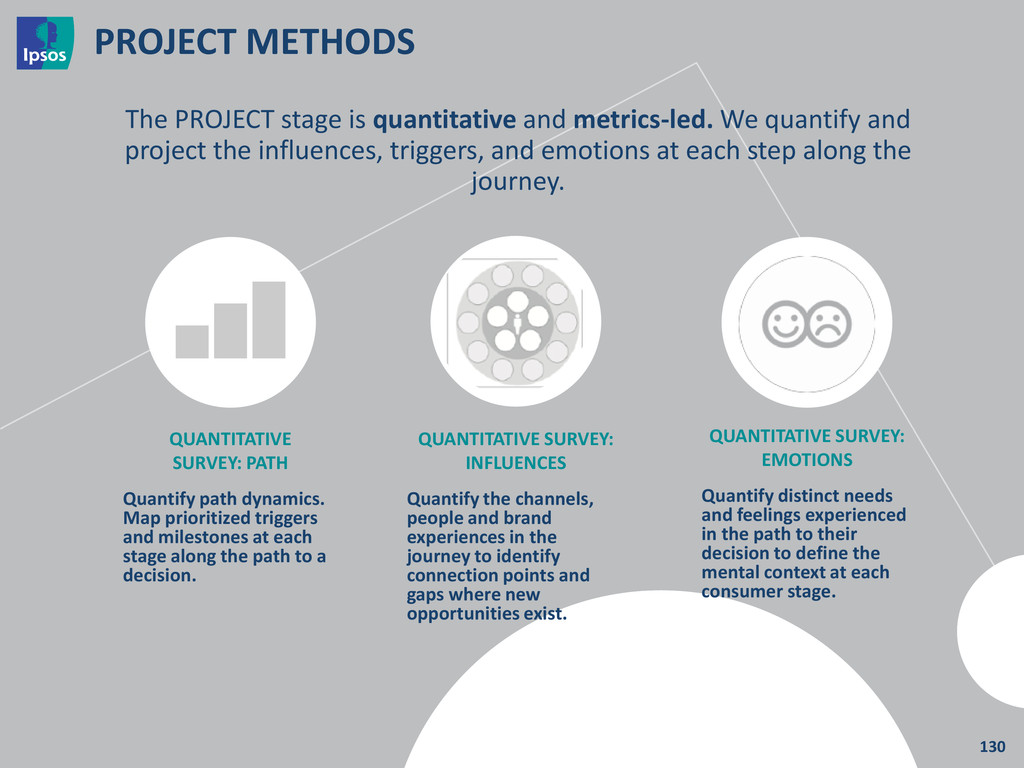
prioritized triggers and milestones at each stage along the path to a decision. Quantify the channels, people and brand experiences in the journey to identify connection points and gaps where new opportunities exist. QUANTITATIVE SURVEY: INFLUENCES Quantify distinct needs and feelings experienced in the path to their decision to define the mental context at each consumer stage. QUANTITATIVE SURVEY: EMOTIONS The PROJECT stage is quantitative and metrics-led. We quantify and project the influences, triggers, and emotions at each step along the journey.
the Customer to Navigate Success What We Can Learn From the Socialization of Super Bowl Ads: A Lesson in Integration Coffee Break Portland – Why Don’t You Love Us as Much as They Do in Seattle Getting To The ‘Why’ Along the Consumer Decision Journey The Triangulation Journey: Aligning Reputation Levers, Issue Impact and Message Fit Final Thoughts & Closing Remarks 132 Next Up
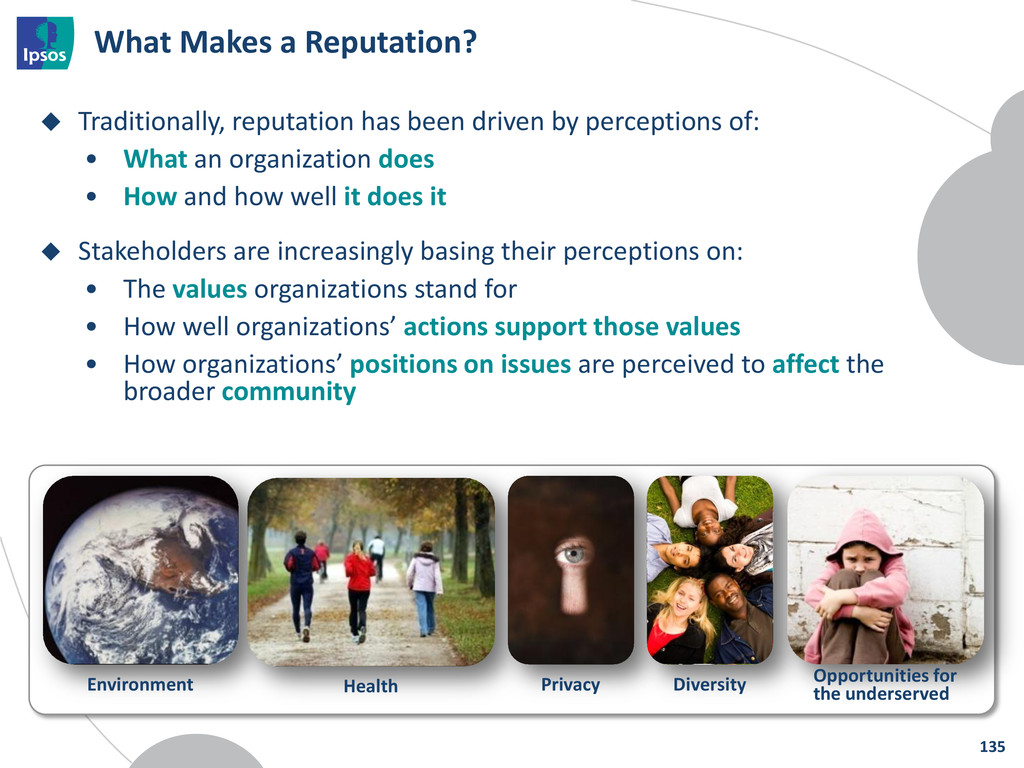
by perceptions of: • What an organization does • How and how well it does it Stakeholders are increasingly basing their perceptions on: • The values organizations stand for • How well organizations’ actions support those values • How organizations’ positions on issues are perceived to affect the broader community 135 Environment Health Privacy Diversity Opportunities for the underserved
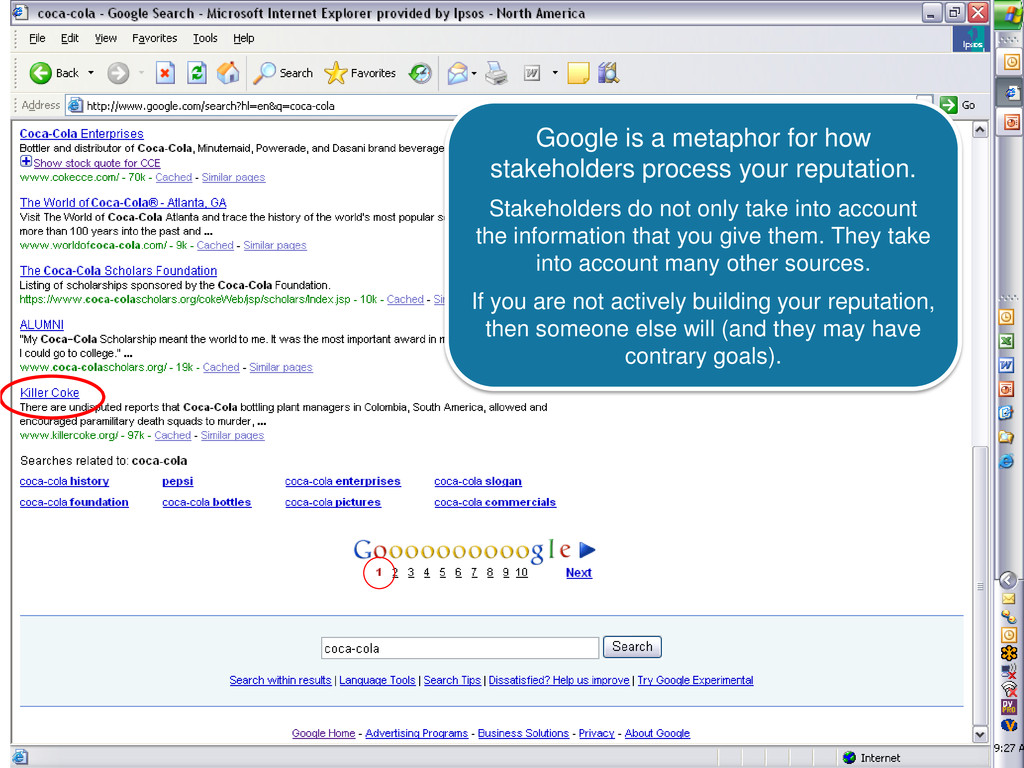
your reputation. Stakeholders do not only take into account the information that you give them. They take into account many other sources. If you are not actively building your reputation, then someone else will (and they may have contrary goals).
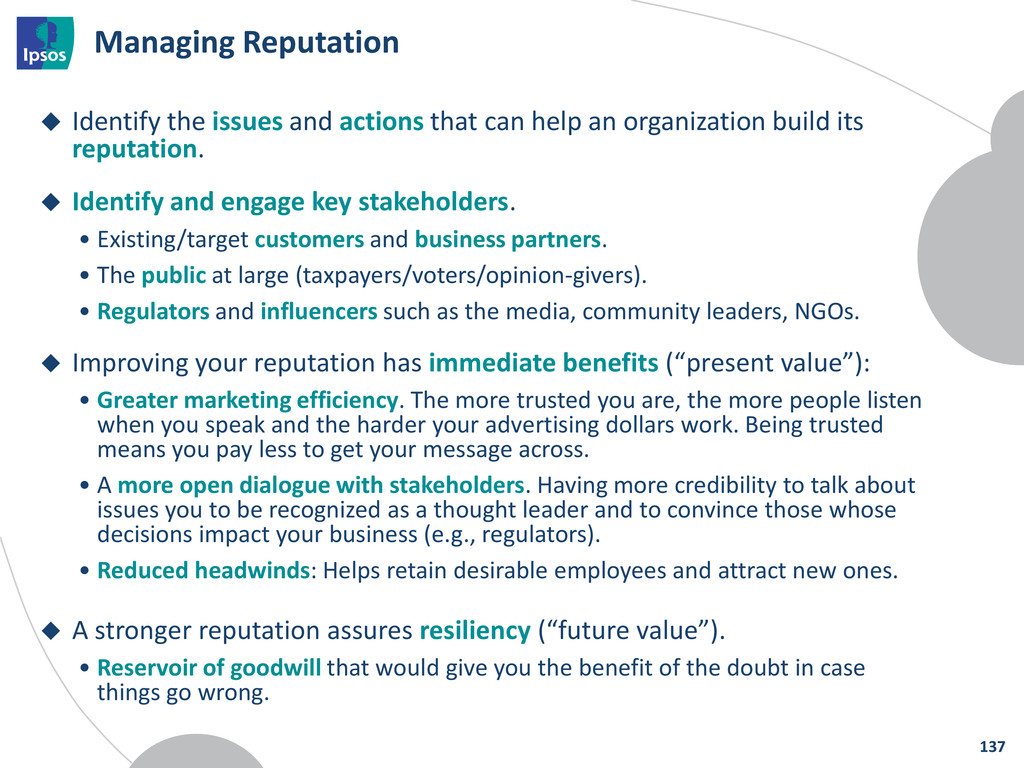
help an organization build its reputation. Identify and engage key stakeholders. • Existing/target customers and business partners. • The public at large (taxpayers/voters/opinion-givers). • Regulators and influencers such as the media, community leaders, NGOs. Improving your reputation has immediate benefits (“present value”): • Greater marketing efficiency. The more trusted you are, the more people listen when you speak and the harder your advertising dollars work. Being trusted means you pay less to get your message across. • A more open dialogue with stakeholders. Having more credibility to talk about issues you to be recognized as a thought leader and to convince those whose decisions impact your business (e.g., regulators). • Reduced headwinds: Helps retain desirable employees and attract new ones. A stronger reputation assures resiliency (“future value”). • Reservoir of goodwill that would give you the benefit of the doubt in case things go wrong. 137
The information revolution has made reputation increasingly important Our clients track reputation as they do customer satisfaction and brand equity Research helps guide investment to most effectively rally opinion in their favor 138
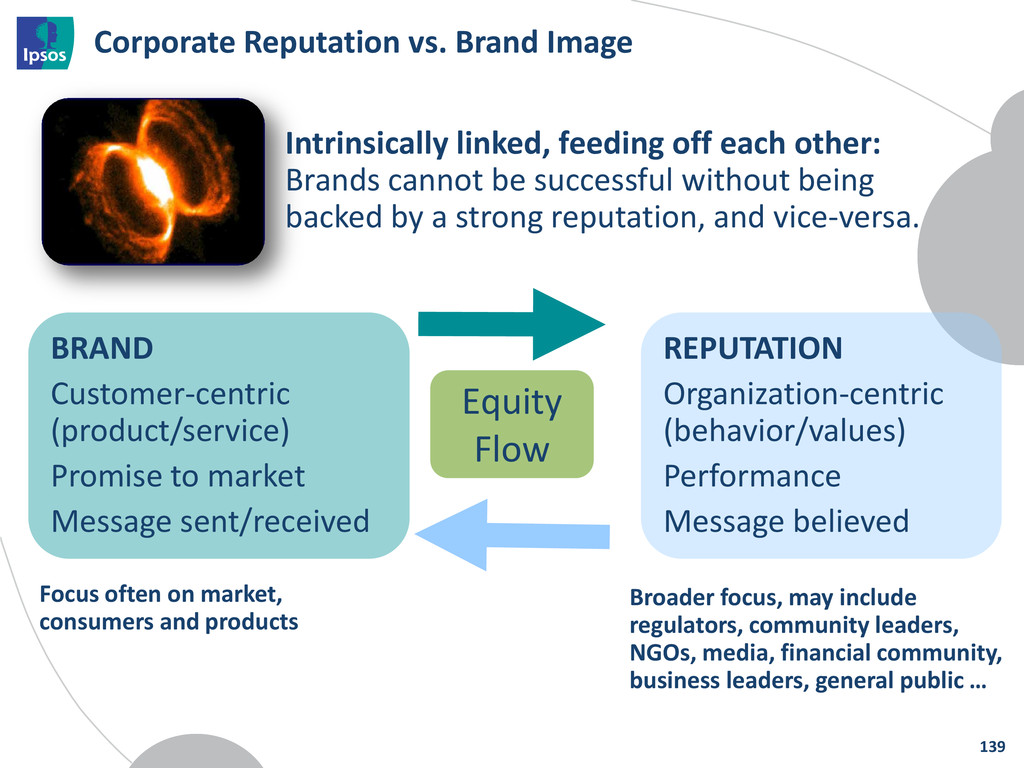
to market Message sent/received Equity Flow Intrinsically linked, feeding off each other: Brands cannot be successful without being backed by a strong reputation, and vice-versa. Focus often on market, consumers and products Broader focus, may include regulators, community leaders, NGOs, media, financial community, business leaders, general public … Corporate Reputation vs. Brand Image 139
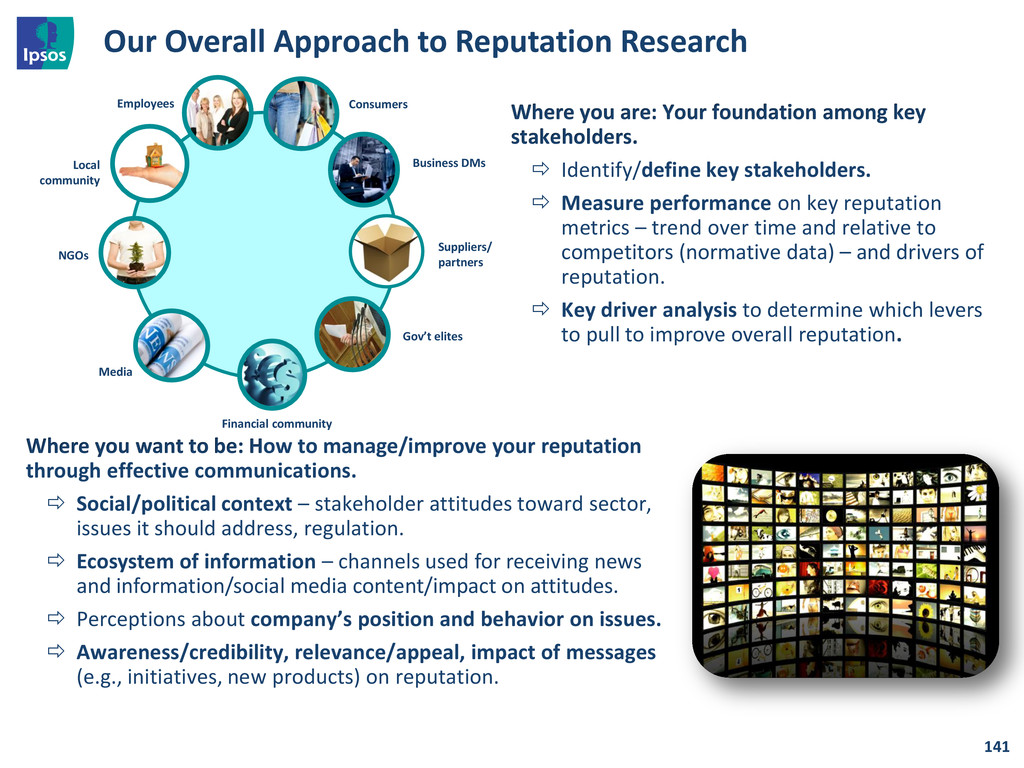
Your foundation among key stakeholders. Identify/define key stakeholders. Measure performance on key reputation metrics – trend over time and relative to competitors (normative data) – and drivers of reputation. Key driver analysis to determine which levers to pull to improve overall reputation. Business DMs Suppliers/ partners Gov’t elites Consumers NGOs Local community Media Financial community Employees Where you want to be: How to manage/improve your reputation through effective communications. Social/political context – stakeholder attitudes toward sector, issues it should address, regulation. Ecosystem of information – channels used for receiving news and information/social media content/impact on attitudes. Perceptions about company’s position and behavior on issues. Awareness/credibility, relevance/appeal, impact of messages (e.g., initiatives, new products) on reputation.
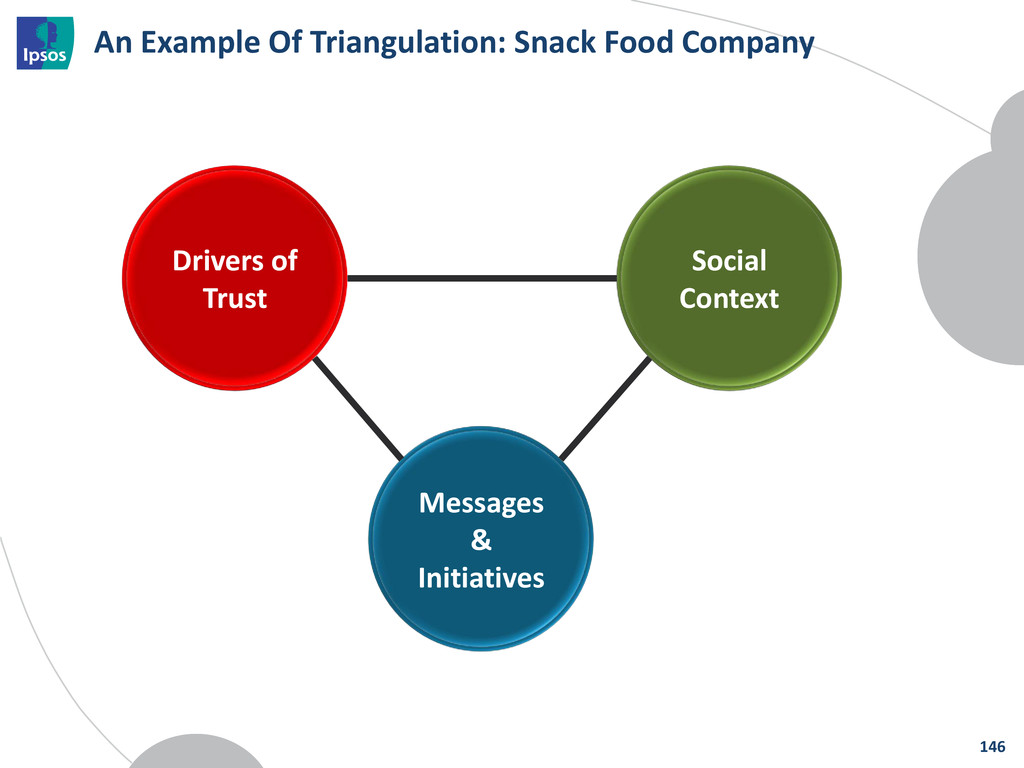
fall into three categories BUT! The components should ultimately be unique to the client and reflect their belief structure Corporate Social Responsibility Business Mgmt/Ethics Core Business 143
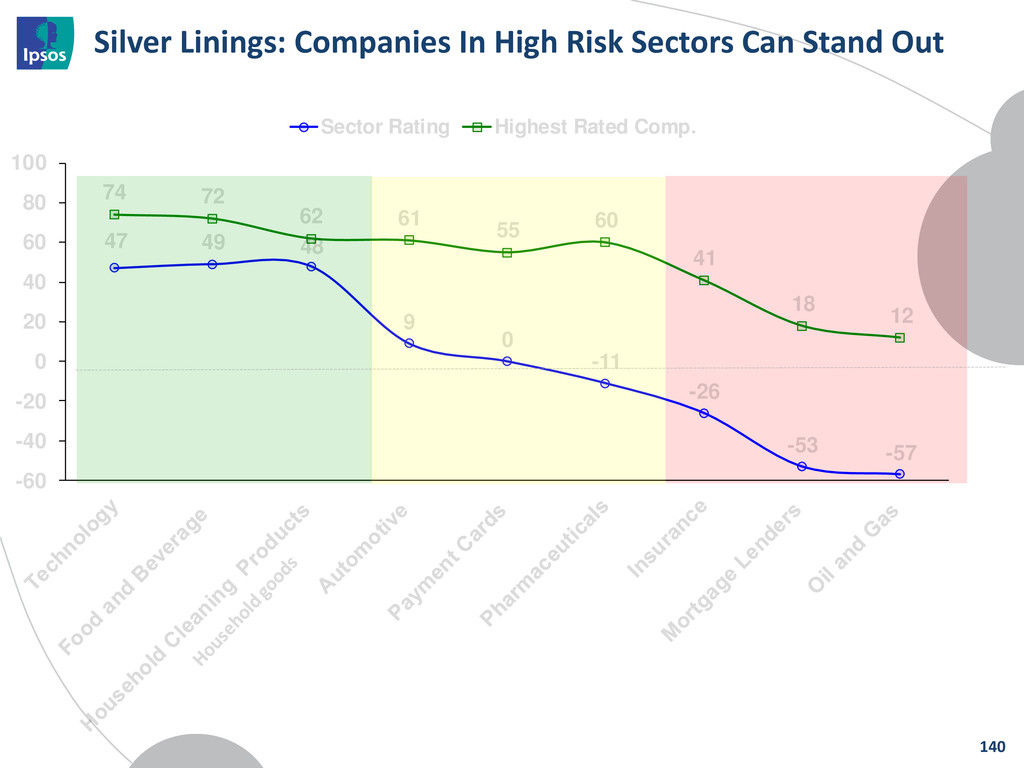
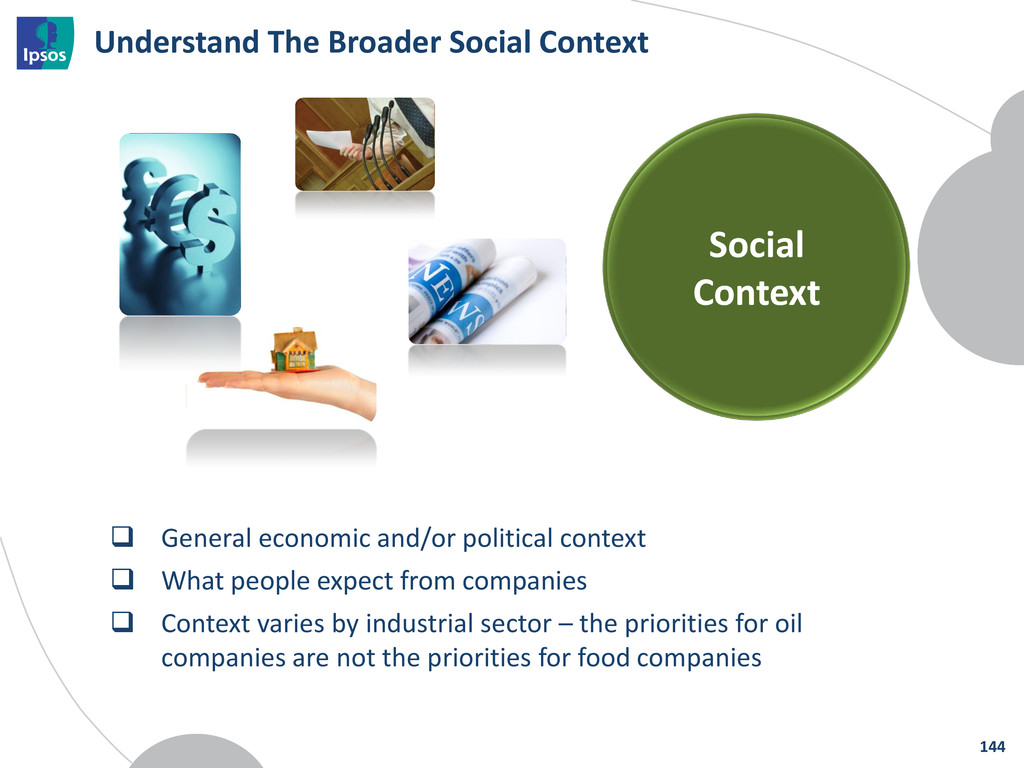
and/or political context What people expect from companies Context varies by industrial sector – the priorities for oil companies are not the priorities for food companies 144
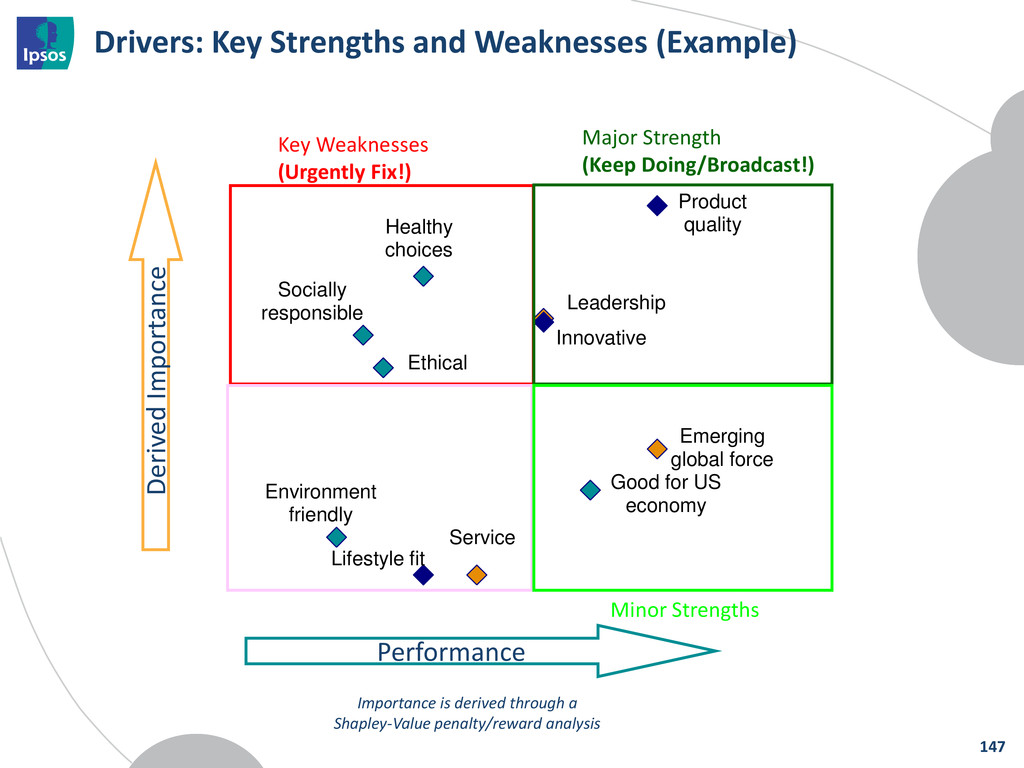
Innovative Good for US economy Socially responsible Healthy choices Product quality Drivers: Key Strengths and Weaknesses (Example) Performance Derived Importance Importance is derived through a Shapley-Value penalty/reward analysis Key Weaknesses (Urgently Fix!) Minor Strengths Major Strength (Keep Doing/Broadcast!) 147
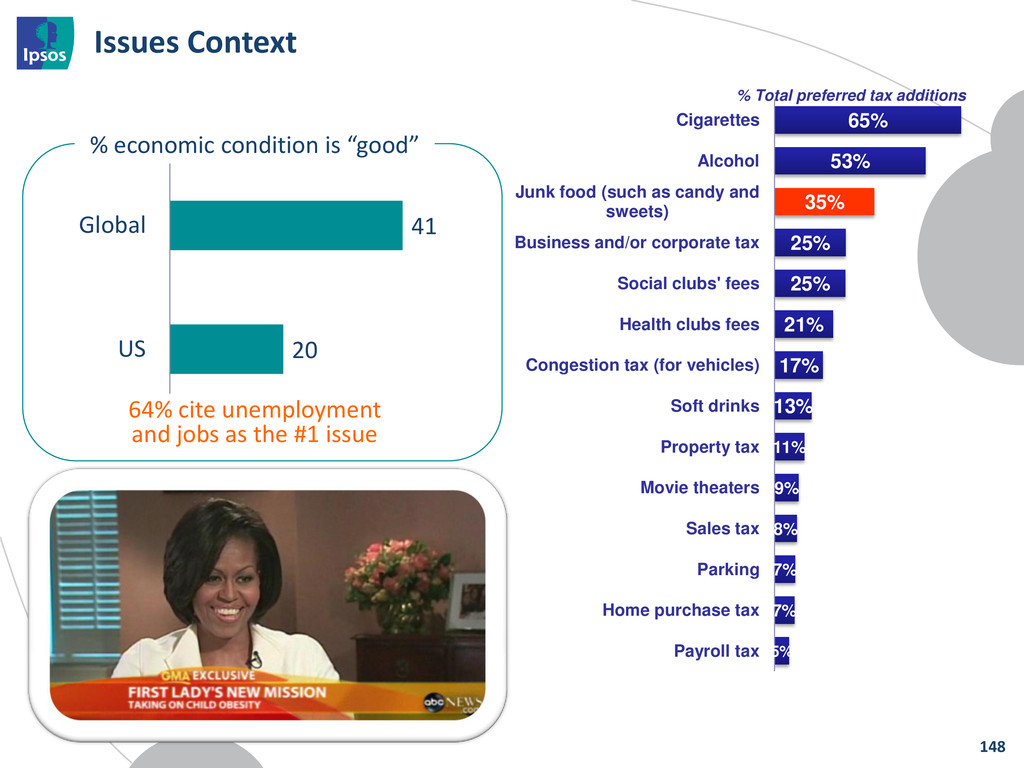
11% 9% 8% 7% 7% 5% Cigarettes Alcohol Junk food (such as candy and sweets) Business and/or corporate tax Social clubs' fees Health clubs fees Congestion tax (for vehicles) Soft drinks Property tax Movie theaters Sales tax Parking Home purchase tax Payroll tax % Total preferred tax additions 41 20 Global US % economic condition is “good” 64% cite unemployment and jobs as the #1 issue 148
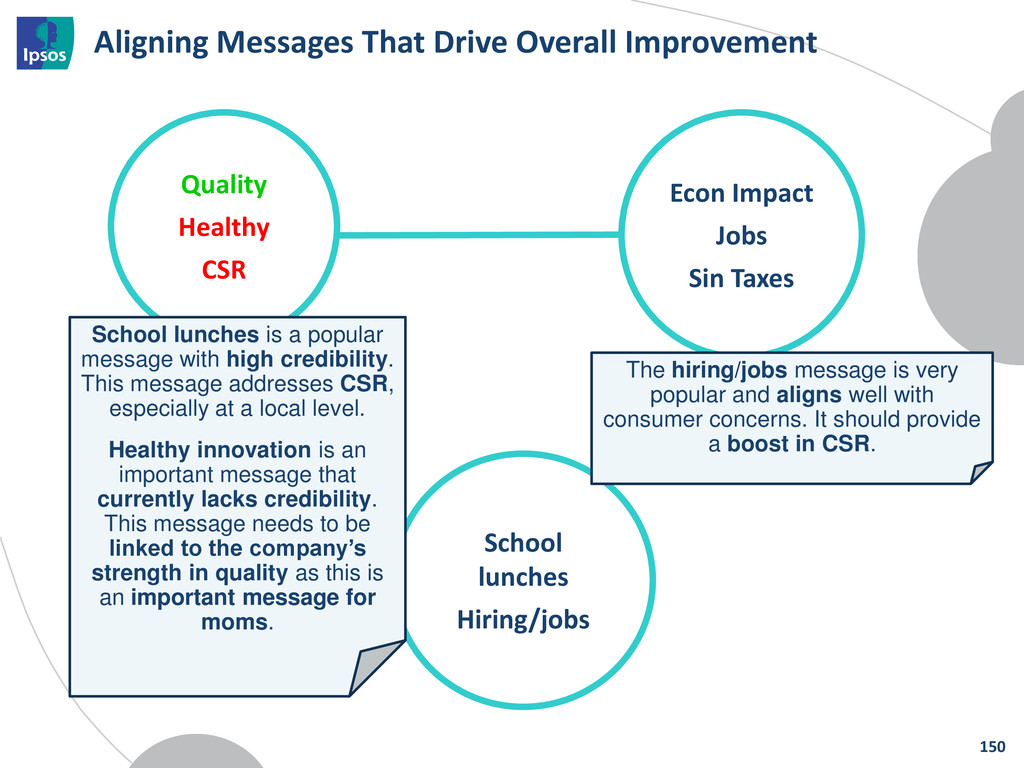
Healthy CSR Econ Impact Jobs Sin Taxes School lunches is a popular message with high credibility. This message addresses CSR, especially at a local level. Healthy innovation is an important message that currently lacks credibility. This message needs to be linked to the company’s strength in quality as this is an important message for moms. The hiring/jobs message is very popular and aligns well with consumer concerns. It should provide a boost in CSR. 150
of the Customer to Navigate Success What We Can Learn From the Socialization of Super Bowl Ads: A Lesson in Integration Coffee Break Portland – Why Don’t You Love Us as Much as They Do in Seattle Getting To The ‘Why’ Along the Consumer Decision Journey The Triangulation Journey: Aligning Reputation Levers, Issue Impact and Message Fit Final Thoughts & Closing Remarks 153 Next Up
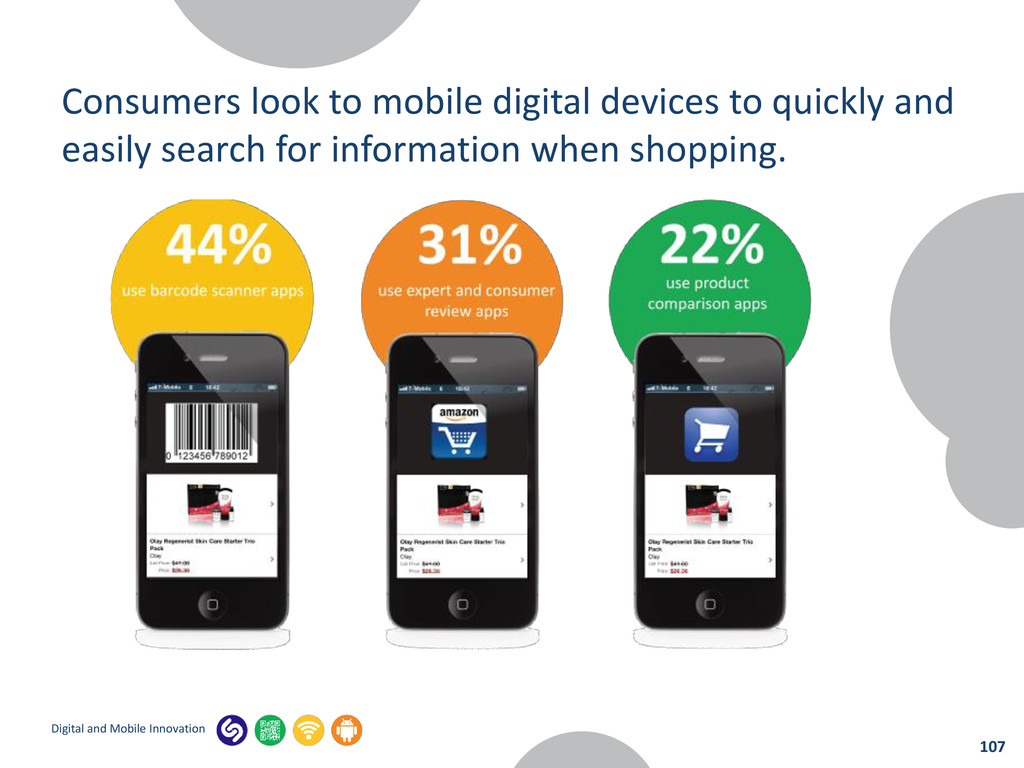
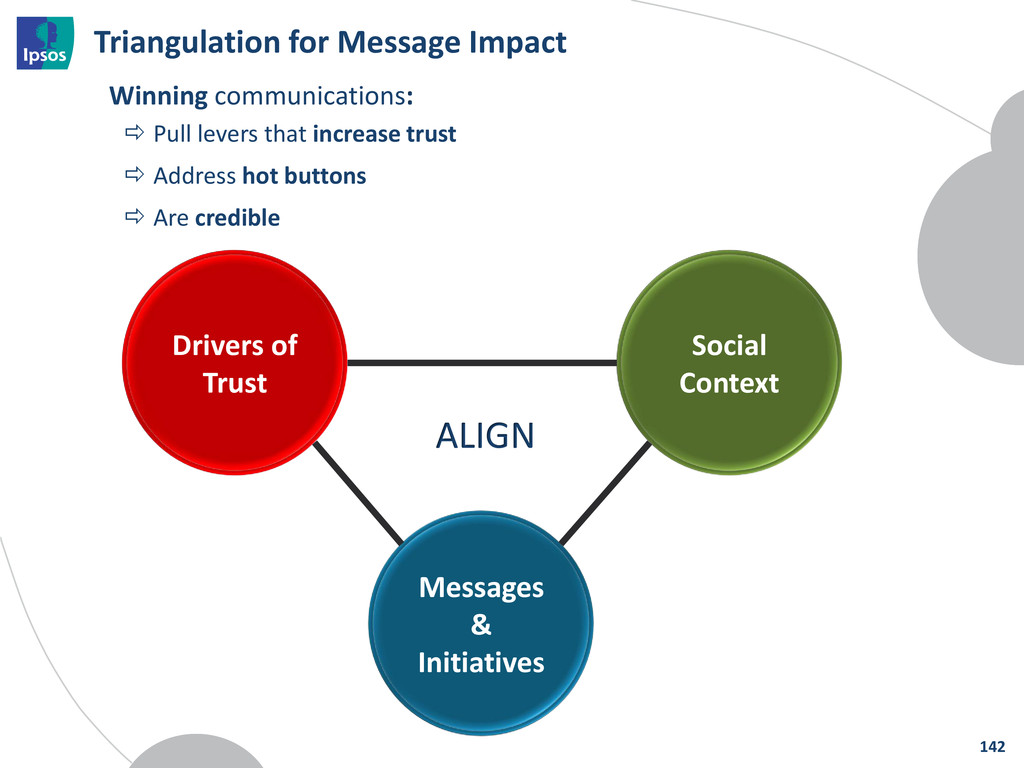