Upgrade to Pro — share decks privately, control downloads, hide ads and more …

Conquering Distance? The Rural West and Broadband Internet Access

Geoff McGhee
October 13, 2012

Conquering Distance? The Rural West and Broadband Internet Access

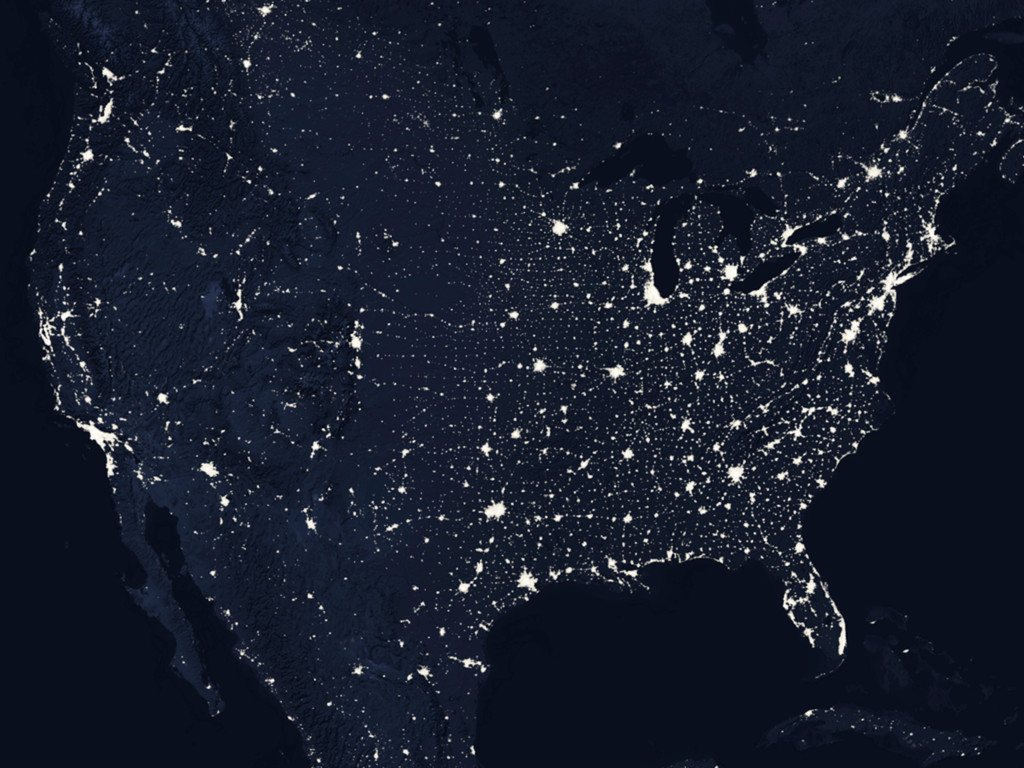
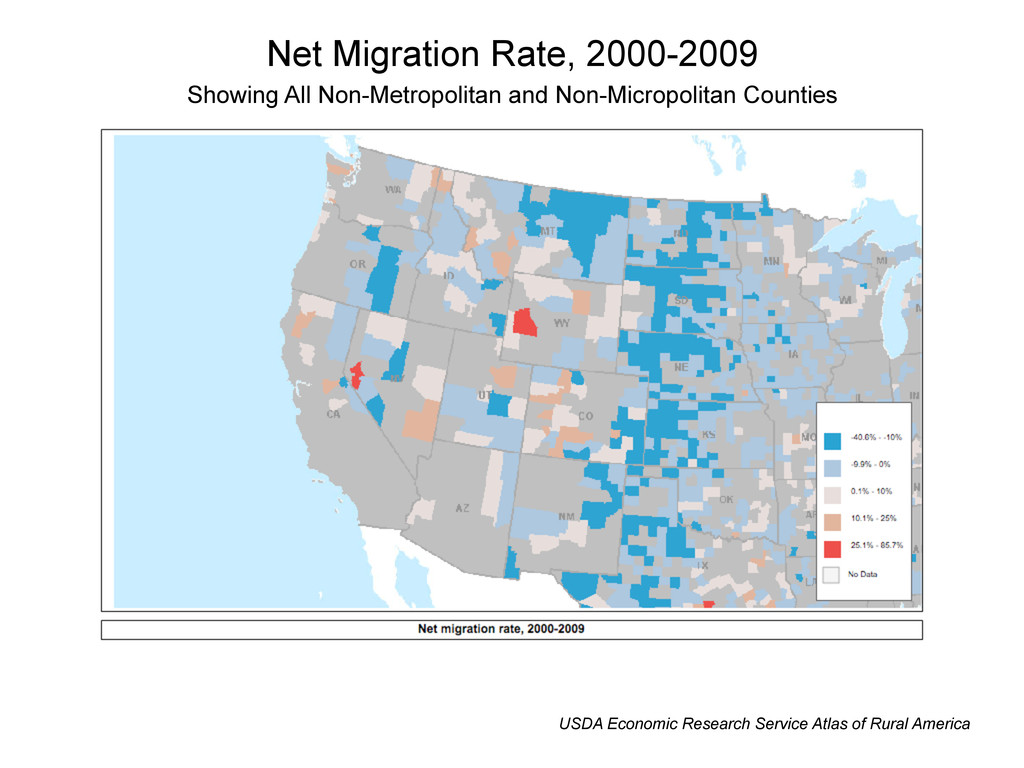
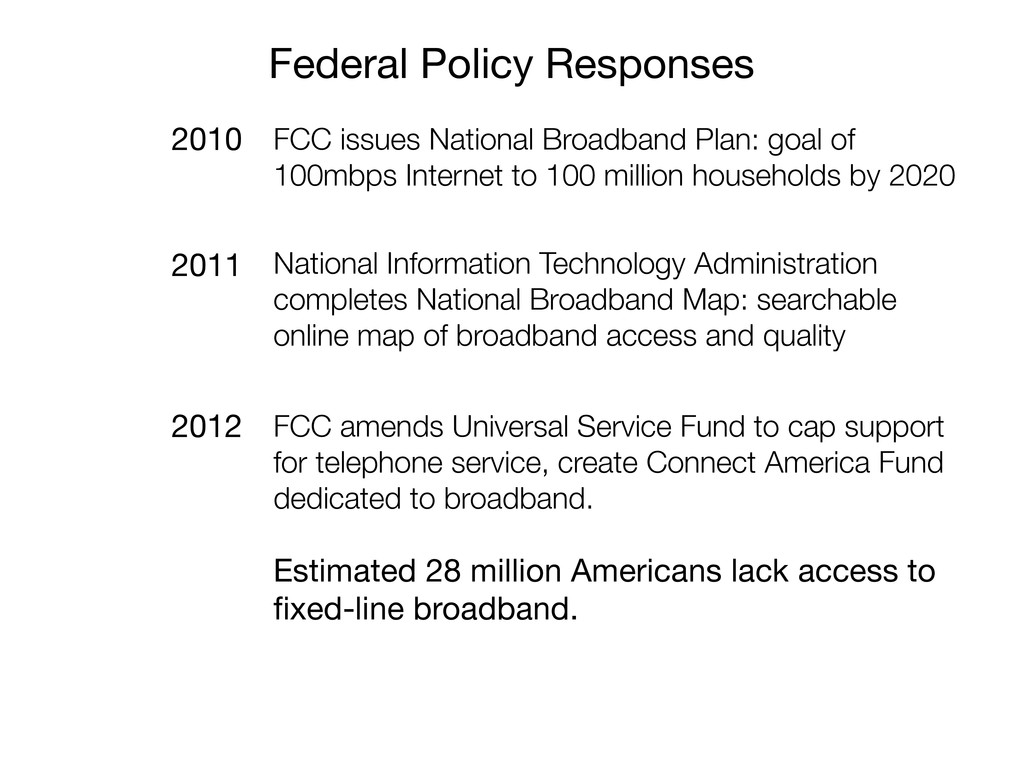
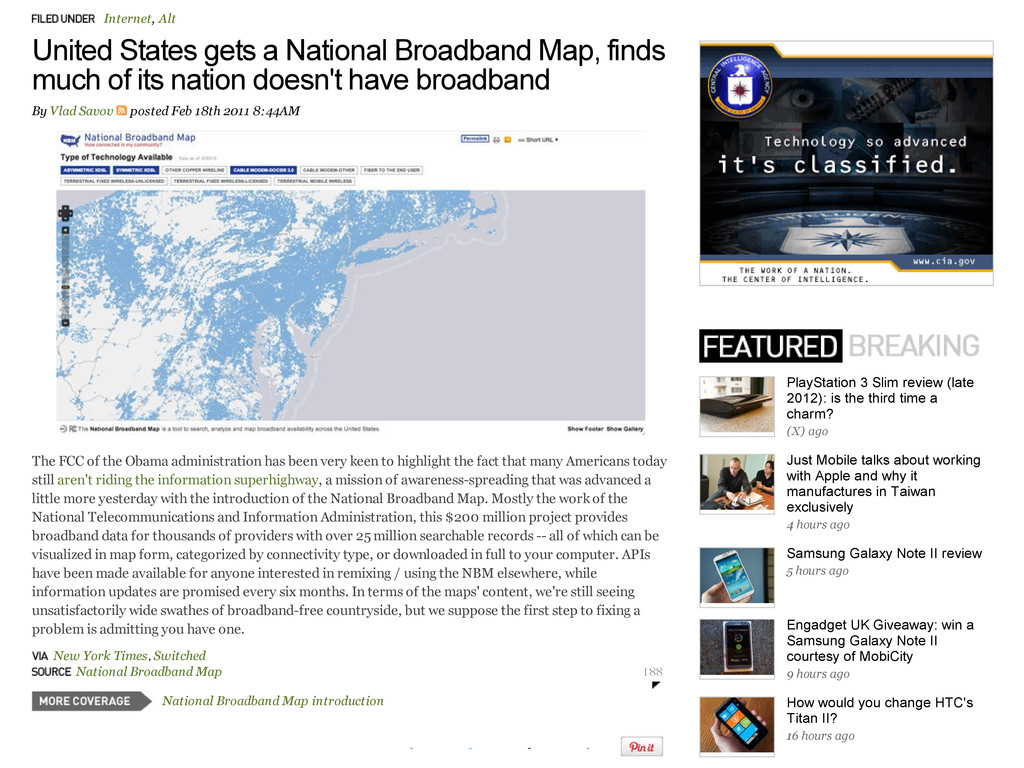
As the United States – and the world – becomes deeper enmeshed in a global electronic communications network, the increasing economic, social and political importance of Internet access presents both a challenge and an opportunity to the rural West: on one hand, it is an opportunity to collapse the great distance that separates many rural western communities from centers of commerce and government; at the same time, the very distance that separates rural western communities from the Internet's "backbone" makes it an expensive and technically challenging proposition to make affordable high-speed Internet access widely available to residential users, especially at speeds that provide for low-latency, high speed connections in both directions.

Geoff McGhee

October 13, 2012
Tweet

More Decks by Geoff McGhee

Other Decks in Research

Transcript

  1. Conquering Distance? The Rural West and Broadband Internet Access Geoff

    McGhee Bill Lane Center for the American West, Stanford University Conference on the Rural West Ogden Eccles Conference Center October 13, 2012
  2. Census Bureau Office of Management and Budget CBSA Status Counties:

    n=3141 Metropolitan CBSA (1100) Micropolitan CBSA (688) Areas Outside CBSAs (1353) Hawaii and Alaska not to scale Metropolitan and Micropolitan Core Based Statistical Areas (CBSAs) November 2009 Office of Management and Budget CBSA Designations by County Sources: County Boundaries - U.S. Census Bureau, 2000. CBSA Designations - U.S. Census Bureau and Office of Management and Budget, 2009. Prepared by the North Carolina Rural Health Research and Policy Analysis Center, Cecil G. Sheps Center for Health Services Research, University of North Carolina at Chapel Hill. Notes: "Core Based Statistical Area" (CBSA) is the OMB's collective term for Metropolitan and Micropolitan statistical areas. OMB has not defined an affirmative title for areas outside CBSAs. US Department of Agriculture Rural-Urban Continuum Codes and Descriptions 1: County in metropolitan area with 1 million population or more 2: County in metropolitan area of 250,000 to 1 million population 3: County in metropolitan area of fewer than 250,000 population 4: Nonmetro county with urban pop. of 20,000 or more, adjacent to metro area 5: Nonmetro county with urban pop. of 20,000 or more, not adjacent to metro area 6: Nonmetro county with urban pop. of 2,500-19,999, adjacent to metro area 7: Nonmetro county with urban pop. of 2,500-19,999, not adjacent to metro area Hawaii and Alaska not to scale Rural-Urban Continuum Codes by County, 2003 Sources: County Boundaries - U.S. Census Bureau, 2000. Rural-Urban Continuum Codes - Economic Research Census Bureau Defining “Rural”
  3. According to the FCC: The Meaning of Broadband Internet Access

    – Michael J. Copps, Chairman of the Federal Communications Commission “Bringing Broadband to Rural America,” 2008 • Study: communities with access to mass- market broadband grew disproportionally • Improve quality of education, health care and public safety • Farm productivity: weather and crop reports, livestock disease, time sales of products • Opens wider markets for small business, craftspeople • Enables telecommuting, telework • Assistance for disabled • Broadband is the “national highway system of the 21st century”
  4. The Meaning of Broadband Internet Access “No national broadband strategy

    can be undertaken without due consideration to the rural broadband infrastructure and the people it must serve. “As long as a grade-school child living on a farm cannot reach a science project, or a high school student living on a remote Indian reservation cannot submit a college application, or an enterprise in a rural hamlet cannot order spare parts, or a local law enforcement officer cannot download pictures of a missing child without traveling to a city or town that has broadband internet access, we cannot turn back from those challenges.” – Michael J. Copps, Chairman of the Federal Communications Commission “Bringing Broadband to Rural America,” 2008
  5. How Important is Broadband? “The case for broadband has to

    be based in our view that it is basic infrastructure and is therefore something that we need to insure is available at a minimal level. Its absence will be a reason for slower growth, poorer economic conditions, and lower property values.” – William Lehr, Massachusetts Institute of Technology to Center for Rural Strategies, 2010
  6. Federal Policy Responses Telecommunications Act incorporates broader definition of telecom

    services covered, establishes programs for schools and libraries, high cost areas, rural health care providers Pilot broadband grant and loan programs within Rural Utilities Service and USDA; Rural Electrification Act amended to authorize loans for rural broadband service Farm Bill calls for “comprehensive rural broadband strategy” by 2009 Broadband Data Improvement Act: Lack of information on access, quality, rates Recovery Act calls for National Broadband Plan, allocates $7.2 billion to grant, loan and guarantee programs to promote broadband infrastructure in high-cost and rural areas. 1996 2008 2009 2001-02
  7. 2010 2012 FCC issues National Broadband Plan: goal of 100mbps

    Internet to 100 million households by 2020 2011 National Information Technology Administration completes National Broadband Map: searchable online map of broadband access and quality FCC amends Universal Service Fund to cap support for telephone service, create Connect America Fund dedicated to broadband. Estimated 28 million Americans lack access to fixed-line broadband. Federal Policy Responses
  8. By  Vlad  Savov    posted  Feb  18th  2011  8:44AM  Internet,

     Alt United  States  gets  a  National  Broadband  Map,  finds much  of  its  nation  doesn't  have  broadband The FCC of the Obama administration has been very keen to highlight the fact that many Americans today still aren't riding the information superhighway, a mission of awareness-spreading that was advanced a little more yesterday with the introduction of the National Broadband Map. Mostly the work of the National Telecommunications and Information Administration, this $200 million project provides broadband data for thousands of providers with over 25 million searchable records -- all of which can be visualized in map form, categorized by connectivity type, or downloaded in full to your computer. APIs have been made available for anyone interested in remixing / using the NBM elsewhere, while information updates are promised every six months. In terms of the maps' content, we're still seeing unsatisfactorily wide swathes of broadband-free countryside, but we suppose the first step to fixing a problem is admitting you have one. National  Broadband  Map  introduction New  York  Times, Switched National  Broadband  Map 188 - - - - PlayStation  3  Slim  review  (late 2012):  is  the  third  time  a charm? (X)  ago Just  Mobile  talks  about  working with  Apple  and  why  it manufactures  in  Taiwan exclusively 4  hours  ago Samsung  Galaxy  Note  II  review 5  hours  ago Engadget  UK  Giveaway:  win  a Samsung  Galaxy  Note  II courtesy  of  MobiCity 9  hours  ago How  would  you  change  HTC's Titan  II? 16  hours  ago
  9. "Variation of broadband coverage is less pronounced in the West,

    especially the intermountain West, compared with the midwest and appalachia. This may be due to a more concentrated population pattern (though the analysis accounts for some of this effect by including percent urban); a recreation-based economy, attracting tourists who increasingly demand broadband availability; or a rapidly growing population made up of younger, more educated individuals, including tech-savvy entrepreneurs whose businesses depend on being connected to urban based clients." Economic Research Service/USDA, 2009
  10. Symbology Connections per 1000 Households Zero Zero < x <=

    200 200 < x <= 400 400 < x <= 600 600 < x <= 800 800 < x Map 2 Residential Fixed Connections at Least 768 kbps Downstream and 200 kbps Upstream per 1,000 Households by Census Tract as of June 30, 2011 P u e r t o R i c o P u e r t o R i c o H a w a i i H a w a i i A l a s k a A l a s k a This map shows the number of residential connections per 1,000 households by census tract. Connections have information transfer rates greater than 200 kbps upstream and at least 768 kbps downstream. All technologies except terrestrial mobile wireless are included. Connections are from FCC Form 477 Part VI. The census tract boundaries are from ESRI. Household counts for tracts in the U.S. are 2010 estimates from Geolytics. Household counts for the territories are from Census 2000. For more information about census tracts please see Census 2000 Summary File 3 Technical Documentation, page A-11. 86)HGHUDO&RPPXQLFDWLRQV&RPPLVVLRQ ,QWHUQHW$FFHVV6HUYLFHV6WDWXVDVRI-XQH
  11. Symbology Provider Count (exc. Mobile Wireless) Zero 1 to 3

    4 to 6 7 or more Map 4 Providers of Residential Fixed Connections over 200 kbps in at Least One Direction by Census Tract as of June 30, 2011 P u e r t o R i c o P u e r t o R i c o H a w a i i H a w a i i A l a s k a A l a s k a This map shows the number of providers of fixed connections by census tract. A provider is counted only if it reported residential connections in the tract. Connections have information transfer rates greater than 200 kbps in at least one direction and include all technologies except terrestrial mobile wireless. Provider data are from FCC Form 477 Part VI. The census tract boundaries are from ESRI. For more information about census tracts please see Census 2000 Summary File 3 Technical Documentation, page A-11. U.S. Federal Communications Commission Internet Access Services: Status as of June 30, 2011 64
  12. Symbology Provider Count (exc. Mobile Wireless) Zero 1 to 3

    4 to 6 7 or more Map 5 Providers of Residential Fixed Connections at Least 3 mbps Downstream and 768 kbps Upstream by Census Tract as of June 30, 2011 P u e r t o R i c o P u e r t o R i c o H a w a i i H a w a i i A l a s k a A l a s k a This map shows the number of providers of fixed connections by census tract. A provider is counted only if it reported residential connections in the tract. Connections have information transfer rates of at least 3 mbps downstream and at least 768 kbps upstream and include all technologies except terrestrial mobile wireless. Provider data are from FCC Form 477 Part VI. The census tract boundaries are from ESRI. For more information about census tracts please see Census 2000 Summary File 3 Technical Documentation, page A-11. U.S. Federal Communications Commission Internet Access Services: Status as of June 30, 2011 65
  13. Symbology Providers (Mobile Wireless) Zero 1 to 3 4 to

    6 7 or more Map 6 Providers of Mobile Connections over 200 kbps in at Least One Direction by Census Tract as of June 30, 2011 P u e r t o R i c o P u e r t o R i c o H a w a i i H a w a i i A l a s k a A l a s k a This map shows the number of potential providers of mobile connections with information transfer rates greater than 200 kbps in at least one direction by census tract. Providers are counted if they indicate that service is available in a tract over a network the provider operates. Provider data are from FCC Form 477 Part VI. The census tract boundaries are from ESRI. For more information about census tracts please see Census 2000 Summary File 3 Technical Documentation, page A-11. U.S. Federal Communications Commission Internet Access Services: Status as of June 30, 2011 66