Upgrade to Pro — share decks privately, control downloads, hide ads and more …

The Trees, the Forest, and the Passion for Prints

The Trees, the Forest, and the Passion for Prints

Matthew Lincoln

July 22, 2015
Tweet

More Decks by Matthew Lincoln

Other Decks in Research

Transcript

  1. The Trees, the Forest, and the Passion for Prints Networks

    of Dutch Print Production, 1500-1750 Matthew Lincoln University of Maryland @matthewdlincoln July 22, 2015 Keystone Digital Humanities Conference
  2. “Sculptura in Æs”, from Johannes Stradanus’ Nova Reperta. Published by

    Philips Galle, c. 1588-1605. British Museum, London. What evidence can thousands of prints give us?
  3. Designer “Sculptura in Æs”, from Johannes Stradanus’ Nova Reperta. Published

    by Philips Galle, c. 1588-1605. British Museum, London.
  4. Engraver Designer “Sculptura in Æs”, from Johannes Stradanus’ Nova Reperta.

    Published by Philips Galle, c. 1588-1605. British Museum, London.
  5. Publisher Designer Engraver “Sculptura in Æs”, from Johannes Stradanus’ Nova

    Reperta. Published by Philips Galle, c. 1588-1605. British Museum, London.
  6. British Museum collections LOD: collection.britishmuseum.org Between 1500-1750: •  49,306 prints

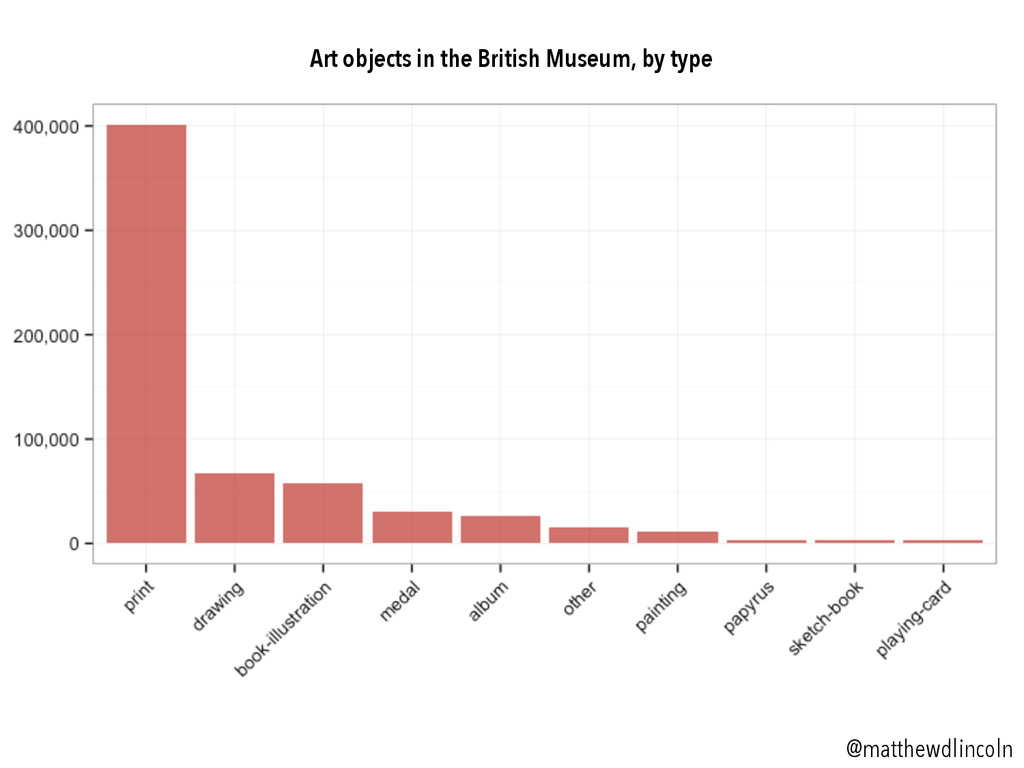
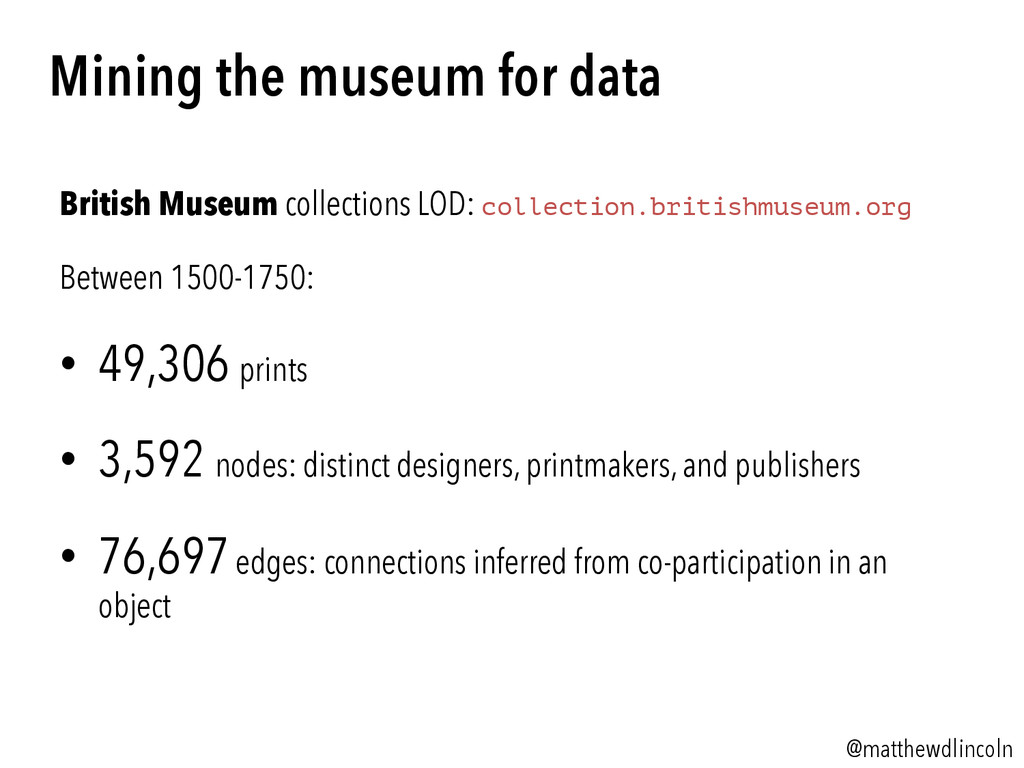
    •  3,592 nodes: distinct designers, printmakers, and publishers •  76,697 edges: connections inferred from co-participation in an object Mining the museum for data @matthewdlincoln
  7. @matthewdlincoln 1.  Create a set of subgraphs based on a

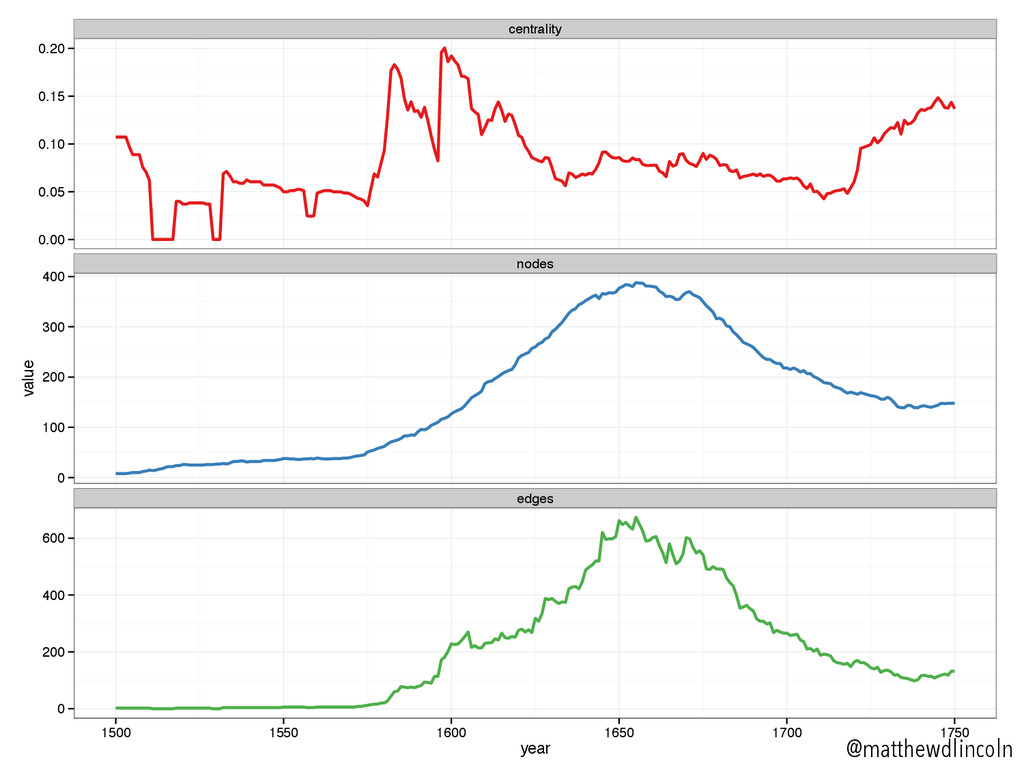
    rolling 10-year window: •  e.g. the 1640 subgraph contains only edges and nodes extant between 1635 and 1645 •  Edges (prints) exist between the start and end dates ascribed to an object o  Edges are unweighted to avoid biasing edge strength based on the number of surviving impressions (complicated!) •  Nodes (artists) exist during their life dates (also complicated!) 2.  For each subgraph, calculate network metrics at the global, regional/national, and individual scale Dynamic network analysis
  8. @matthewdlincoln 1. Did the northern Netherlands adopt and continue the highly-centralized

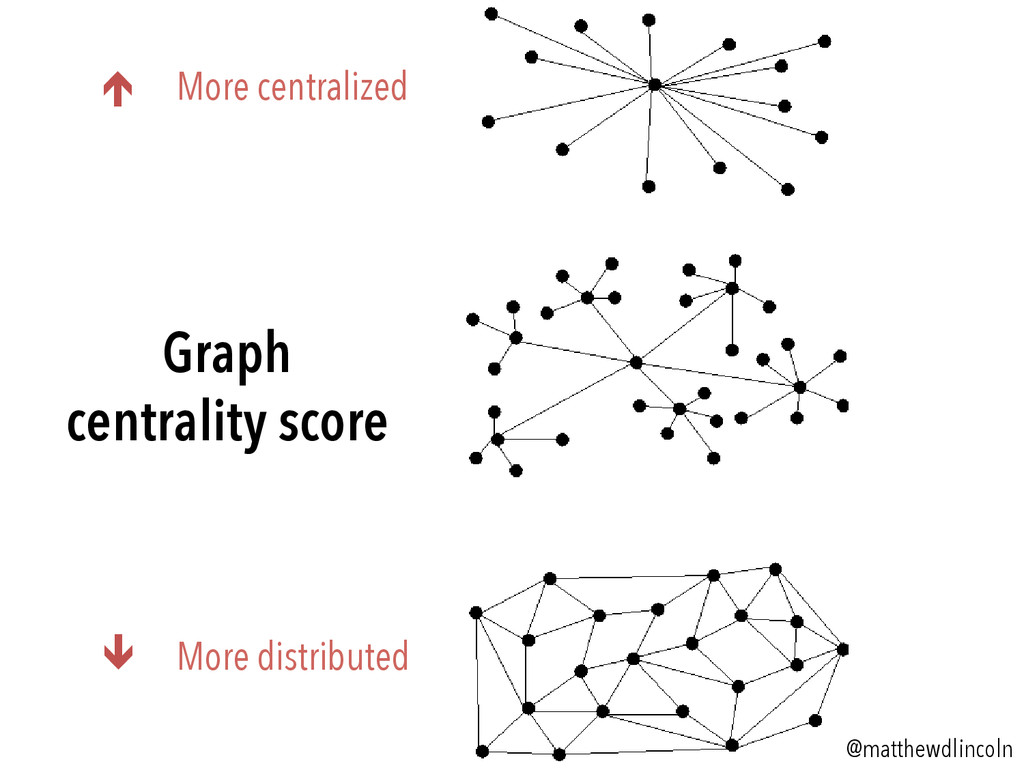
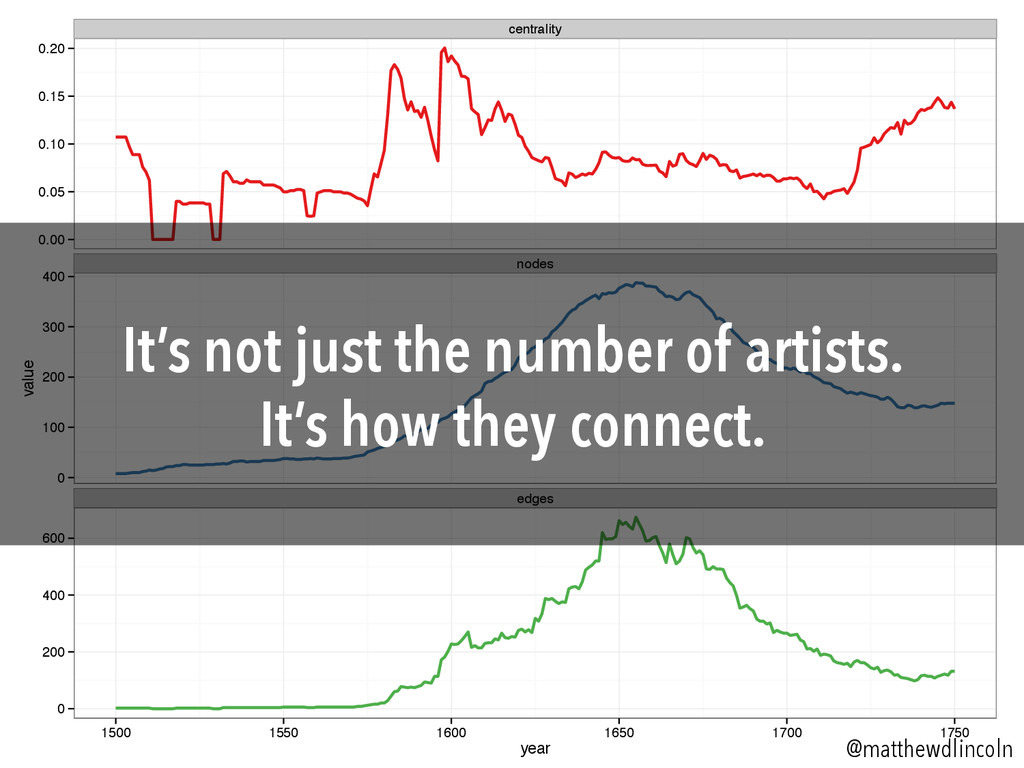
    Antwerp print production model through the seventeenth century? OR… 2. Did rising Dutch prosperity instead support a more distributed network of local print markets? My question: centralized production
  9. @matthewdlincoln é More centralized ê More distributed 0.00 0.05 0.10

    0.15 0.20 1500 1550 1600 1650 1700 1750 year graph centrality score é More centralized ê More distributed @matthewdlincoln
  10. 0.00 0.05 0.10 0.15 0.20 1500 1550 1600 1650 1700

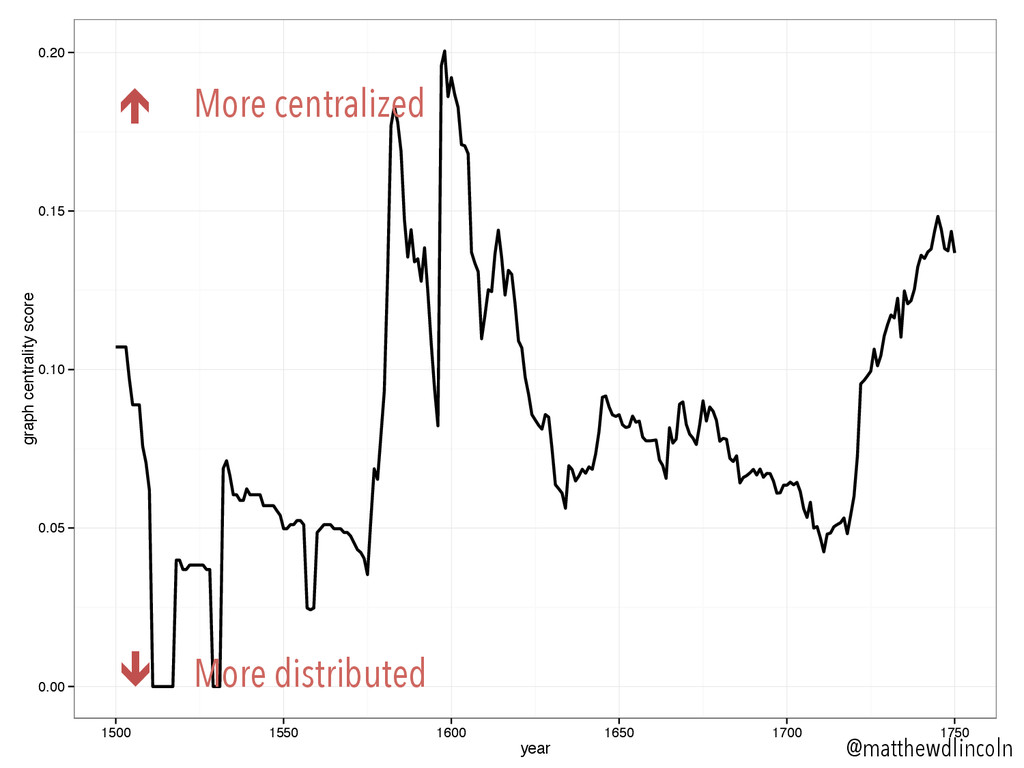
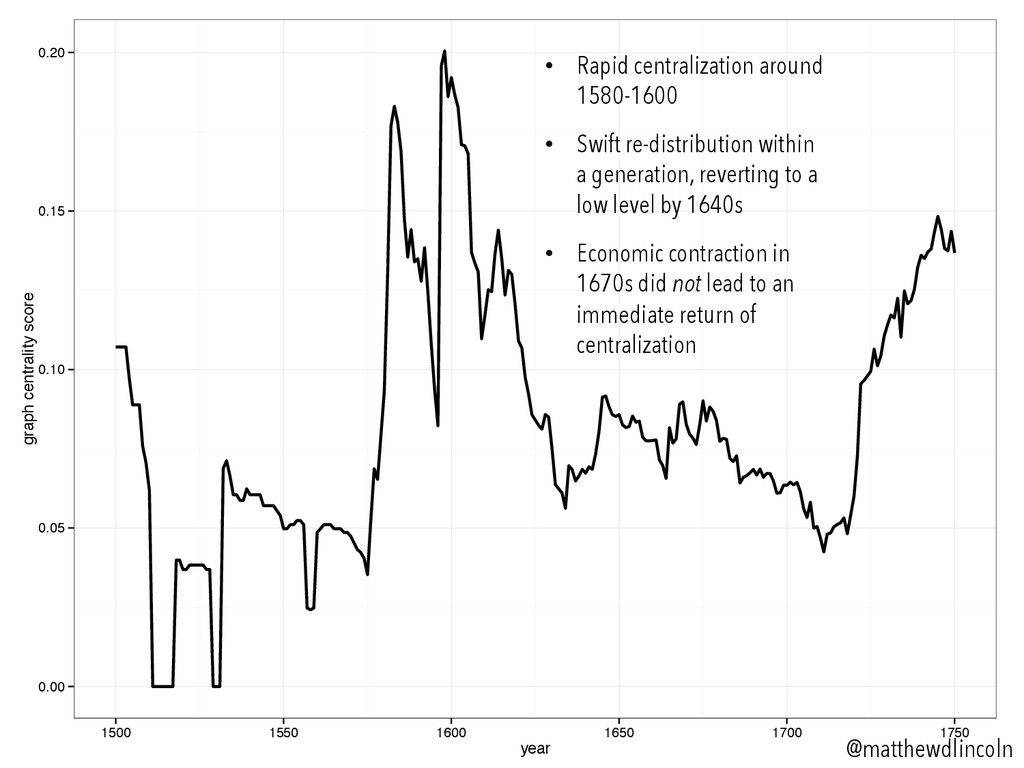
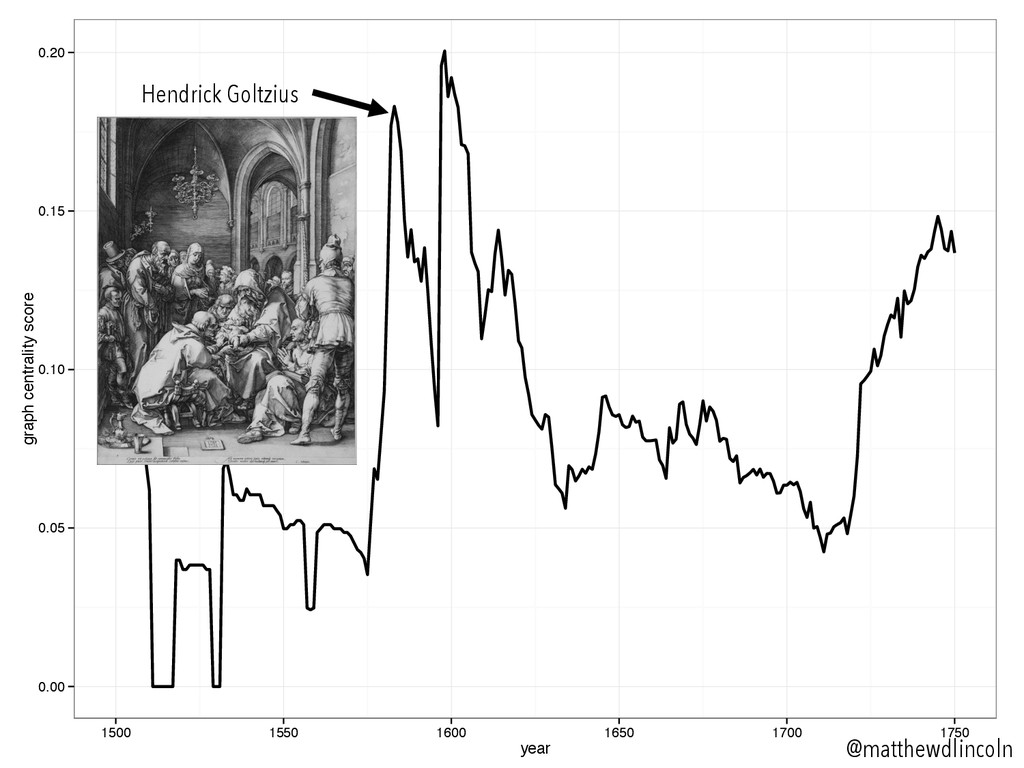
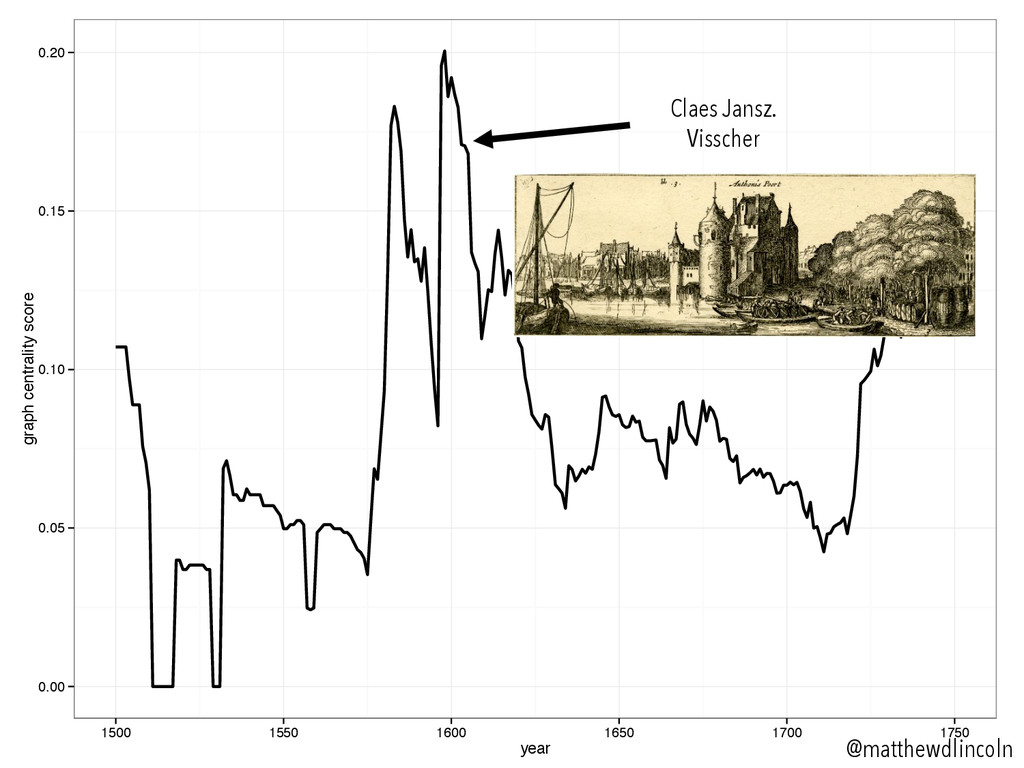
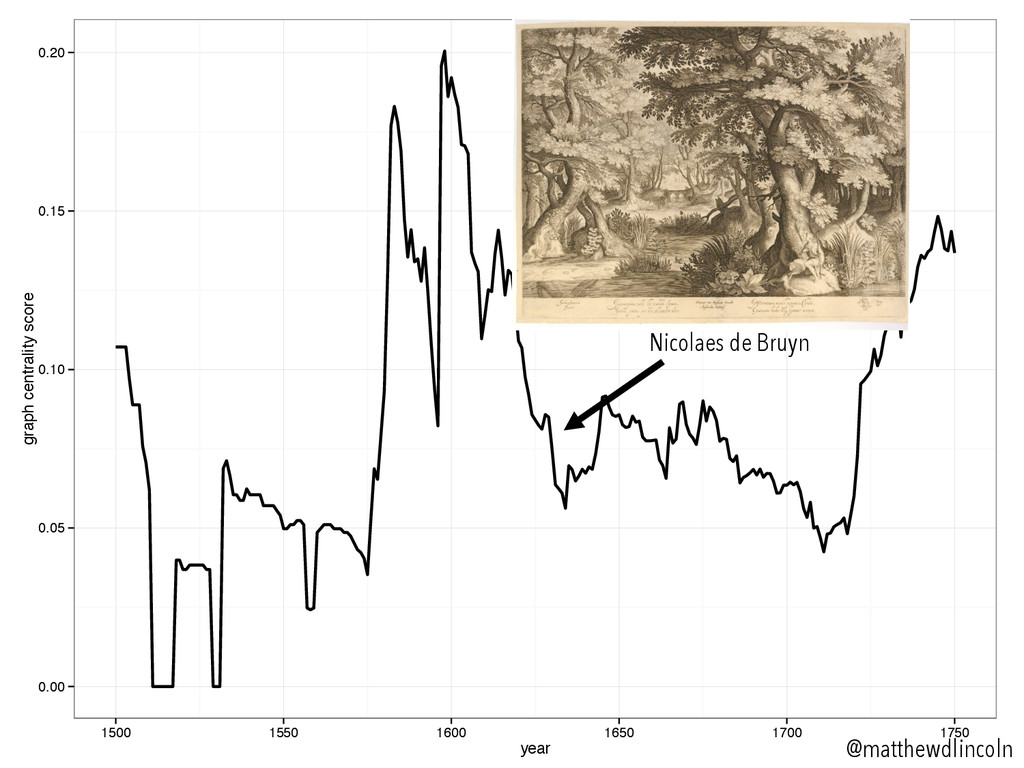
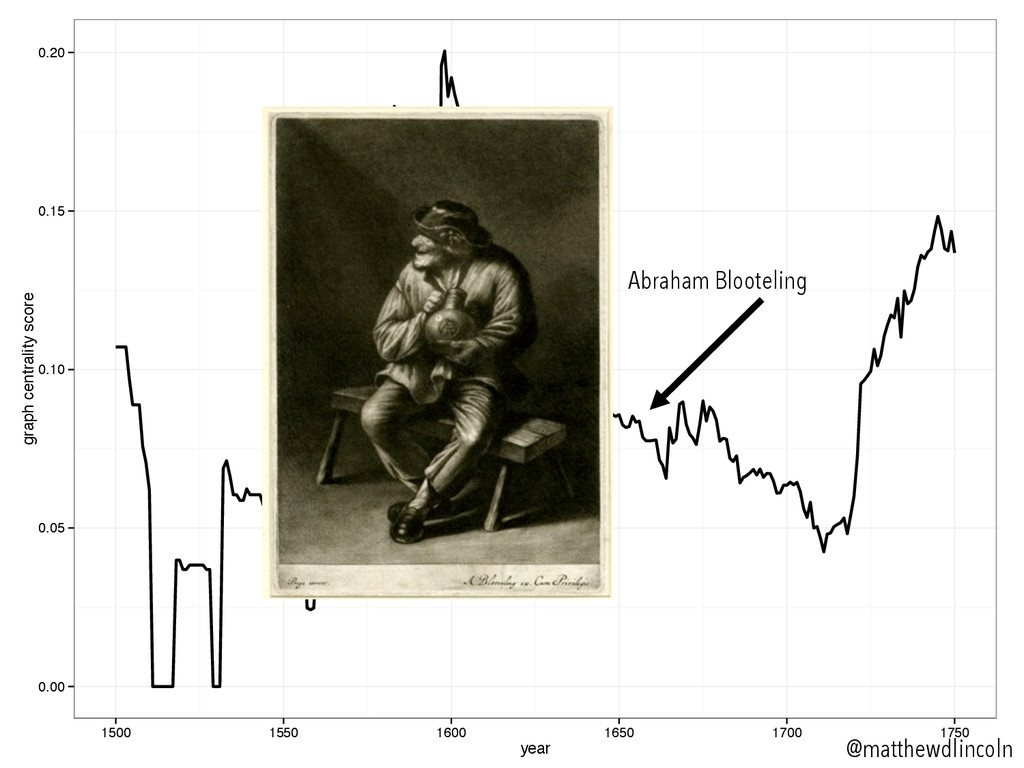
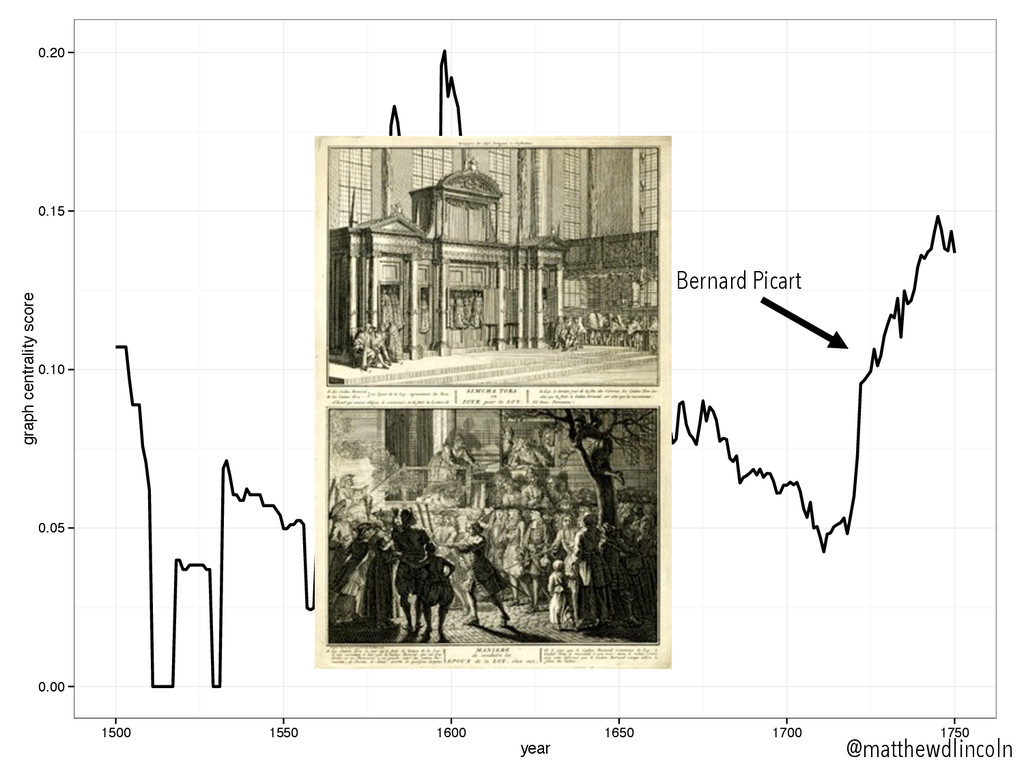
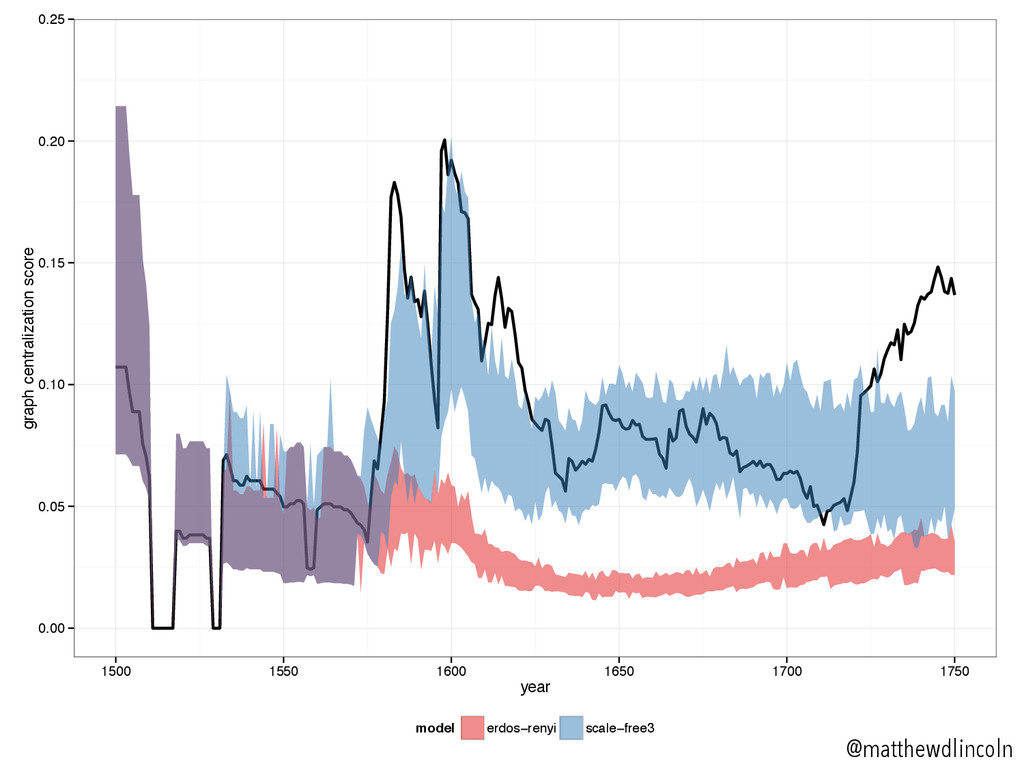
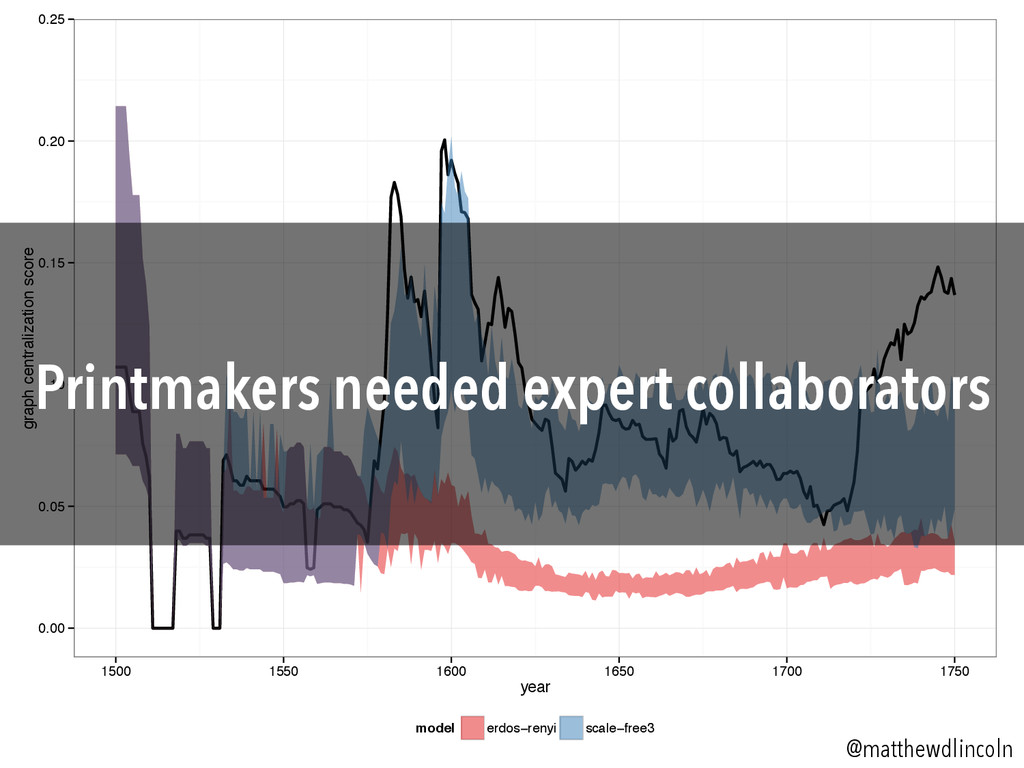
    1750 year graph centrality score @matthewdlincoln •  Rapid centralization around 1580-1600 •  Swift re-distribution within a generation, reverting to a low level by 1640s •  Economic contraction in 1670s did not lead to an immediate return of centralization
  11. 0.00 0.05 0.10 0.15 0.20 1500 1550 1600 1650 1700

    1750 year graph centrality score @matthewdlincoln Lucas van Leyden
  12. 0.00 0.05 0.10 0.15 0.20 1500 1550 1600 1650 1700

    1750 year graph centrality score @matthewdlincoln Hendrick Goltzius
  13. 0.00 0.05 0.10 0.15 0.20 1500 1550 1600 1650 1700

    1750 year graph centrality score @matthewdlincoln Claes Jansz. Visscher
  14. 0.00 0.05 0.10 0.15 0.20 1500 1550 1600 1650 1700

    1750 year graph centrality score @matthewdlincoln Nicolaes de Bruyn
  15. 0.00 0.05 0.10 0.15 0.20 1500 1550 1600 1650 1700

    1750 year graph centrality score @matthewdlincoln Abraham Blooteling
  16. 0.00 0.05 0.10 0.15 0.20 1500 1550 1600 1650 1700

    1750 year graph centrality score @matthewdlincoln Bernard Picart
  17. centrality nodes edges 0.00 0.05 0.10 0.15 0.20 0 100

    200 300 400 0 200 400 600 1500 1550 1600 1650 1700 1750 year value @matthewdlincoln
  18. centrality nodes edges 0.00 0.05 0.10 0.15 0.20 0 100

    200 300 400 0 200 400 600 1500 1550 1600 1650 1700 1750 year value @matthewdlincoln It’s not just the number of artists. It’s how they connect.
  19. @matthewdlincoln BUT WAIT We want to avoid “just-so” stories! How

    do we know if this theoretical explanation makes sense?
  20. Simulation time @matthewdlincoln IF our simulated network metrics appear similar

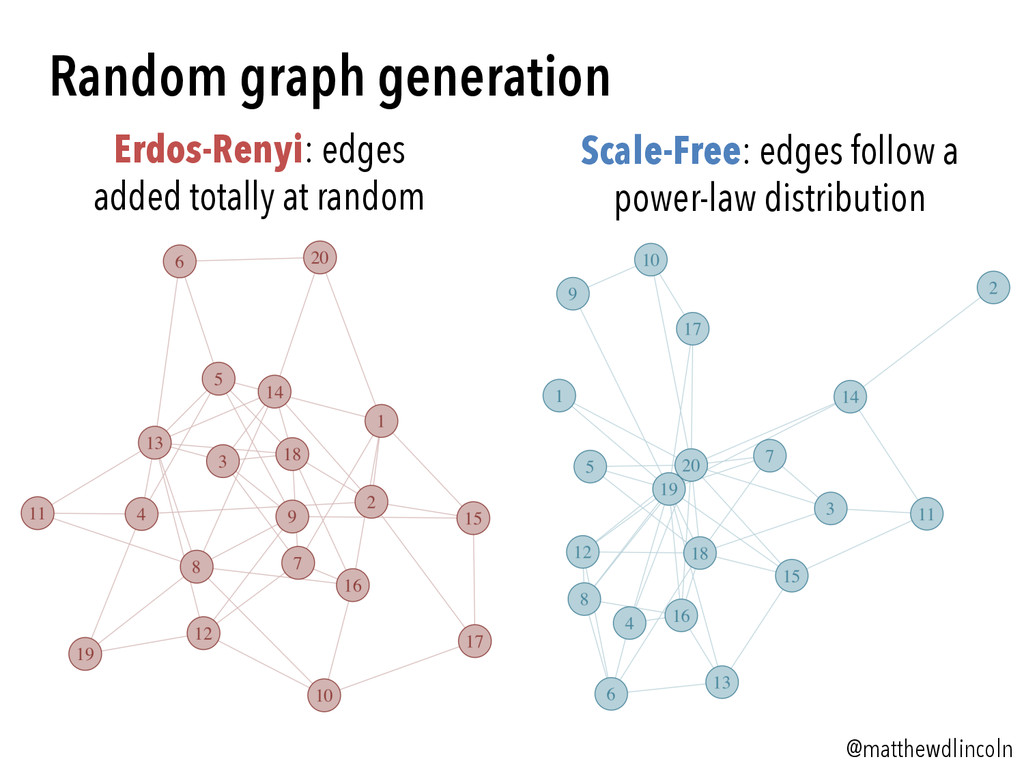
    to the observed network metrics from our dataset, THEN we can feel more confident about our proposed explanation. Let’s create a simulation w/ actor behavior we are proposing.
  21. Erdos-Renyi: edges added totally at random Random graph generation Scale-Free:

    edges follow a power-law distribution @matthewdlincoln
  22. 0.00 0.05 0.10 0.15 0.20 0.25 1500 1550 1600 1650

    1700 1750 year graph centralization score model erdos−renyi scale−free3 @matthewdlincoln
  23. 0.00 0.05 0.10 0.15 0.20 0.25 1500 1550 1600 1650

    1700 1750 year graph centralization score model erdos−renyi scale−free3 @matthewdlincoln Printmakers needed expert collaborators
  24. 0.00 0.05 0.10 0.15 0.20 0.25 1500 1550 1600 1650

    1700 1750 year graph centralization score model erdos−renyi scale−free3 @matthewdlincoln Networks deserve metrics, not just viz. They also need simulation, not just speculation