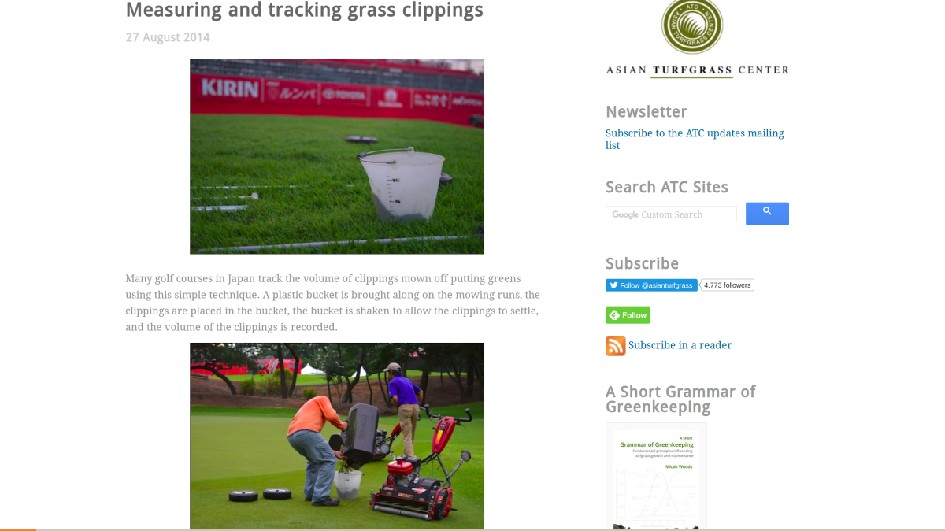
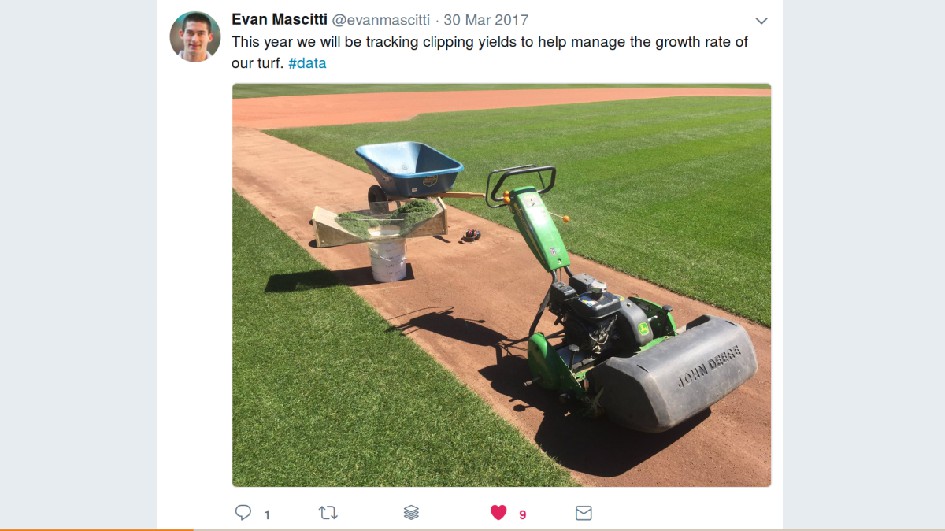
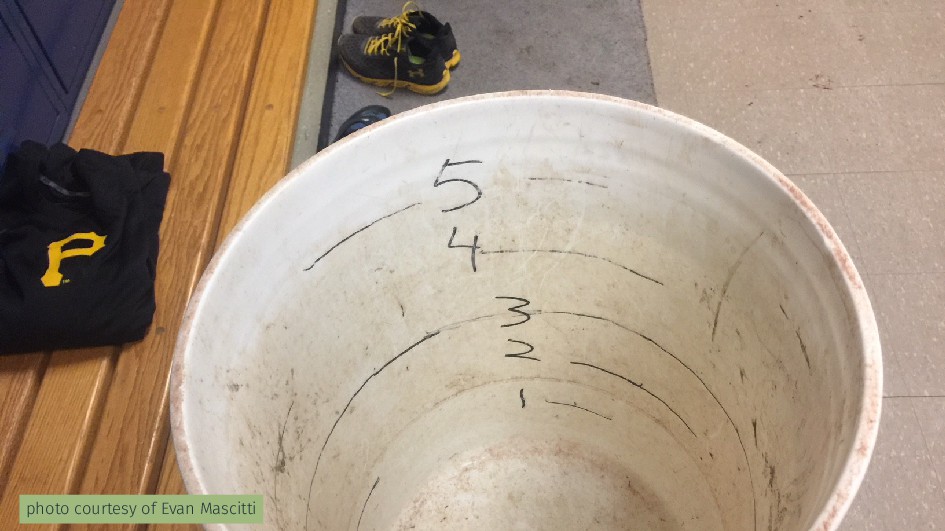
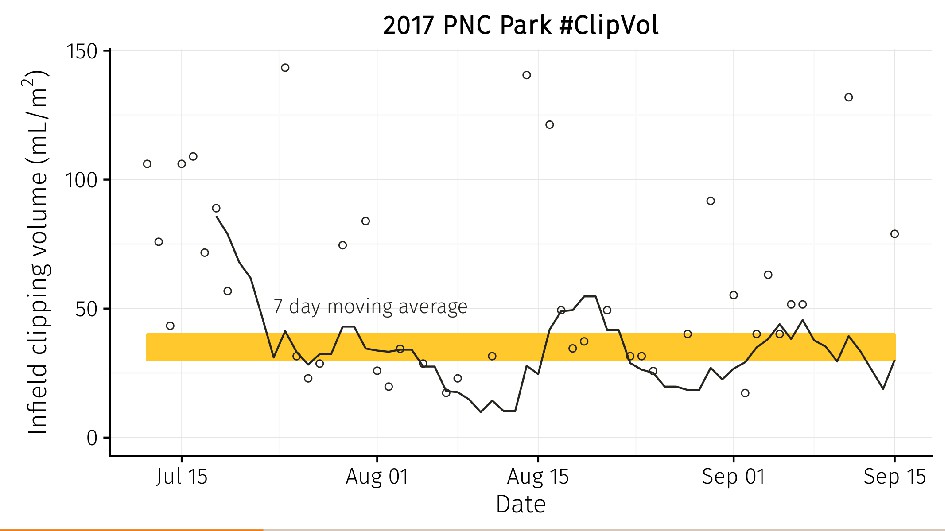
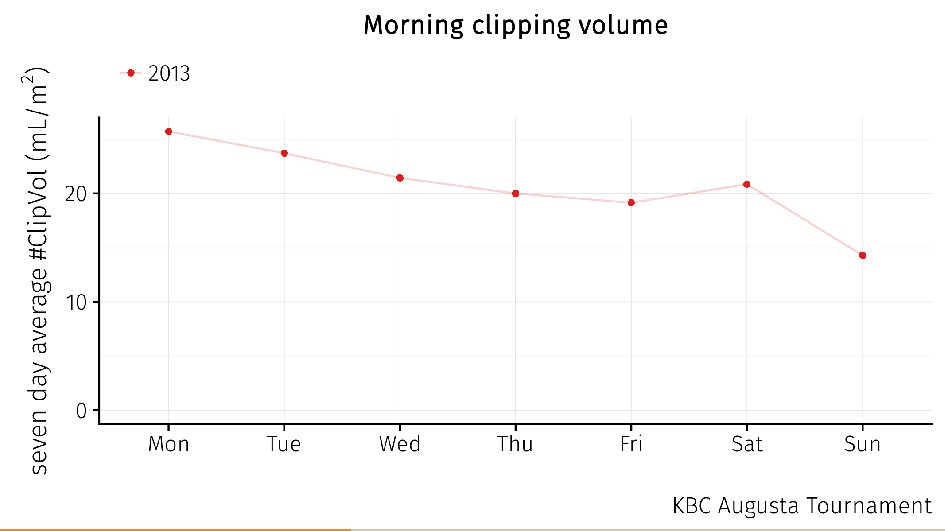
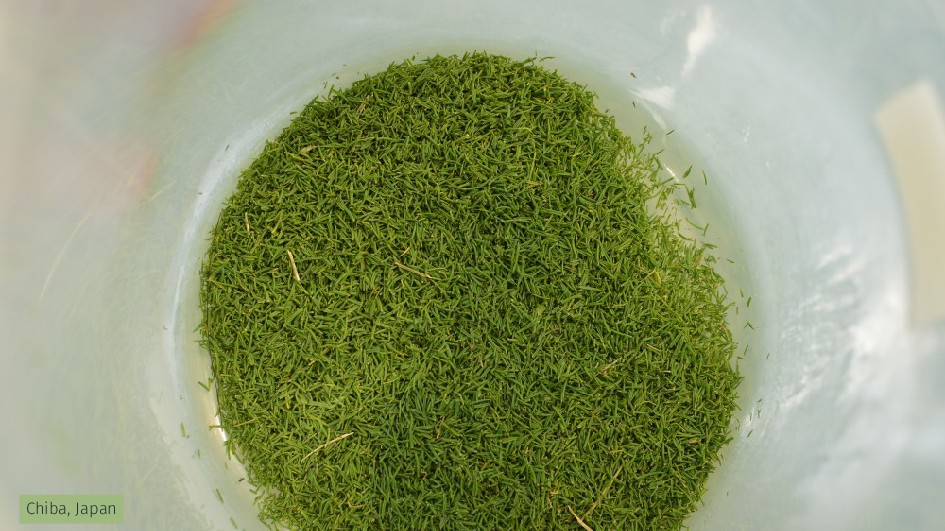
Everyone checks the growth of the grass by counting basket empties or other more subjective evaluations of how rapidly the grass is growing. Measuring the volume of clippings mown from an area, and then reporting it as volume per area, is an exciting measurement that represents directly the overall objective of turfgrass management -- modifying the growth rate of the grass to create the desired playing surface.
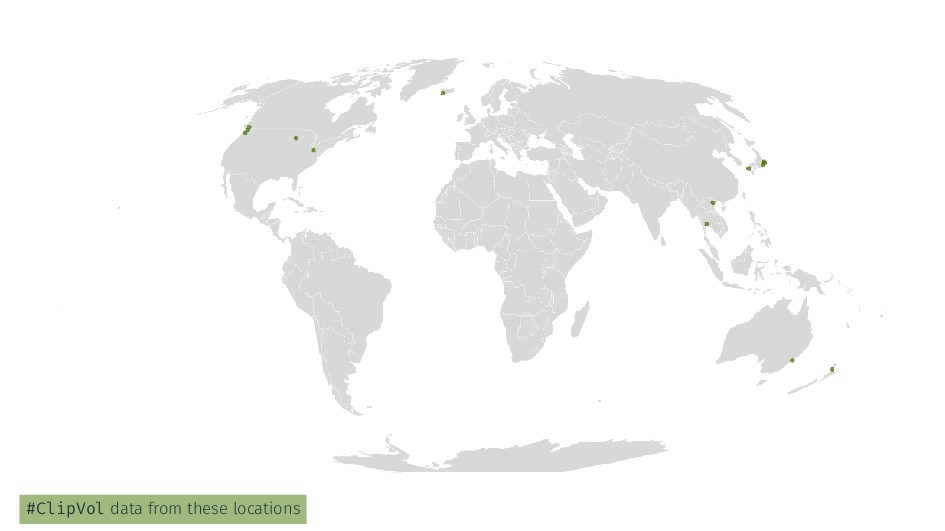
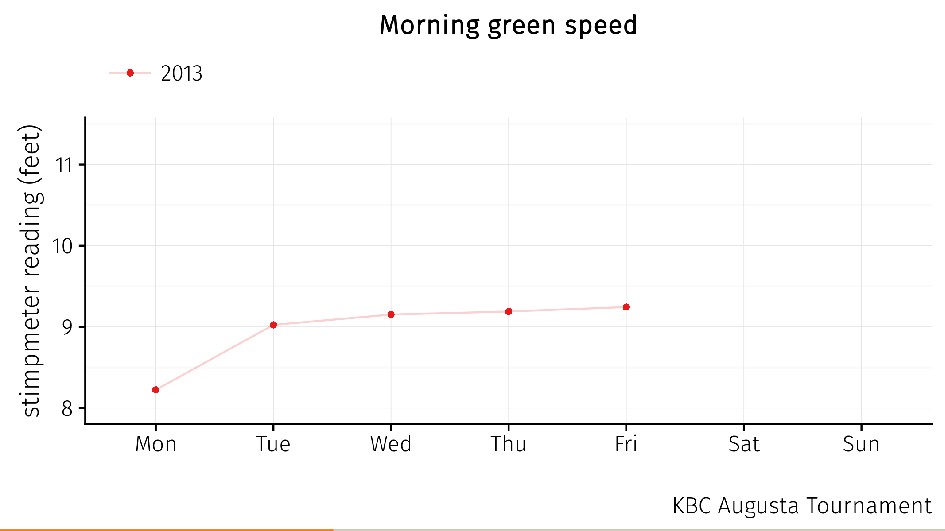
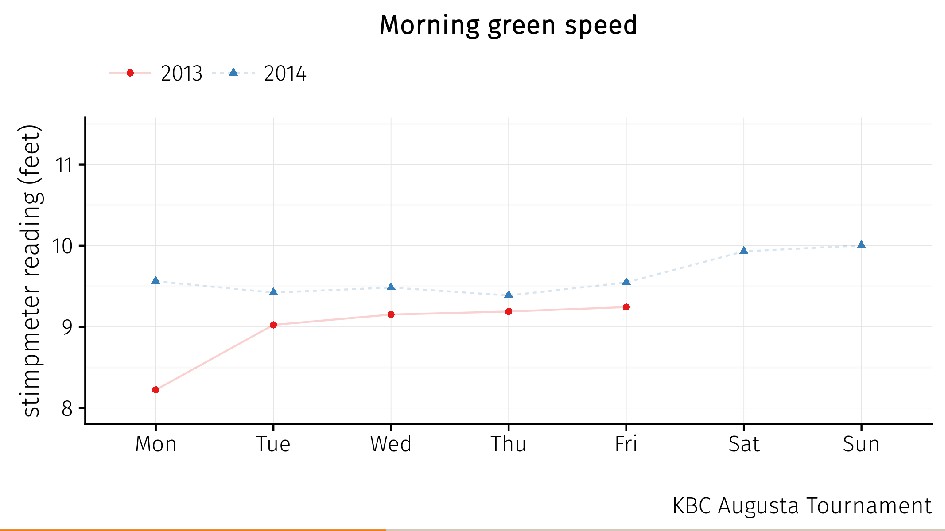
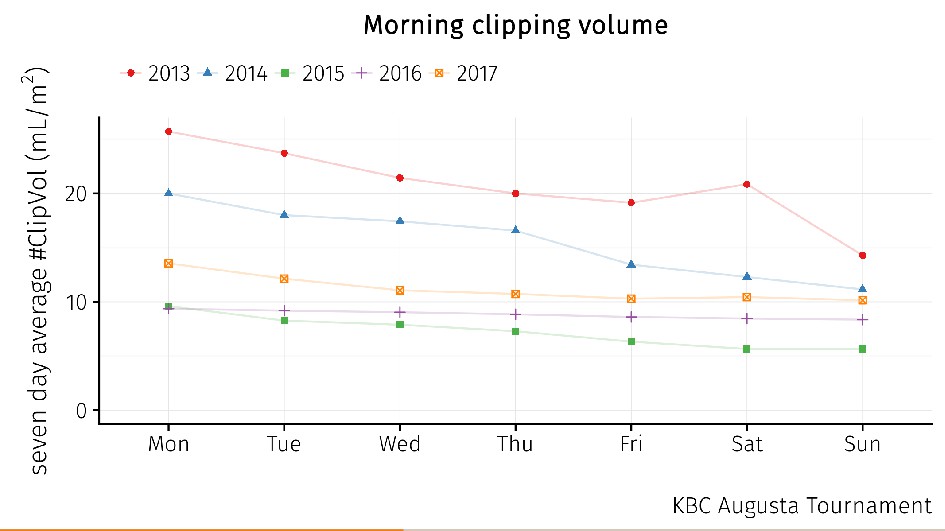
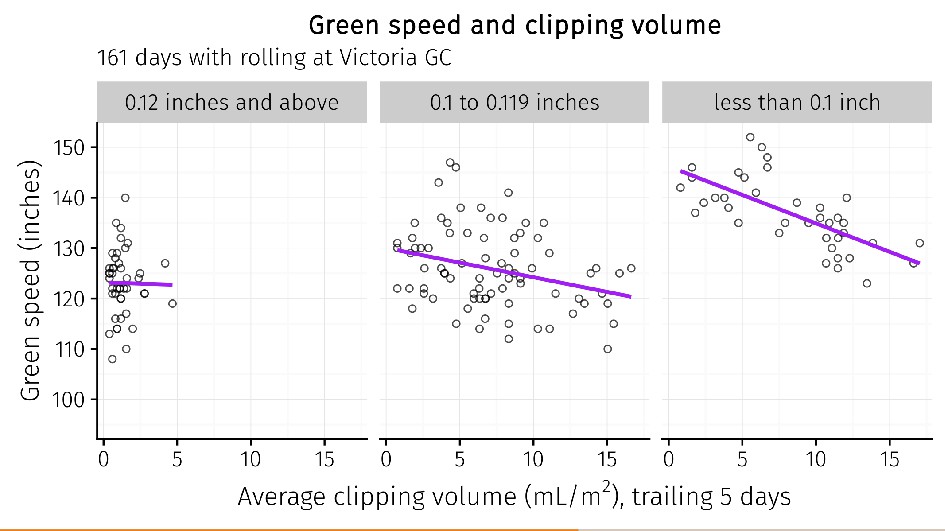
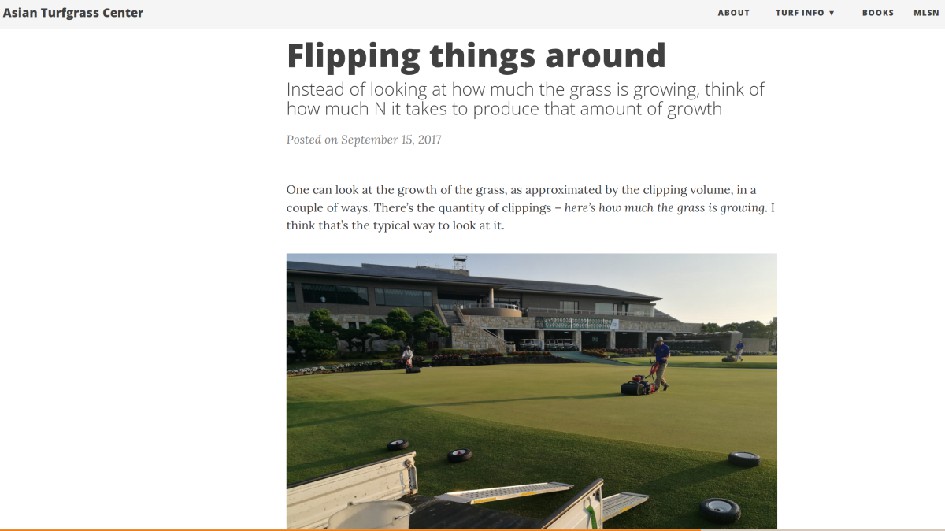
I shared data and case studies from around the world to explain how this measurement works and why the simple measurement of clipping volume has so many exciting implications for golf course maintenance. These include improved management (or optimization) of surface consistency, green speed, topdressing, and more.