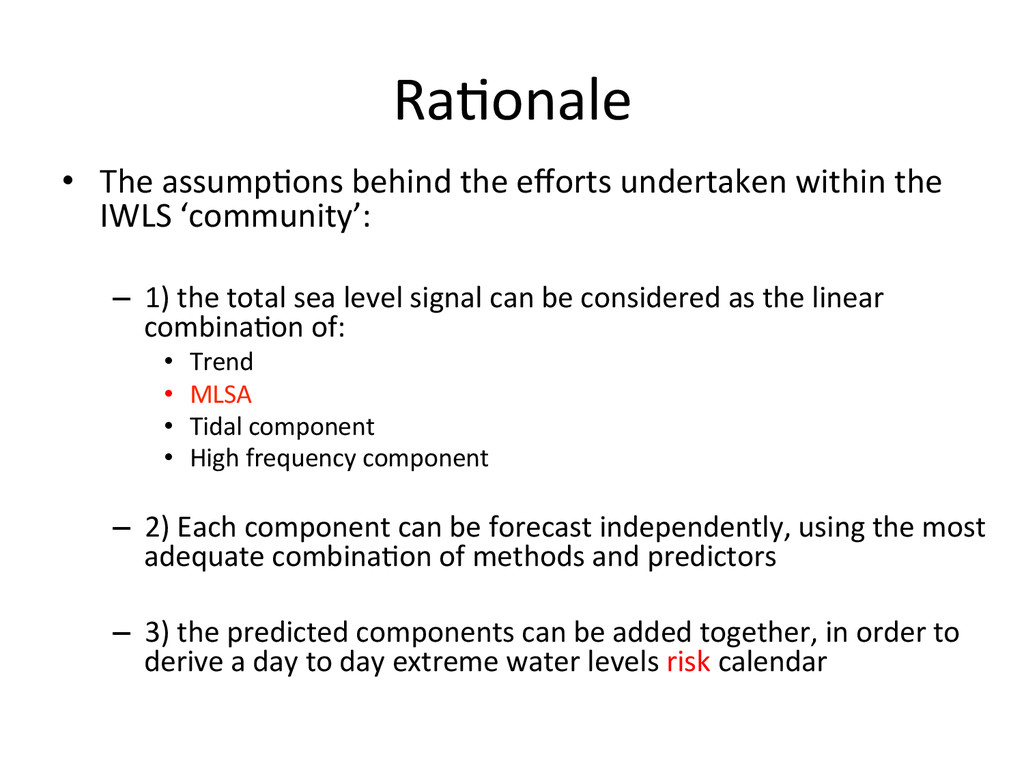
the IWLS ‘community’: – 1) the total sea level signal can be considered as the linear combina-on of: • Trend • MLSA • Tidal component • High frequency component – 2) Each component can be forecast independently, using the most adequate combina-on of methods and predictors – 3) the predicted components can be added together, in order to derive a day to day extreme water levels risk calendar
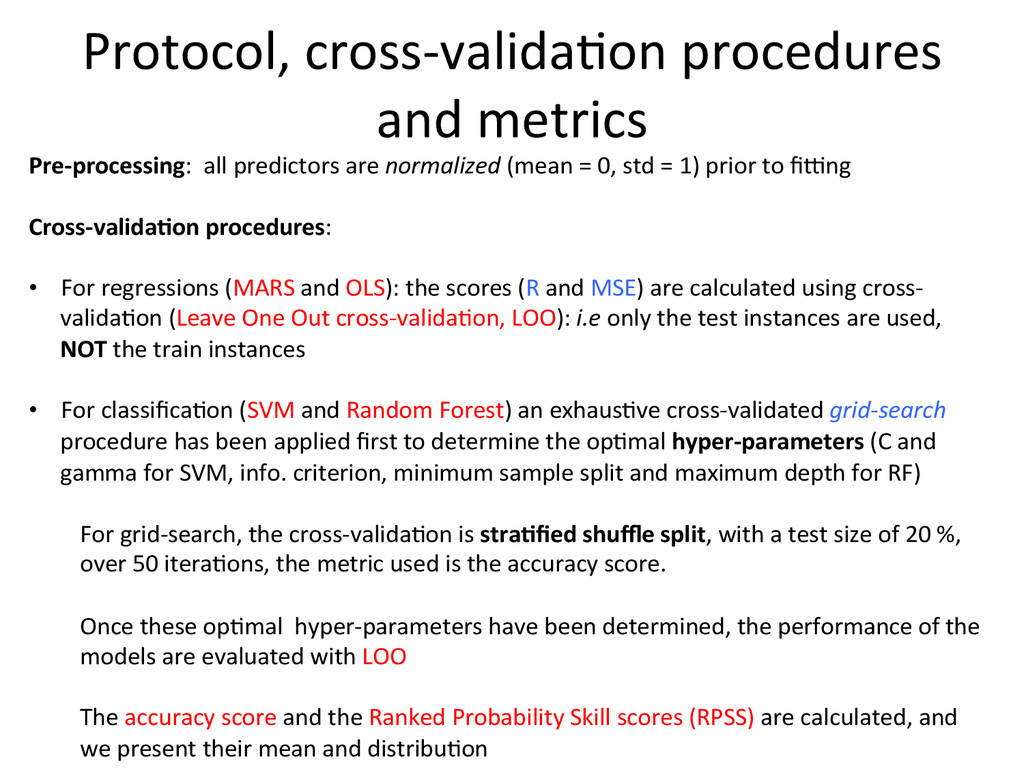
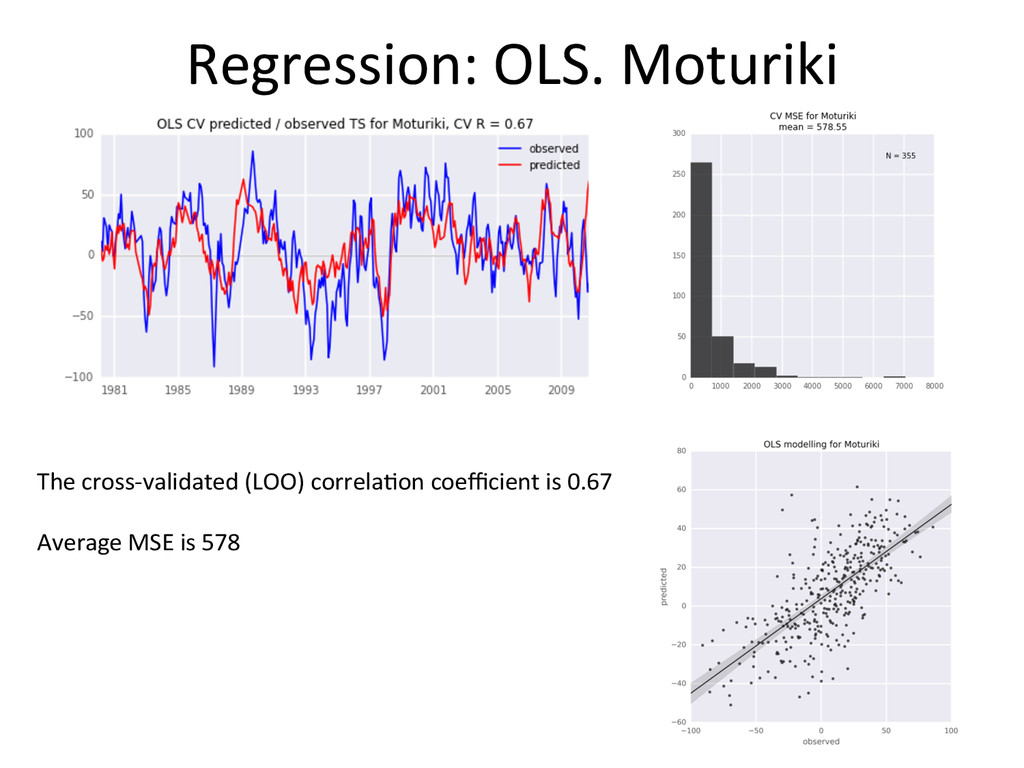
predictors are normalized (mean = 0, std = 1) prior to fieng Cross-‐valida1on procedures: • For regressions (MARS and OLS): the scores (R and MSE) are calculated using cross-‐ valida-on (Leave One Out cross-‐valida-on, LOO): i.e only the test instances are used, NOT the train instances • For classifica-on (SVM and Random Forest) an exhaus-ve cross-‐validated grid-‐search procedure has been applied first to determine the op-mal hyper-‐parameters (C and gamma for SVM, info. criterion, minimum sample split and maximum depth for RF) For grid-‐search, the cross-‐valida-on is stra1fied shuffle split, with a test size of 20 %, over 50 itera-ons, the metric used is the accuracy score. Once these op-mal hyper-‐parameters have been determined, the performance of the models are evaluated with LOO The accuracy score and the Ranked Probability Skill scores (RPSS) are calculated, and we present their mean and distribu-on
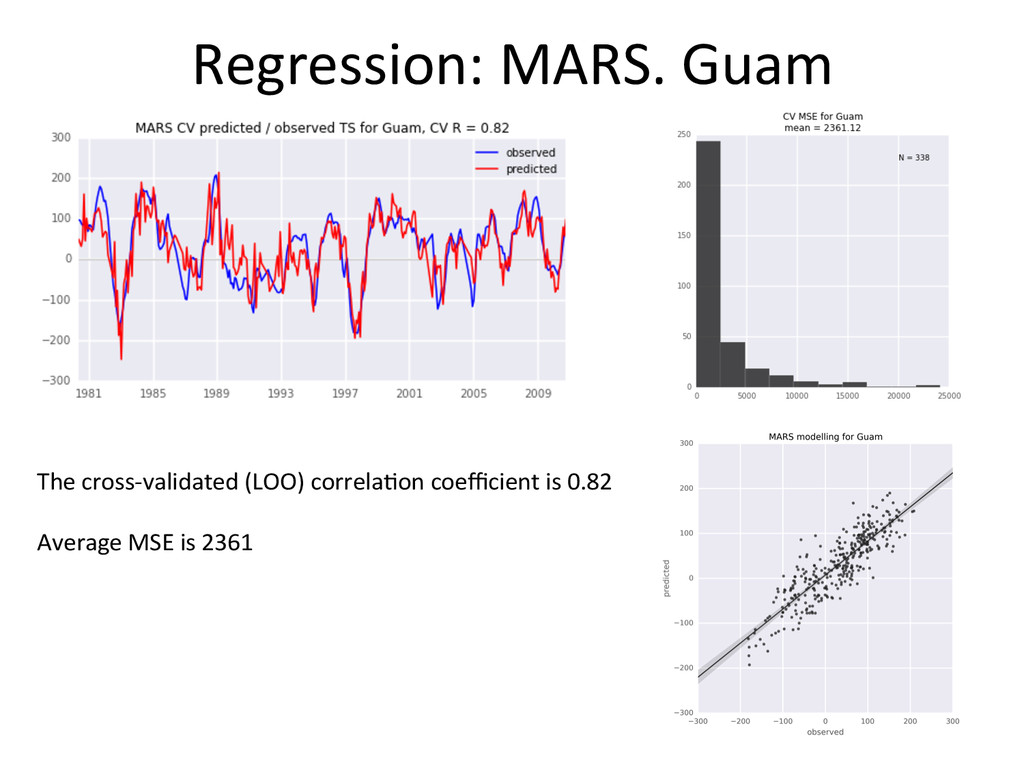
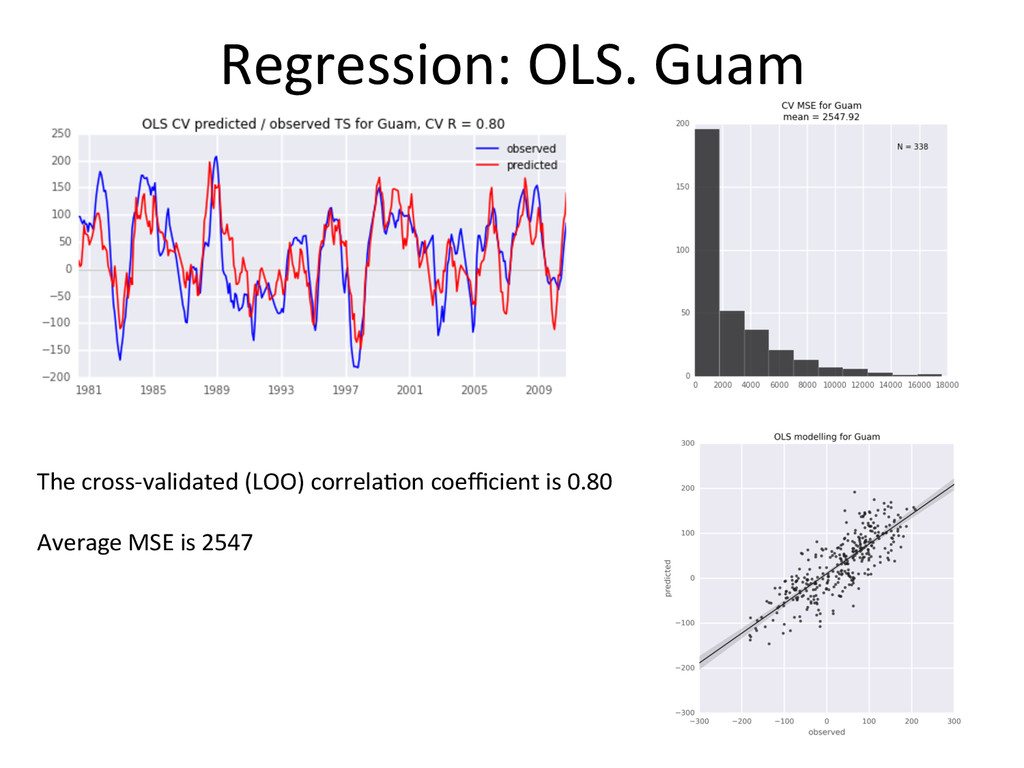
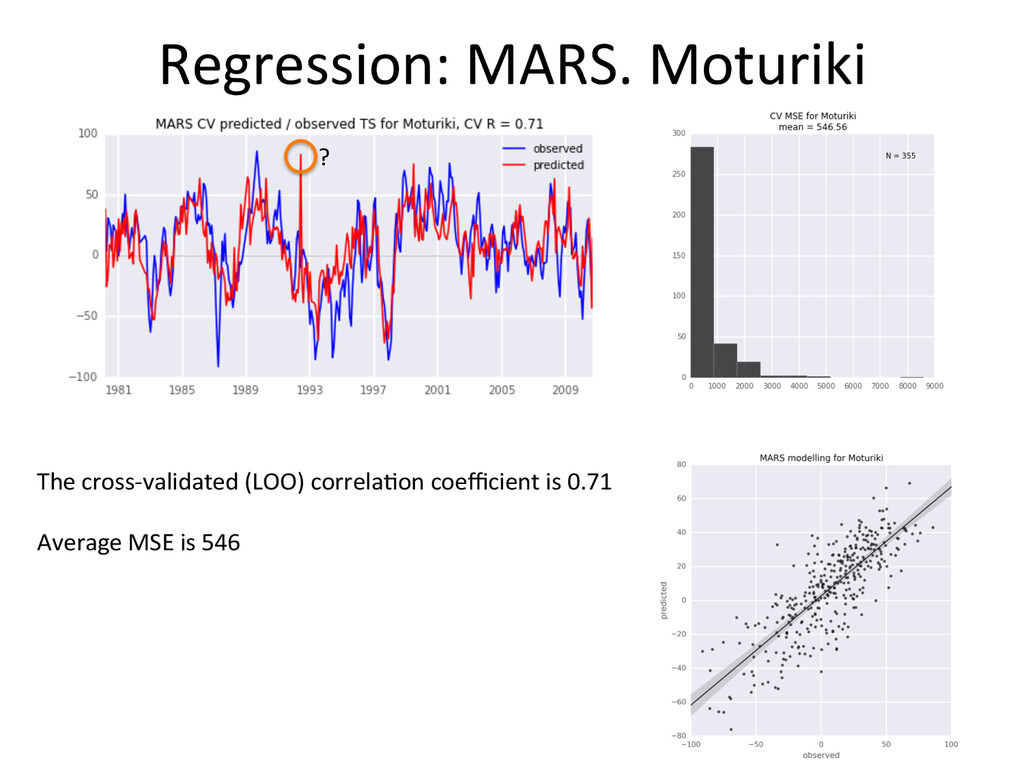
performs systema-cally beker than Ordinary Least Squares • The advantage is not huge (both in terms of MSE and R) • MARS models are more complex, and slightly more demanding computa-onally • I s-ll would go with MARS
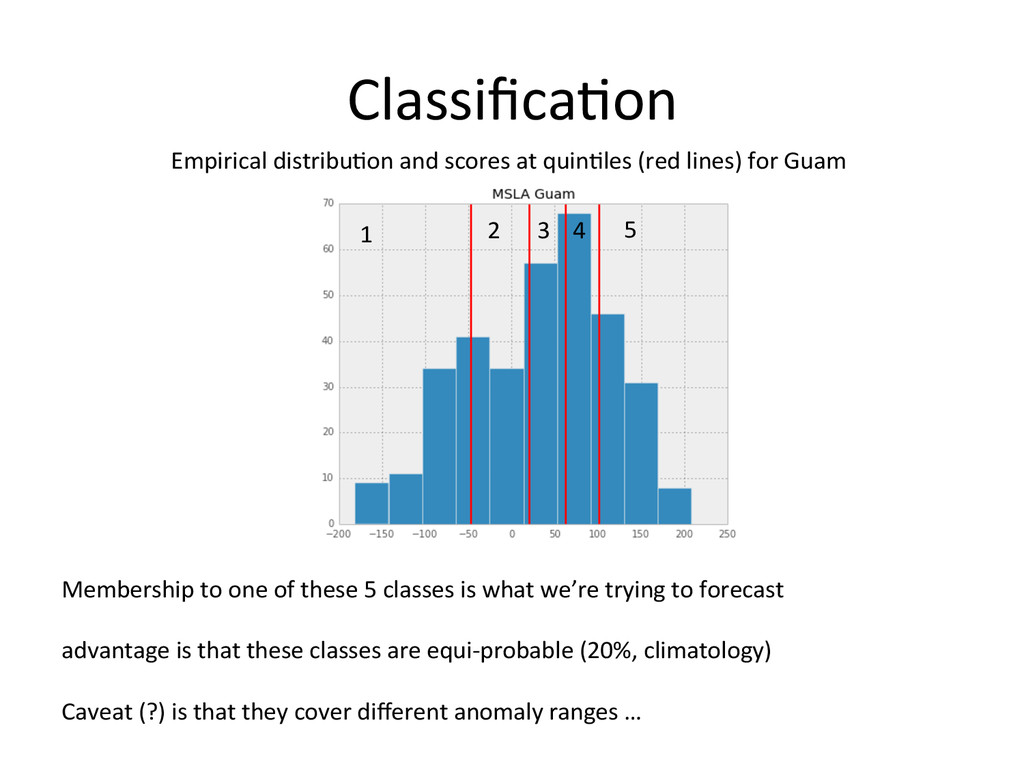
for Guam 1 2 3 4 5 Membership to one of these 5 classes is what we’re trying to forecast advantage is that these classes are equi-‐probable (20%, climatology) Caveat (?) is that they cover different anomaly ranges …
when we add the -dal component to the MSLA: 1) pick the predicted category 2) A PDF is derived from the values falling into that category (e.g. the extreme values in cat 1 are less likely than the less extreme): Kernel Density Es-ma-on can be used instead of using a parametric approach 3) Use the approach developed by Scok and Rob (convolve the CDFs) 4) Risk can be expressed in terms of probability of exceeding the highest kind -de level or some otherwise meaningful threshold
gives C = 1.29, gamma = 0.46 Cross-‐validated (LOO) accuracy score ~= 0.75 (depending on the grid-‐search runs) This score can probably be improved if using a more fine-‐grained grid-‐search and more itera-ons (but very expensive computa-onally, needs to be fully parallelized)
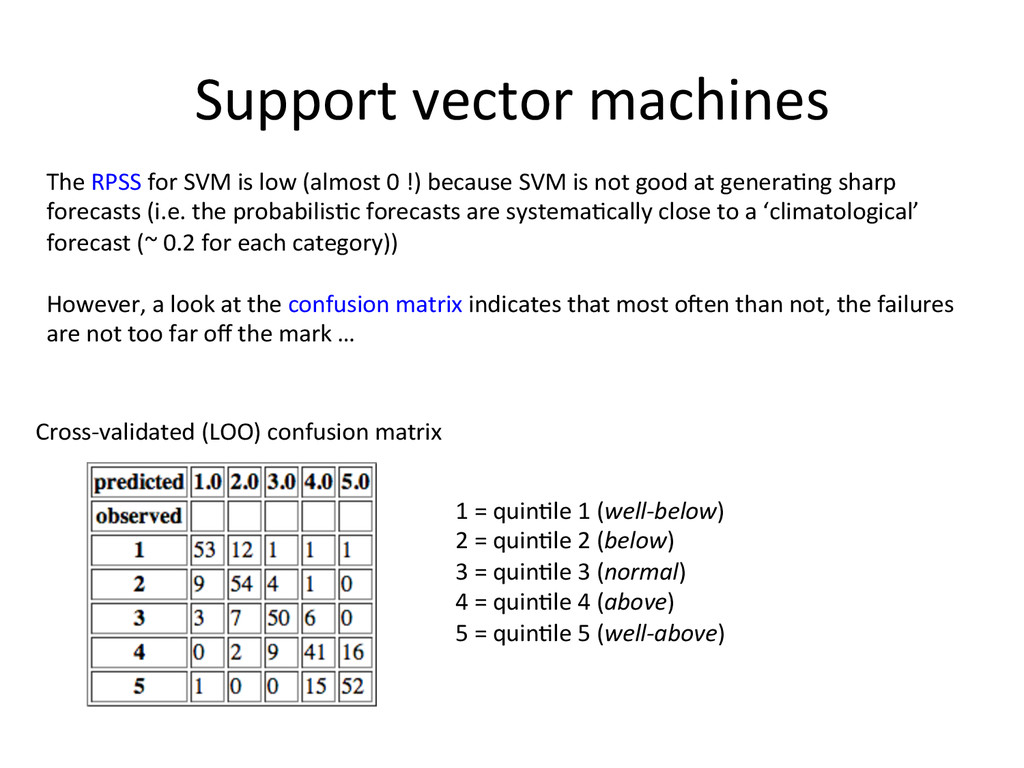
RPSS for SVM is low (almost 0 !) because SVM is not good at genera-ng sharp forecasts (i.e. the probabilis-c forecasts are systema-cally close to a ‘climatological’ forecast (~ 0.2 for each category)) However, a look at the confusion matrix indicates that most oqen than not, the failures are not too far off the mark … 1 = quin-le 1 (well-‐below) 2 = quin-le 2 (below) 3 = quin-le 3 (normal) 4 = quin-le 4 (above) 5 = quin-le 5 (well-‐above)
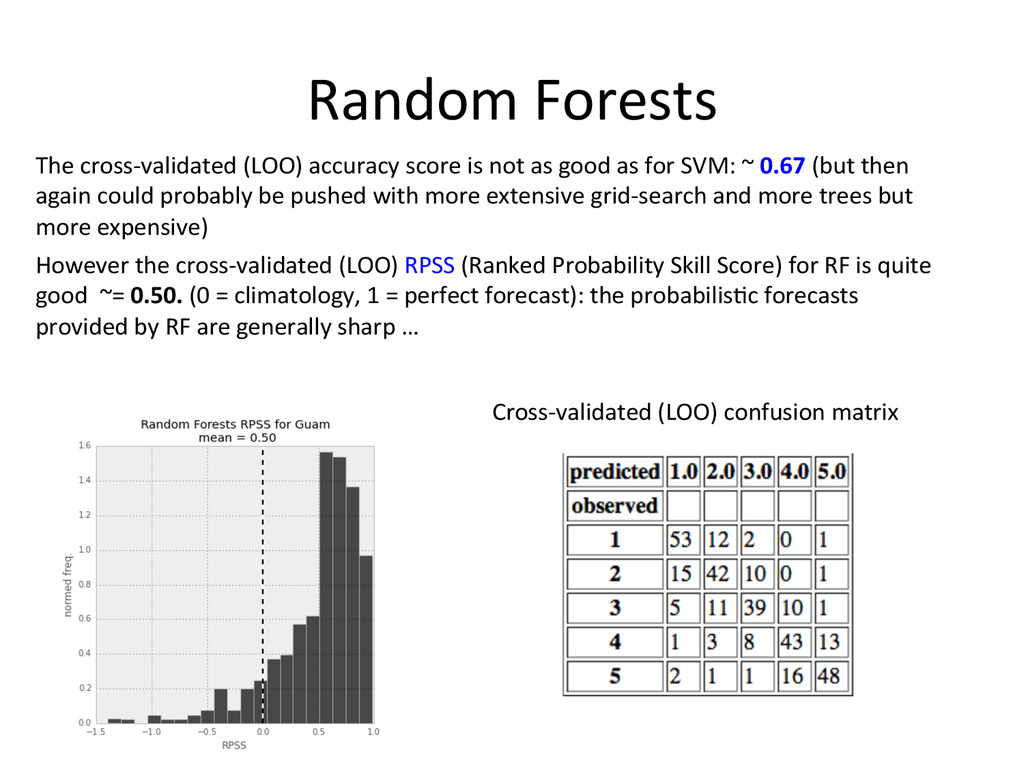
Skill Score) for RF is quite good ~= 0.50. (0 = climatology, 1 = perfect forecast): the probabilis-c forecasts provided by RF are generally sharp … The cross-‐validated (LOO) accuracy score is not as good as for SVM: ~ 0.67 (but then again could probably be pushed with more extensive grid-‐search and more trees but more expensive) Cross-‐validated (LOO) confusion matrix
performs beker than RF in terms of accuracy • The accuracy could probably be improved further • Its confusion matrix has beker proper-es • However the probabilis-c forecasts provided by SVM are not sharp, resul-ng in poor Ranked Probability Skill Scores • In an opera-onal seeng I would use both and see how they agree, if not, pick the category predicted by SVM
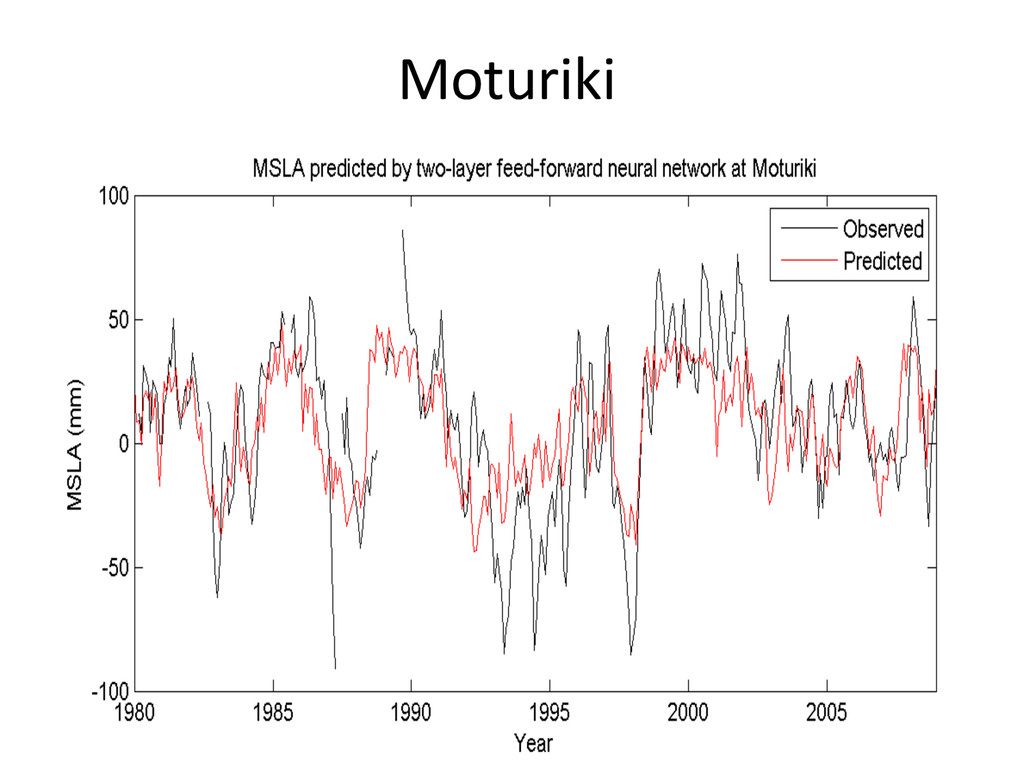
models, the antecedent MSLA value (let’s say the last monthly or 3 monthly value) is NOT included in the predictors set, mainly because it is not available in real-‐-me … • Scok has demonstrated excellent valida-on scores for a Non-‐linear autoregressive neural network with external input (NARX), which includes past values of the -me-‐series. • We don’t have the real sta-on data in real-‐-me • But we could possibly use real-‐-me MSLA from satellite al-metry • The first step would be to perform a simple linear regression between MSLA satellite and MSLA observed over the common period, so that we can use satellite MSLA to model current sta-on MSLA