$30 off During Our Annual Pro Sale. View Details »

3D vs. Conventional Volcanic Hazard Maps

3D vs. Conventional Volcanic Hazard Maps

Charles Preppernau
Oregon State University
#nacis2015

Nathaniel V. KELSO

October 16, 2015
Tweet

More Decks by Nathaniel V. KELSO

Other Decks in Education

Transcript

  1. 3D vs. Conventional Volcanic Hazard
    Maps: A User Study at Mount Hood
    Charles Preppernau
    Bernhard Jenny

    View Slide

  2. Philip Maise, 2008
    Chris Newhall, 1984 Chris Newhall, 1991

    View Slide

  3. “...so the lava flow will go down this river...”
    Research Problem

    View Slide

  4. Research Question
    How can we use cartographic
    methods to improve volcanic hazard
    maps?

    View Slide

  5. Modified from Scott et al. 1997
    Research Problem

    View Slide

  6. Revised Research Questions
    Do 3D maps allow users to more accurately
    interpret terrain?
    Do isochrones give a better understanding
    of the speed of lahar hazards?
    Do these two cartographic methods improve
    user’s choice of evacuation routes?

    View Slide

  7. Study Design

    View Slide

  8. Study Design

    View Slide

  9. 2D Maps

    View Slide

  10. 2D Maps

    View Slide

  11. 3D maps

    View Slide

  12. 3D maps

    View Slide

  13. Hypotheses
    H1: Users prefer 3D perspective maps over 2D contour maps for terrain
    representation, and prefer isochrones over point markers for travel time
    indicators.
    H2: Users more accurately judge relative elevation and slope on 3D maps
    than on 2D maps.
    H3: Users more accurately locate themselves on 3D maps than on 2D maps.
    H4: Users more accurately interpret lahar travel time and speed with isochrone
    maps than with point marker maps.
    H5: Users choose more successful evacuation routes with 3D maps or
    isochrones than with 2D maps or point markers.
    Study Design

    View Slide

  14. Study Design

    View Slide

  15. 1st trip: 34 participants  pilot survey
    2nd trip: 41 participants
    3rd trip: 39 participants
    = 80 participants total for final survey
    Study Design

    View Slide

  16. H1: Do users prefer 3D maps and isochrones?
    H2: Do users more accurately read terrain on 3D maps?
    H3: Do users more accurately locate themselves on 3D maps?
    H4: Do users more reliably judge lahar arrival time and speed on isochrone
    maps?
    H5: Do users choose better escape routes on 3D or isochrone maps?
    User Preferences

    View Slide

  17. User Preferences

    View Slide

  18. Map
    Type
    Terrain
    Best
    Terrain
    Worst
    Time
    Best
    Time
    Worst
    Route
    Best
    Route
    Worst
    2D markers 3 47 4 51 4 44
    3D isochrones 42 2 38 3 41 4
    3D markers 31 1 13 15 18 9
    2D isochrones 0 26 21 7 13 19
    User Preferences

    View Slide

  19. H1: Do users prefer 3D maps and isochrones?
    Yes, 3D isochrone maps were always liked most, 2D marker maps
    were always liked least.
    H2: Do users more accurately read terrain on 3D maps?
    H3: Do users more accurately locate themselves on 3D maps?
    H4: Do users more reliably judge lahar arrival time and speed on isochrone
    maps?
    H5: Do users choose better escape routes on 3D or isochrone maps?
    User Preferences

    View Slide

  20. H1: Do users prefer 3D maps and isochrones?
    Yes, 3D isochrone maps were always liked most, 2D marker maps
    were always liked least.
    H2: Do users more accurately read terrain on 3D maps?
    H3: Do users more accurately locate themselves on 3D maps?
    H4: Do users more reliably judge lahar arrival time and speed on isochrone
    maps?
    H5: Do users choose better escape routes on 3D or isochrone maps?
    Terrain Interpretation

    View Slide

  21. Terrain Interpretation

    View Slide

  22. Grouped 3D map scores are significantly greater than
    grouped 2D map scores (p value = 0.03)
    Terrain Interpretation

    View Slide

  23. H1: Do users prefer 3D maps and isochrones?
    Yes, 3D isochrone maps were always liked most, 2D marker maps
    were always liked least.
    H2: Do users more accurately read terrain on 3D maps?
    Yes, users of 3D maps scored higher on elevation and slope
    comparisons than users of 2D maps.
    H3: Do users more accurately locate themselves on 3D maps?
    H4: Do users more reliably judge lahar arrival time and speed on isochrone
    maps?
    H5: Do users choose better escape routes on 3D or isochrone maps?
    Terrain Interpretation

    View Slide

  24. H1: Do users prefer 3D maps and isochrones?
    Yes, 3D isochrone maps were always liked most, 2D marker maps
    were always liked least.
    H2: Do users more accurately read terrain on 3D maps?
    Yes, users of 3D maps scored higher on elevation and slope
    comparisons than users of 2D maps.
    H3: Do users more accurately locate themselves on 3D maps?
    H4: Do users more reliably judge lahar arrival time and speed on isochrone
    maps?
    H5: Do users choose better escape routes on 3D or isochrone maps?
    Self-location

    View Slide

  25. H1: Do users prefer 3D maps and isochrones?
    Yes, 3D isochrone maps were always liked most, 2D marker maps
    were always liked least.
    H2: Do users more accurately read terrain on 3D maps?
    Yes, users of 3D maps scored higher on elevation and slope
    comparisons than users of 2D maps.
    H3: Do users more accurately locate themselves on 3D maps?
    No, there was no difference in location error between map types.
    H4: Do users more reliably judge lahar arrival time and speed on isochrone
    maps?
    H5: Do users choose better escape routes on 3D or isochrone maps?
    Self-location

    View Slide

  26. H1: Do users prefer 3D maps and isochrones?
    Yes, 3D isochrone maps were always liked most, 2D marker maps
    were always liked least.
    H2: Do users more accurately read terrain on 3D maps?
    Yes, users of 3D maps scored higher on elevation and slope
    comparisons than users of 2D maps.
    H3: Do users more accurately locate themselves on 3D maps?
    No, there was no difference in location error between map types.
    H4: Do users more reliably judge lahar arrival time and speed on isochrone
    maps?
    H5: Do users choose better escape routes on 3D or isochrone maps?
    Lahar Travel Time Interpretation

    View Slide

  27. H1: Do users prefer 3D maps and isochrones?
    Yes, 3D isochrone maps were always liked most, 2D marker maps were
    always liked least.
    H2: Do users more accurately read terrain on 3D maps?
    Yes, users of 3D maps scored higher on elevation and slope comparisons
    than users of 2D maps.
    H3: Do users more accurately locate themselves on 3D maps?
    No, there was no difference in location error between map types.
    H4: Do users more reliably judge lahar arrival time and speed on isochrone maps?
    No. Users of marker maps performed just as well as users of isochrone
    maps.
    H5: Do users choose better escape routes on 3D or isochrone maps?
    Lahar Travel Time Interpretation

    View Slide

  28. H1: Do users prefer 3D maps and isochrones?
    Yes, 3D isochrone maps were always liked most, 2D marker maps were
    always liked least.
    H2: Do users more accurately read terrain on 3D maps?
    Yes, users of 3D maps scored higher on elevation and slope comparisons
    than users of 2D maps.
    H3: Do users more accurately locate themselves on 3D maps?
    No, there was no difference in location error between map types.
    H4: Do users more reliably judge lahar arrival time and speed on isochrone maps?
    No. Users of marker maps performed just as well as users of isochrone
    maps.
    H5: Do users choose better escape routes on 3D or isochrone maps?
    Evacuation Routes

    View Slide

  29. View Slide

  30. View Slide

  31. Grouped 3D map scores are significantly lower than grouped 2D map
    scores (p value = 0.03)
    Evacuation Routes:

    View Slide

  32. H1: Do users prefer 3D maps and isochrones?
    Yes, 3D isochrone maps were always liked most, 2D marker maps were
    always liked least.
    H2: Do users more accurately read terrain on 3D maps?
    Yes, users of 3D maps scored higher on elevation and slope comparisons
    than users of 2D maps.
    H3: Do users more accurately locate themselves on 3D maps?
    No, there was no difference in location error between map types.
    H4: Do users more reliably judge lahar arrival time and speed on isochrone maps?
    No. Users of marker maps performed just as well as users of isochrone
    maps.
    H5: Do users choose better escape routes on 3D or isochrone maps?
    Yes, users of 3D maps chose on-foot routes with lower critical speeds
    than users of 2D maps.
    Evacuation Routes:

    View Slide

  33. 3D maps are more effective tools than 2D maps for
    conveying the dangers of lahars.
    Future research should focus on:
    Switching to open source software
    Automating the 3D map creation process
    Optimizing and testing new versions of the map
    design
    Conclusions:

    View Slide

  34. Further work:
    www.3dvolcano.com

    View Slide

  35. Thank you!

    View Slide

  36. Research Problem

    View Slide

  37. Previous Research

    View Slide

  38. Methods:
    Study Site

    View Slide

  39. Methods:
    User Study

    View Slide

  40. Results

    View Slide

  41. Conclusions

    View Slide

  42. Acknowledgements

    View Slide

  43. References
    Baxter, Peter J. 2000. “Impacts of Eruptions on Human 
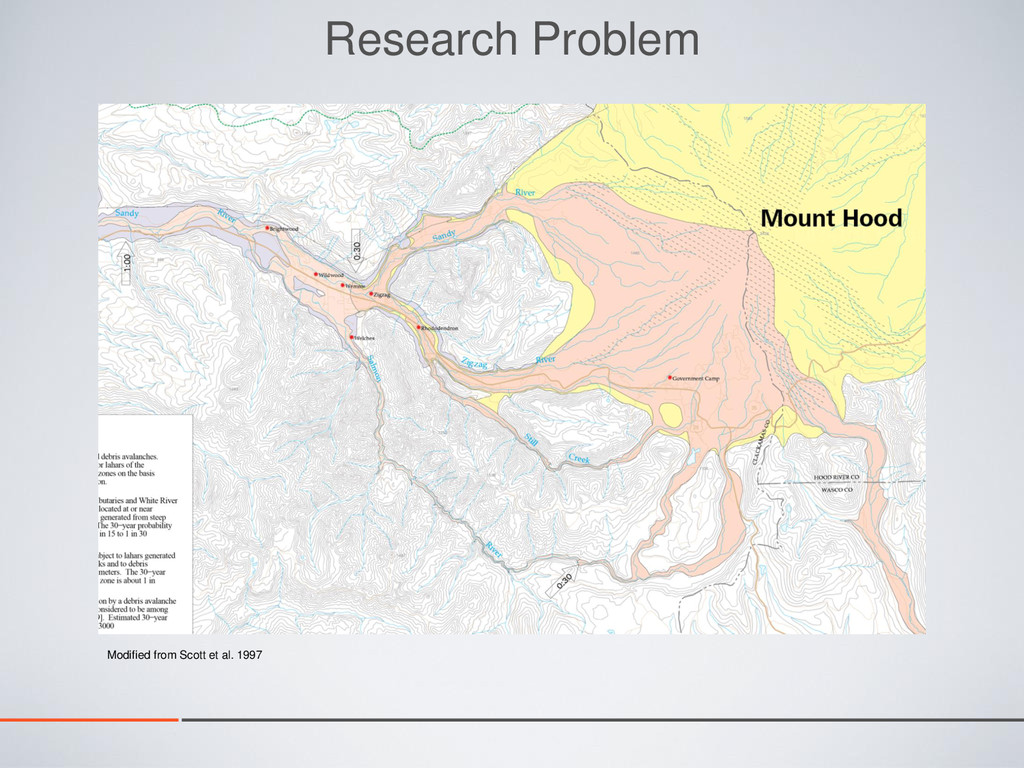
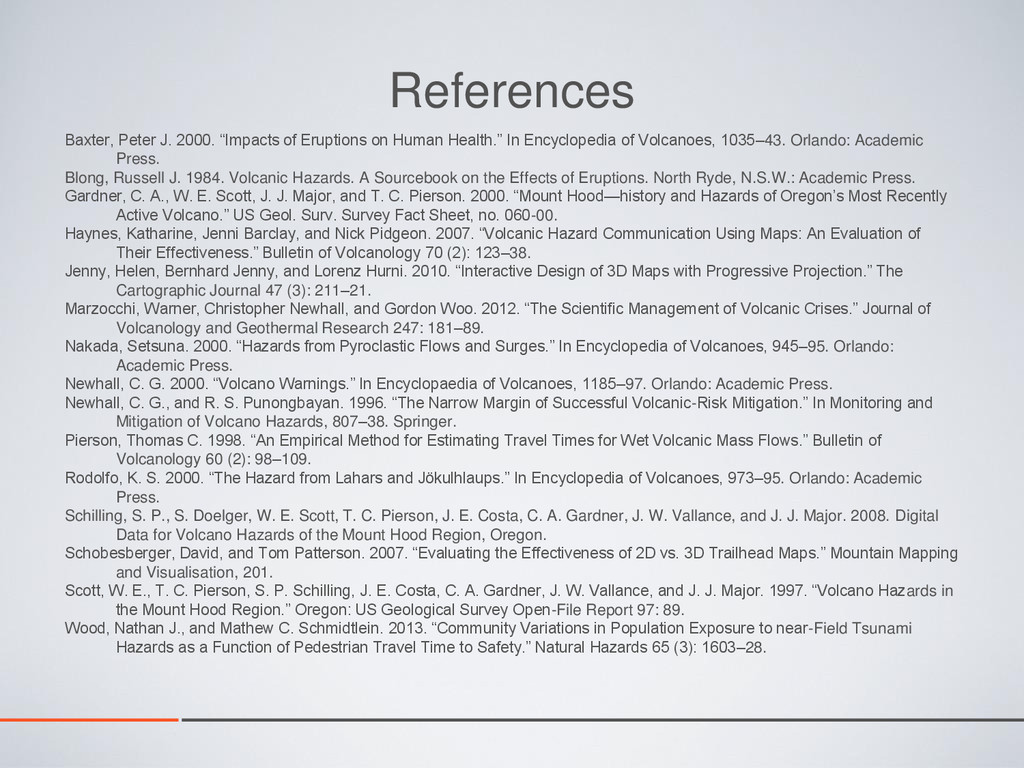
Health.” In Encyclopedia of Volcanoes, 1035–43. Orlando: Academic
    Press.
    Blong, Russell J. 1984. Volcanic Hazards. A Sourcebook on the Effects of Eruptions. North Ryde, N.S.W.: Academic Press.
    Gardner, C. A., W. E. Scott, J. J. Major, and T. C. Pierson. 2000. “Mount Hood—history and Hazards of Oregon’s Most Recently
    Active Volcano.” US Geol. Surv. Survey Fact Sheet, no. 060-00.
    Haynes, Katharine, Jenni Barclay, and Nick Pidgeon. 2007. “Volcanic Hazard Communication Using Maps: An Evaluation of
    Their Effectiveness.” Bulletin of Volcanology 70 (2): 123–38.
    Jenny, Helen, Bernhard Jenny, and Lorenz Hurni. 2010. “Interactive Design of 3D Maps with Progressive Projection.” The
    Cartographic Journal 47 (3): 211–21.
    Marzocchi, Warner, Christopher Newhall, and Gordon Woo. 2012. “The Scientific Management of Volcanic Crises.” Journal of
    Volcanology and Geothermal Research 247: 181–89.
    Nakada, Setsuna. 2000. “Hazards from Pyroclastic Flows and Surges.” In Encyclopedia of Volcanoes, 945–95. Orlando:
    Academic Press.
    Newhall, C. G. 2000. “Volcano Warnings.” In Encyclopaedia of Volcanoes, 1185–97. Orlando: Academic Press.
    Newhall, C. G., and R. S. Punongbayan. 1996. “The Narrow Margin of Successful Volcanic-Risk Mitigation.” In Monitoring and
    Mitigation of Volcano Hazards, 807–38. Springer.
    Pierson, Thomas C. 1998. “An Empirical Method for Estimating Travel Times for Wet Volcanic Mass Flows.” Bulletin of
    Volcanology 60 (2): 98–109.
    Rodolfo, K. S. 2000. “The Hazard from Lahars and Jökulhlaups.” In Encyclopedia of Volcanoes, 973–95. Orlando: Academic
    Press.
    Schilling, S. P., S. Doelger, W. E. Scott, T. C. Pierson, J. E. Costa, C. A. Gardner, J. W. Vallance, and J. J. Major. 2008. Digital
    Data for Volcano Hazards of the Mount Hood Region, Oregon.
    Schobesberger, David, and Tom Patterson. 2007. “Evaluating the Effectiveness of 2D vs. 3D Trailhead Maps.” Mountain Mapping
    and Visualisation, 201.
    Scott, W. E., T. C. Pierson, S. P. Schilling, J. E. Costa, C. A. Gardner, J. W. Vallance, and J. J. Major. 1997. “Volcano Hazards in
    the Mount Hood Region.” Oregon: US Geological Survey Open-File Report 97: 89.
    Wood, Nathan J., and Mathew C. Schmidtlein. 2013. “Community Variations in Population Exposure to near-Field Tsunami
    Hazards as a Function of Pedestrian Travel Time to Safety.” Natural Hazards 65 (3): 1603–28.

    View Slide

  44. View Slide

  45. View Slide

  46. 3D Line Features

    View Slide

  47. 3D Line Features

    View Slide

  48. Methods:
    The Lahar Travel Time Raster

    View Slide

  49. Data from Pierson (1998)
    The Lahar Travel Time Raster

    View Slide

  50. The Lahar Travel Time Raster

    View Slide

  51. View Slide

  52. View Slide

  53. No significant differences between grouped 2D and 3D maps (p value = 0.57)
    Self-location

    View Slide

  54. The Lahar Travel Time Raster

    View Slide

  55. Lahar Travel Time Interpretation

    View Slide

  56. No significant
    difference between
    groups or pairs
    (p values > 0.12)
    No significant
    difference
    Lahar Travel Time Interpretation

    View Slide

  57. Evacuation Routes:
    Critical Speed

    View Slide

  58. Evacuation Routes:
    Critical Speed

    View Slide

  59. Modified from Haynes et al. (2007)
    Previous Research

    View Slide