Upgrade to Pro
— share decks privately, control downloads, hide ads and more …
Speaker Deck
Features
Speaker Deck
PRO
Sign in
Sign up for free
Search
Search
Miten toteutan informaation visualisoinnin? Juk...
Search
Open Data Tampere Region
April 24, 2013
Technology
100
0
Share
Embed
Copy iframe code
Copy JS code
Copy link
Start on current slide
Miten toteutan informaation visualisoinnin? Jukka Huhtamäki
Esitetty Open Data TRE meetup 2:ssa 24.4.2013
Open Data Tampere Region
April 24, 2013
More Decks by Open Data Tampere Region
See All by Open Data Tampere Region
Databusiness ja avoimet rajapinnat
opendatatre
0
160
DataBusiness
opendatatre
0
120
Antti Sandin esitys Datasta liiketoimintaa 4.2.2016
opendatatre
0
150
Anu-Maria Laitisen esitys BMC Datasta liiketoimintaa 4.2.2016
opendatatre
0
160
Avoin data Tampereen seudulla; Joonas Dukpa
opendatatre
0
420
Apps4Pirkanmaa 2014 -esittely; Matti Saastamoinen
opendatatre
0
130
Avoimen tiedon kuntakiertue 2014 - Tampere - Tilaisuuden avaus; Matti Saastamoinen
opendatatre
0
90
Kuntien datan avaamisen malli; Antti Poikola
opendatatre
0
110
6Aika-strategialla avoimia ja älykkäitä kaupunkeja; Matti Saastamoinen
opendatatre
0
150
Other Decks in Technology
See All in Technology
次世代ランサムウェア対策の考察 / 20260704 Mitsutoshi Matsuo
shift_evolve
PRO
3
1k
Terraform 101 (初心者向け) 資料
shuadachi
0
110
水を運ぶ人としてのリーダーシップ
izumii19
4
1.1k
背中から、背中へ /paying forward to community
naitosatoshi
0
180
なぜ人は自分のプロジェクトを 「なんちゃってアジャイル」と 自嘲するのか
kozotaira
0
200
組織における AI-DLC 実践
askul
0
220
AI-DLCを “そのまま導入しなかった”話 ~組織に合わせてアジャストした 私たちの実践共有~
hiroramos4
PRO
1
470
プライバシー保護の理論と実践
lycorptech_jp
PRO
1
130
『AIに負けない』より『AIと遊ぶ』」〜ワクワクが最強のテスト・QA学習戦略_公開用
odan611
1
210
WebGIS AI Agentの紹介
_shimizu
0
600
5分でわかる Amazon Connect_20260608
hwangbyeonghun
0
150
テスト設計の本質を改めて考えてみる~生成AIを活用する時代だからこそ、作ったテストの説明性を高めよう~
yamasaki696
1
210
Featured
See All Featured
Reflections from 52 weeks, 52 projects
jeffersonlam
356
21k
How to Ace a Technical Interview
jacobian
281
24k
Building Flexible Design Systems
yeseniaperezcruz
330
40k
Building a Modern Day E-commerce SEO Strategy
aleyda
45
9.1k
Practical Tips for Bootstrapping Information Extraction Pipelines
honnibal
25
2k
Principles of Awesome APIs and How to Build Them.
keavy
128
18k
ラッコキーワード サービス紹介資料
rakko
1
3.8M
The Invisible Side of Design
smashingmag
301
52k
Rails Girls Zürich Keynote
gr2m
96
14k
svc-hook: hooking system calls on ARM64 by binary rewriting
retrage
2
320
How to make the Groovebox
asonas
2
2.2k
KATA
mclloyd
PRO
35
15k
Transcript
Miten toteutan informaation visualisoinnin? Jukka Huhtamäki IISLab, TTY Open Data
TRE meetup keskiviikkona 24. huhtikuuta 2013 Uusi Tehdas
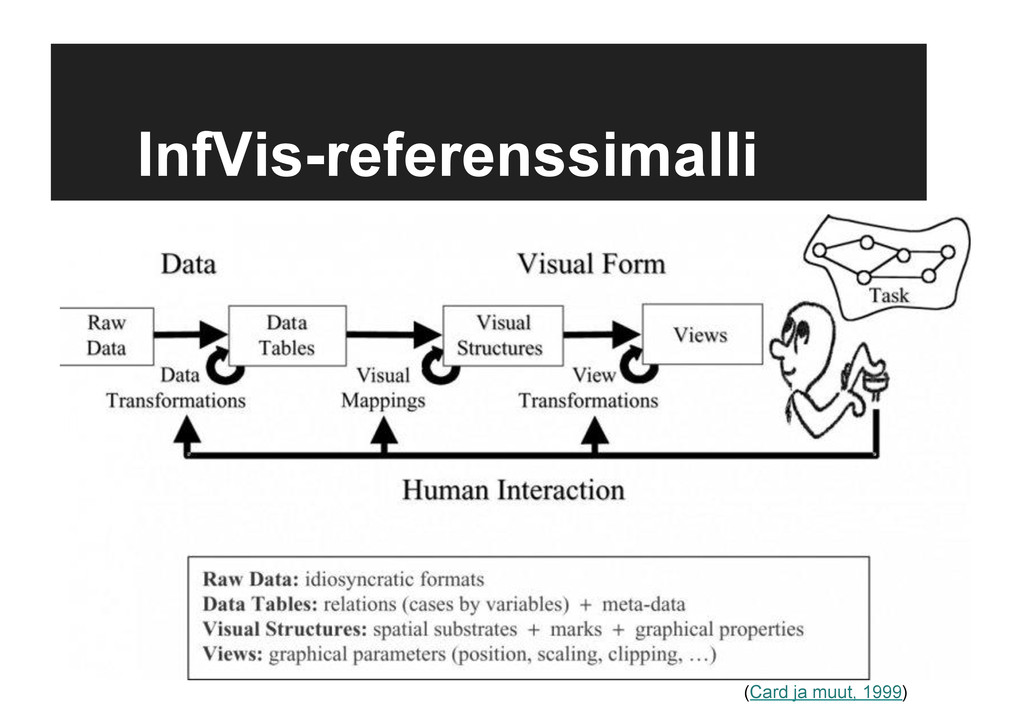
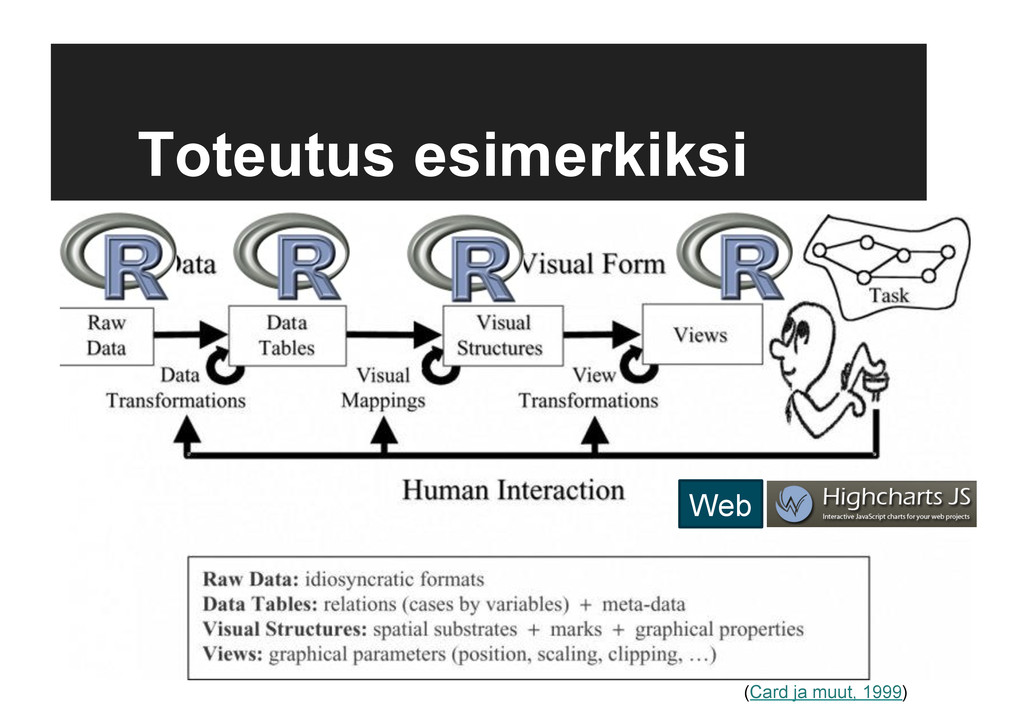
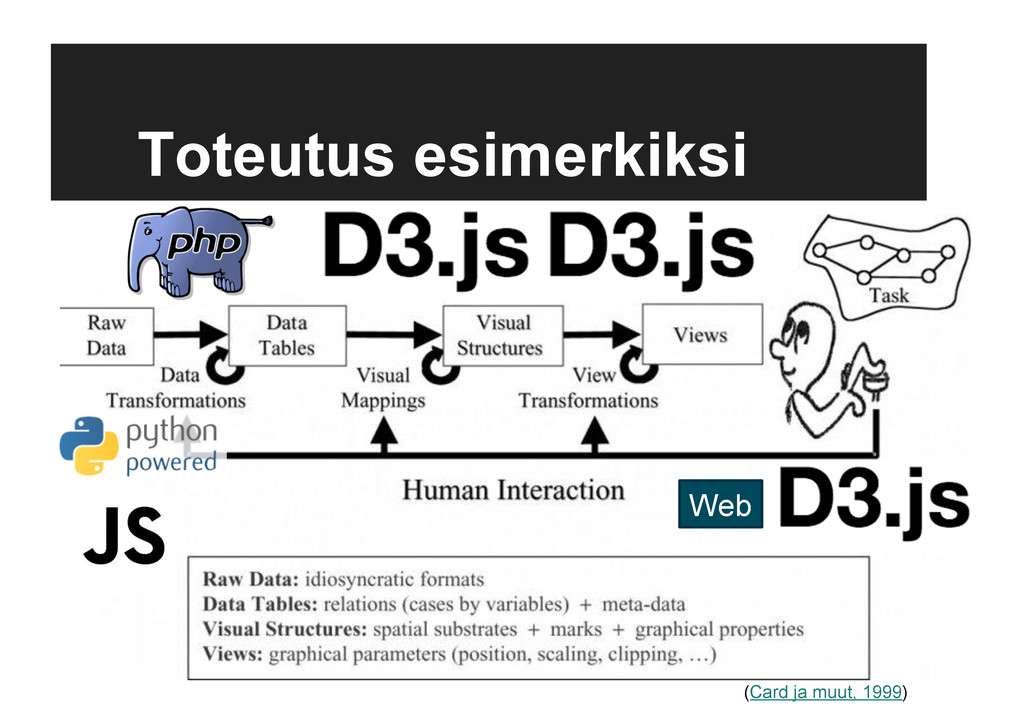
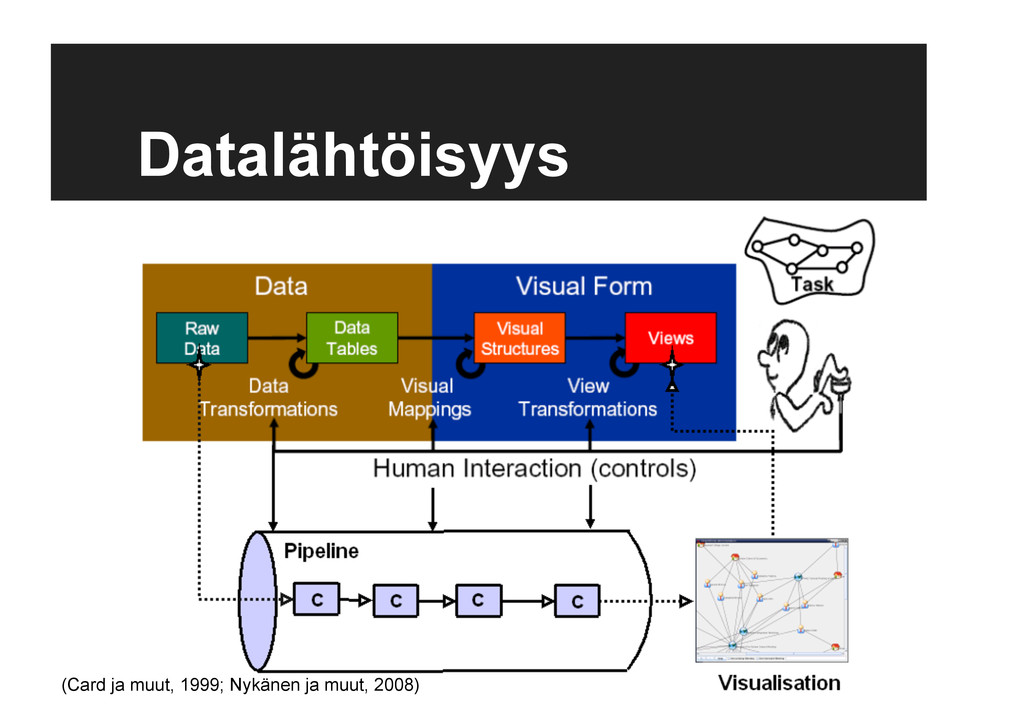
InfVis-referenssimalli (Card ja muut, 1999)
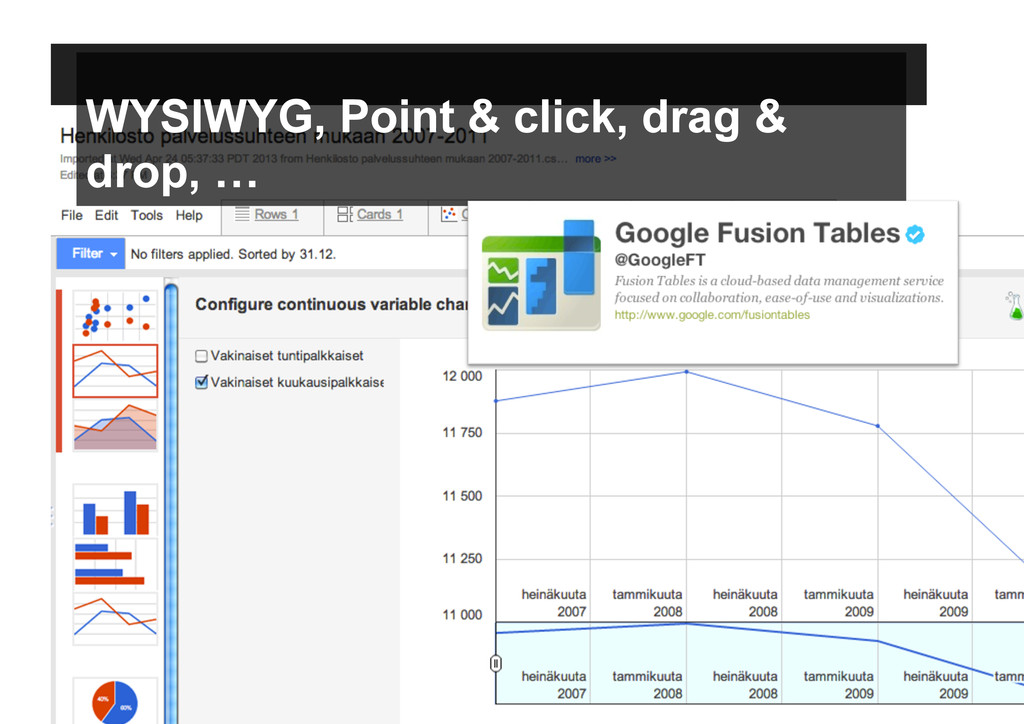
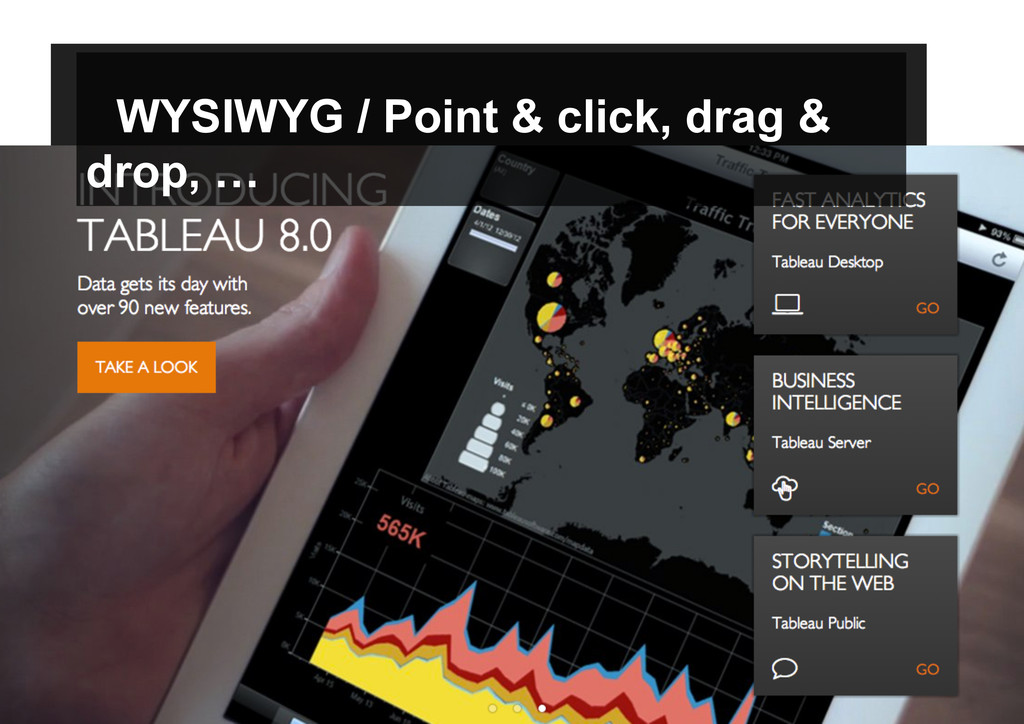
WYSIWYG, Point & click, drag & drop, …
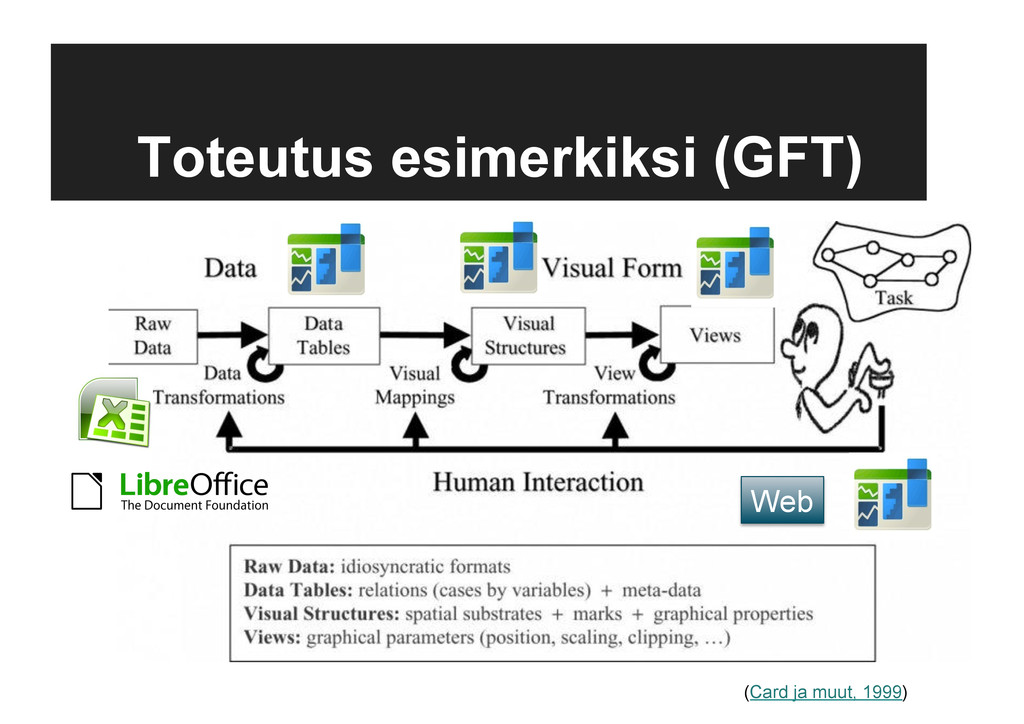
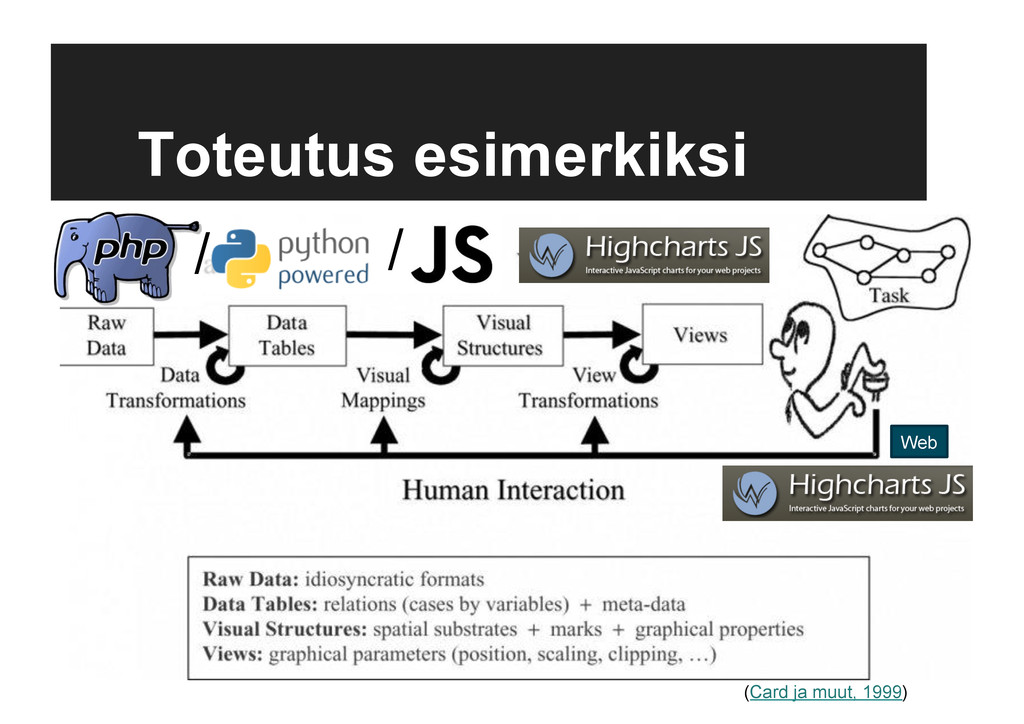
Toteutus esimerkiksi (GFT) (Card ja muut, 1999) Web
WYSIWYG / Point & click, drag & drop, …
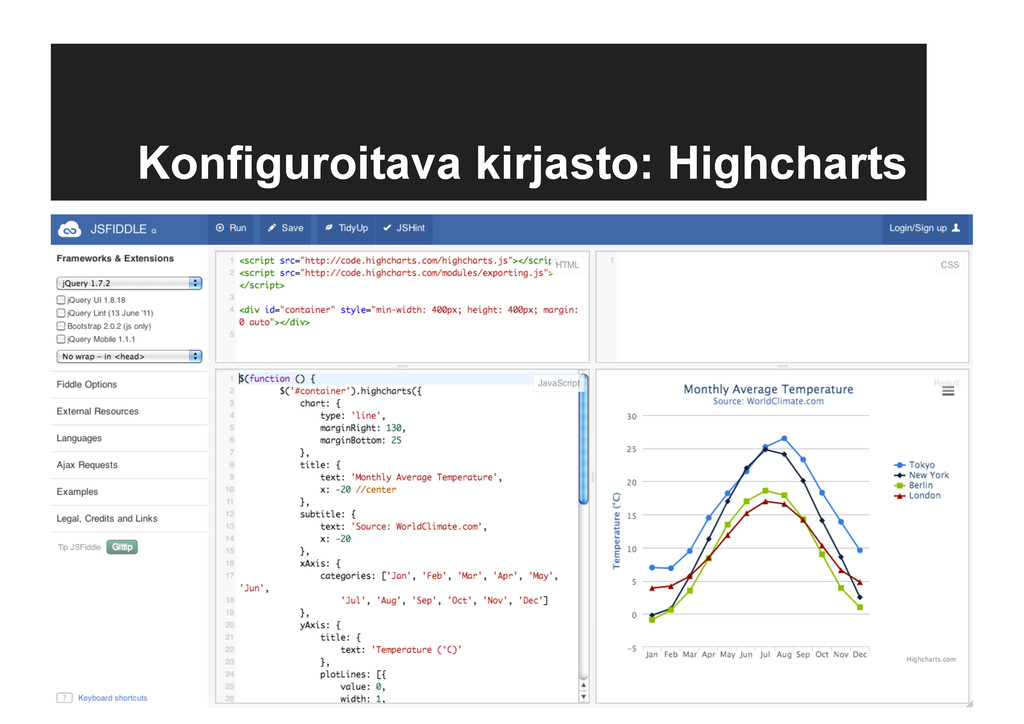
Konfiguroitava kirjasto: Highcharts
(Card ja muut, 1999) Web / / Toteutus esimerkiksi
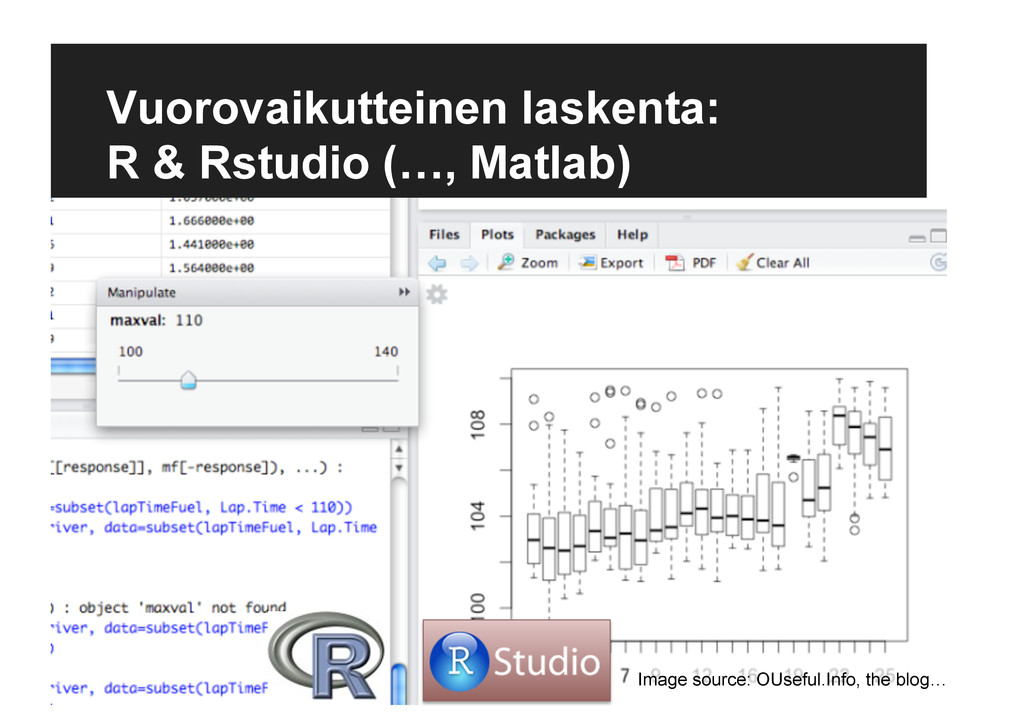
Vuorovaikutteinen laskenta: R & Rstudio (…, Matlab) Image source: OUseful.Info,
the blog…
Toteutus esimerkiksi (Card ja muut, 1999) Web
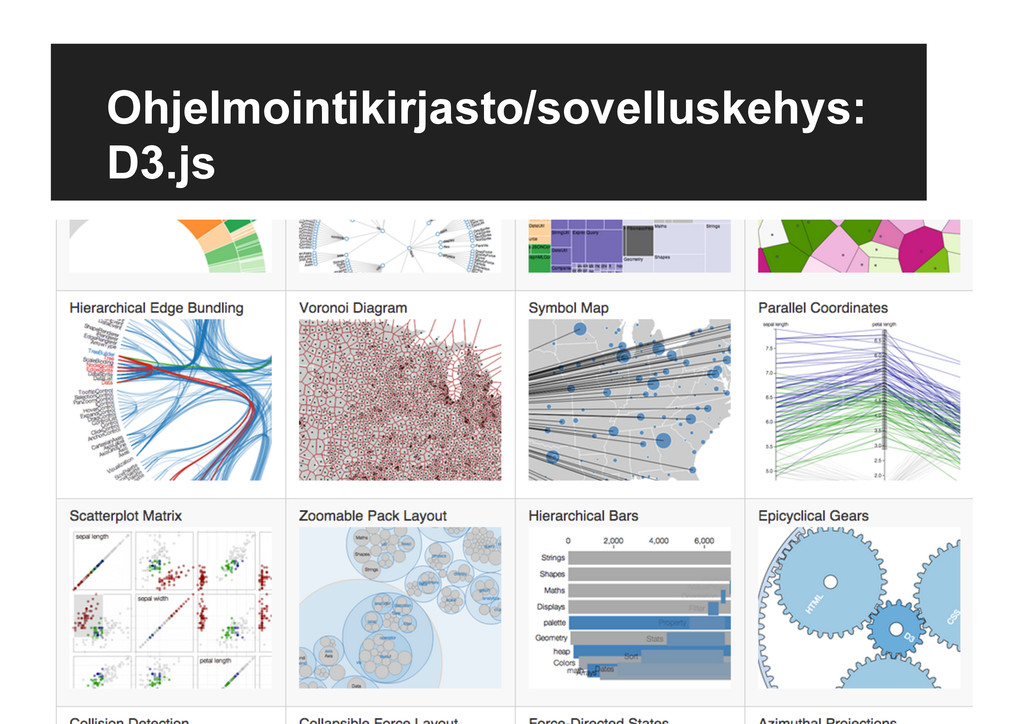
Ohjelmointikirjasto/sovelluskehys: D3.js
Toteutus esimerkiksi (Card ja muut, 1999) Web
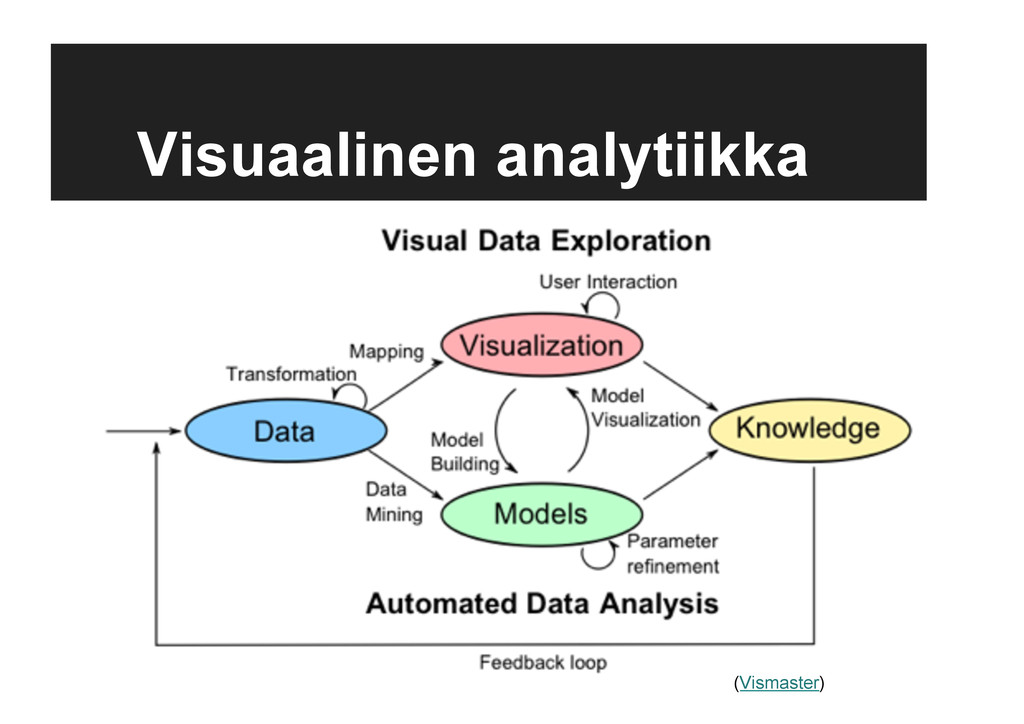
Visuaalinen analytiikka (Vismaster)
Datalähtöisyys (Card ja muut, 1999; Nykänen ja muut, 2008)
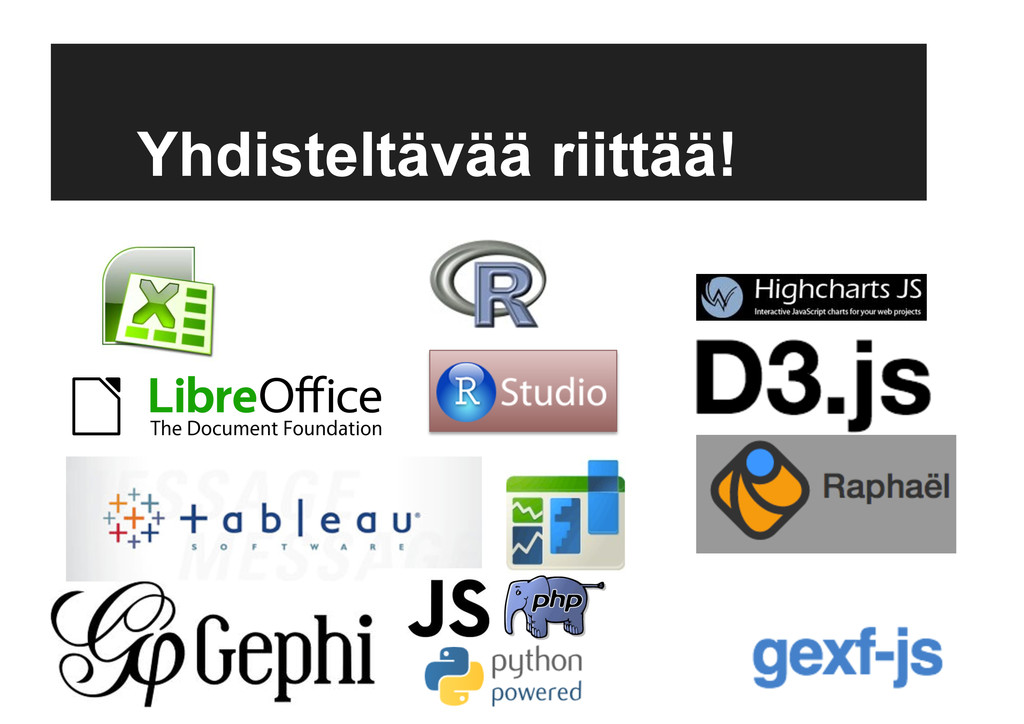
Yhdisteltävää riittää!
Lopuksi – kiitos! Aiheeseen liittyvää: • Facebook: Finnish Open Data
Ecosystem, Verkostoanalyysi, Datajournalismin avoin tukiryhmä • Twitter: #datajournalismi, #verkostoanalyysi, #opendatatre, #okffi Vinkkaa tai kysy: http://www.linkedin.com/in/jukkahuhtamaki @jnkka