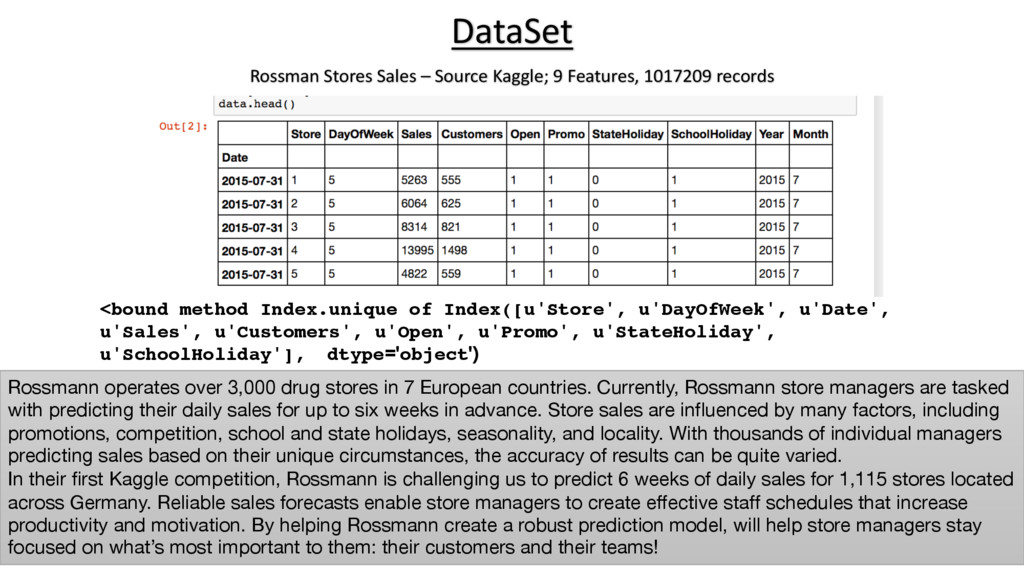
records Randal S. Goomer, PhD 1/25/17 2 <bound method Index.unique of Index([u'Store', u'DayOfWeek', u'Date', u'Sales', u'Customers', u'Open', u'Promo', u'StateHoliday', u'SchoolHoliday'], dtype='object') Rossmann operates over 3,000 drug stores in 7 European countries. Currently, Rossmann store managers are tasked with predicting their daily sales for up to six weeks in advance. Store sales are influenced by many factors, including promotions, competition, school and state holidays, seasonality, and locality. With thousands of individual managers predicting sales based on their unique circumstances, the accuracy of results can be quite varied. In their first Kaggle competition, Rossmann is challenging us to predict 6 weeks of daily sales for 1,115 stores located across Germany. Reliable sales forecasts enable store managers to create effective staff schedules that increase productivity and motivation. By helping Rossmann create a robust prediction model, will help store managers stay focused on what’s most important to them: their customers and their teams!
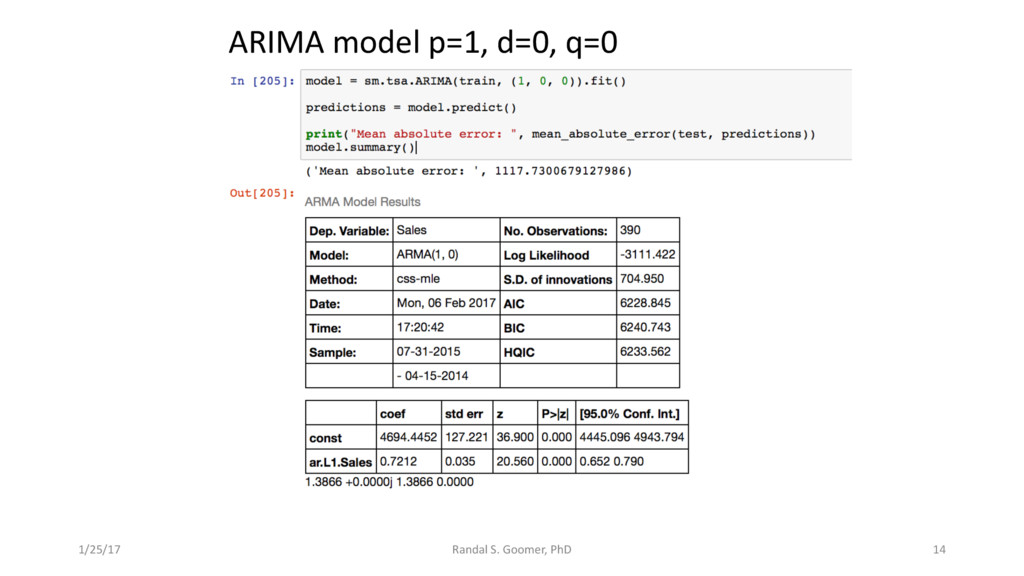
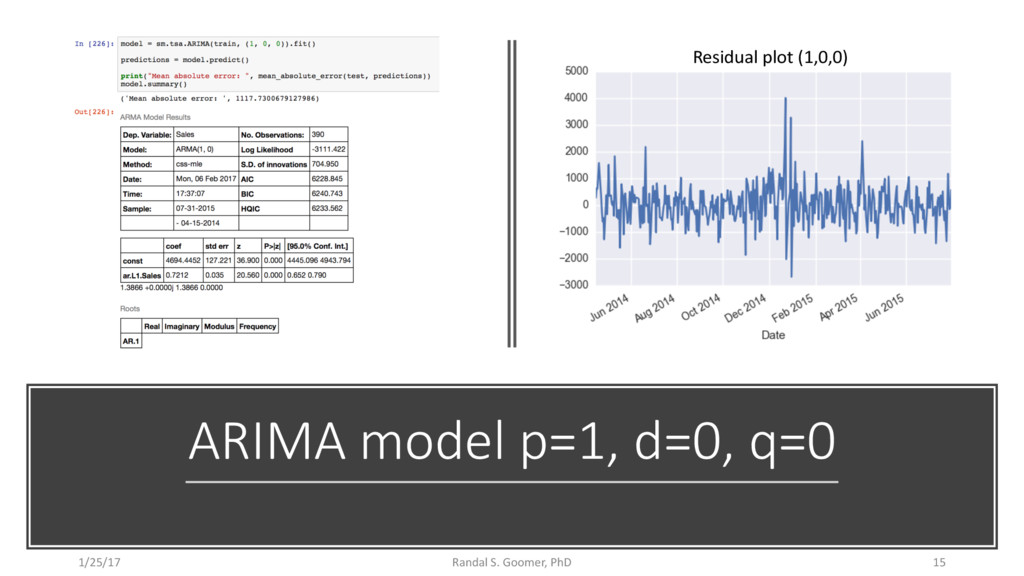
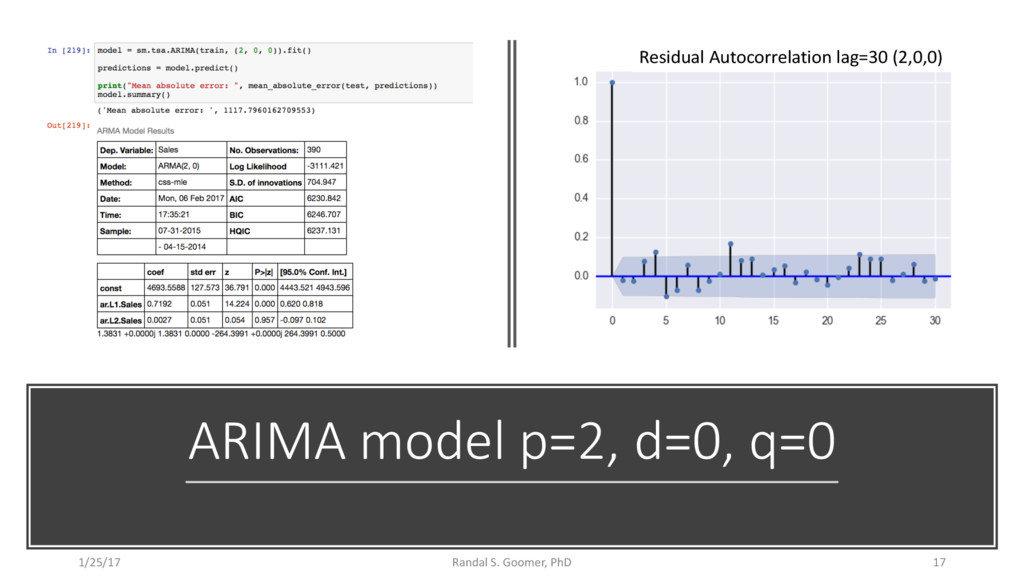
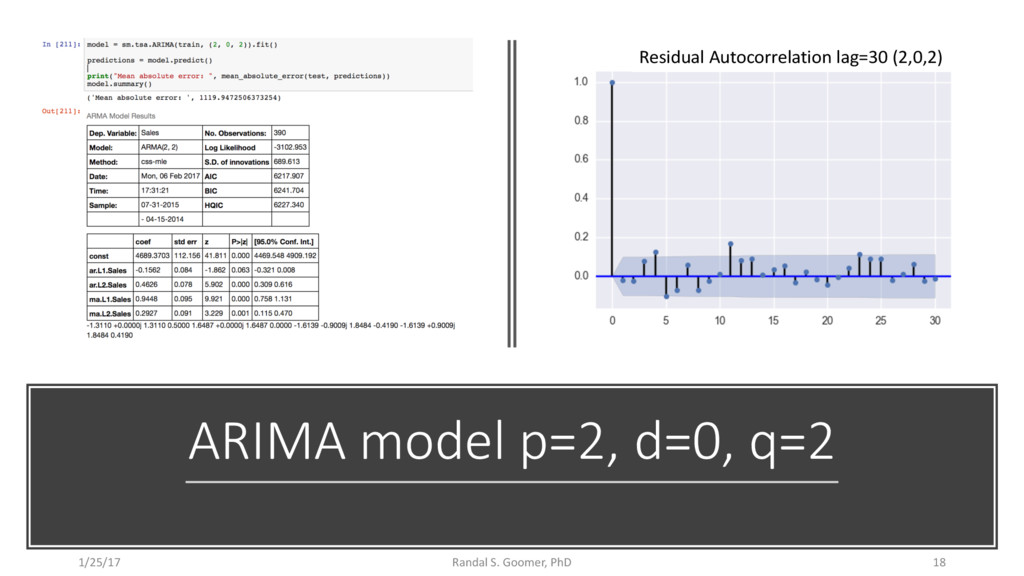
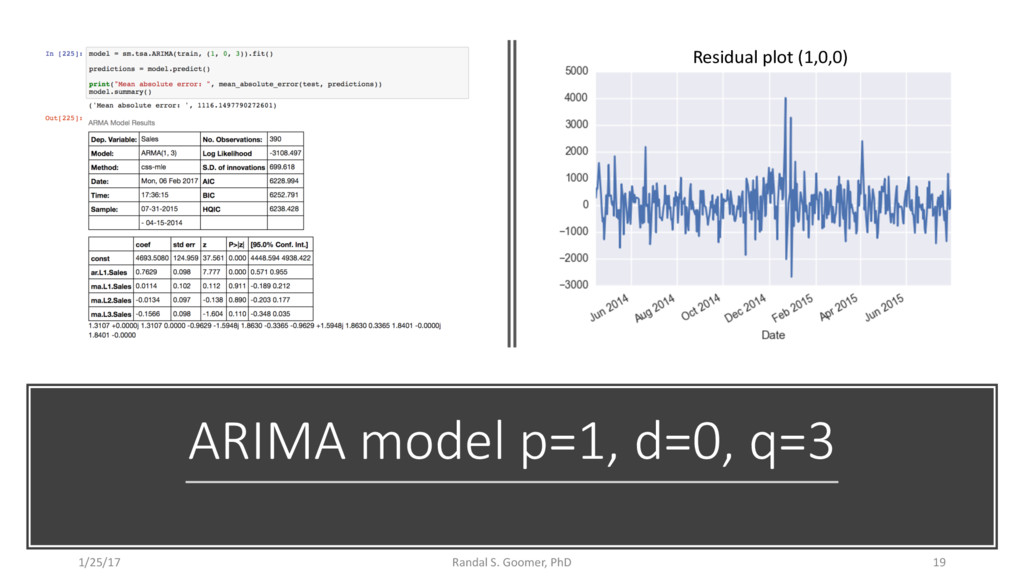
information? Can optimize and Train ARIMA model to minimize Mean Absolute Error of our time-series predictions? Time-Series Predictions Randal S. Goomer, PhD 1/25/17 3 Hypothesis Testing
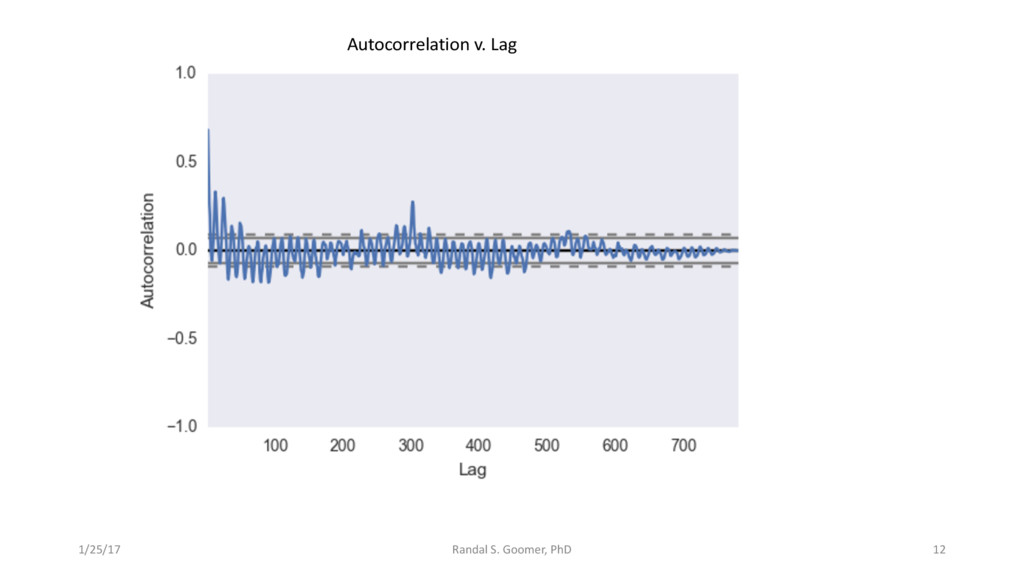
![1/25/17 Randal S. Goomer, PhD 13 plot_acf(store1_open_data['Sales'], lags=30) (effect of](https://files.speakerdeck.com/presentations/0bfc28477f1e487f8995357be2953187/slide_12.jpg)
![1/25/17 Randal S. Goomer, PhD 20 model.forecast(steps=1, alpha=0.05) Out[270]: (array([](https://files.speakerdeck.com/presentations/0bfc28477f1e487f8995357be2953187/slide_19.jpg)