the measures, findings and conclusions of this work Methodology supported by UK MRC and NIHR Funders of illustrative studies included UK MRC, ESRC, Nuffield Foundation, Autistica, Waterloo Foundation and US NIH.
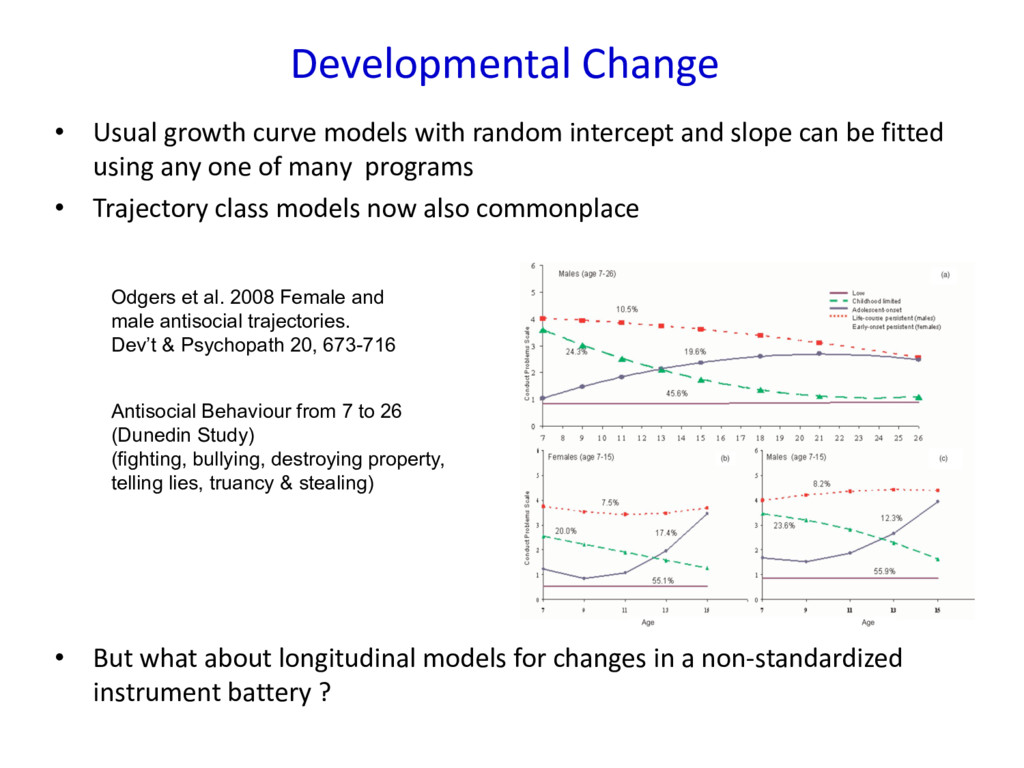
and slope can be fitted using any one of many programs • Trajectory class models now also commonplace • But what about longitudinal models for changes in a non-standardized instrument battery ? Odgers et al. 2008 Female and male antisocial trajectories. Dev’t & Psychopath 20, 673-716 Antisocial Behaviour from 7 to 26 (Dunedin Study) (fighting, bullying, destroying property, telling lies, truancy & stealing)
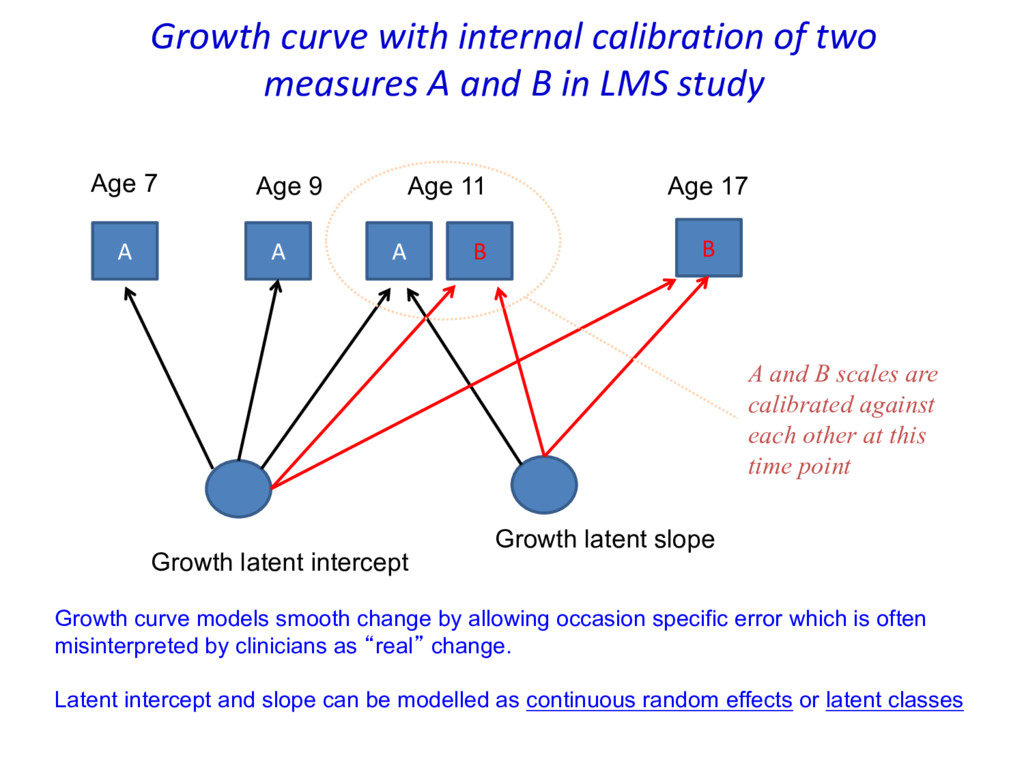
11 Age 17 Growth latent intercept Growth latent slope Growth curve models smooth change by allowing occasion specific error which is often misinterpreted by clinicians as “real” change. Latent intercept and slope can be modelled as continuous random effects or latent classes A and B scales are calibrated against each other at this time point Growth curve with internal calibration of two measures A and B in LMS study
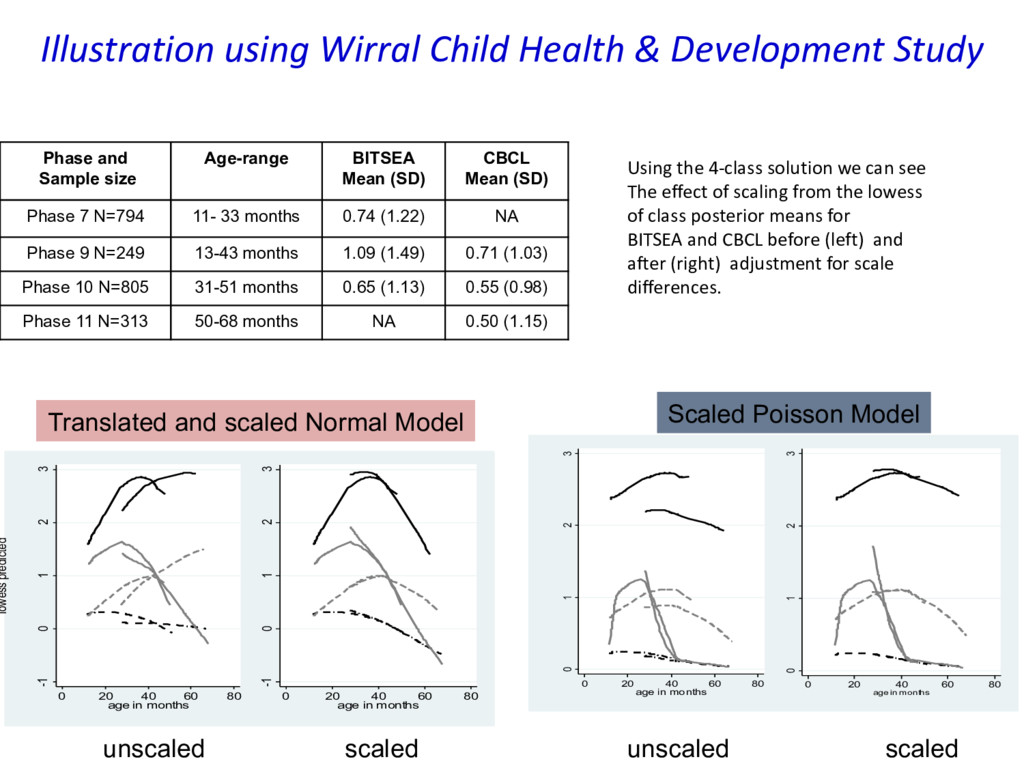
60 80 age in months 0 1 2 3 0 20 40 60 80 age in months -1 0 1 2 3 lowess predicted 0 20 40 60 80 age in months -1 0 1 2 3 0 20 40 60 80 age in months unscaled scaled Illustration using Wirral Child Health & Development Study Scaled Poisson Model Using the 4-class solution we can see The effect of scaling from the lowess of class posterior means for BITSEA and CBCL before (left) and after (right) adjustment for scale differences. Translated and scaled Normal Model Phase and Sample size Age-range BITSEA Mean (SD) CBCL Mean (SD) Phase 7 N=794 11- 33 months 0.74 (1.22) NA Phase 9 N=249 13-43 months 1.09 (1.49) 0.71 (1.03) Phase 10 N=805 31-51 months 0.65 (1.13) 0.55 (0.98) Phase 11 N=313 50-68 months NA 0.50 (1.15) unscaled scaled
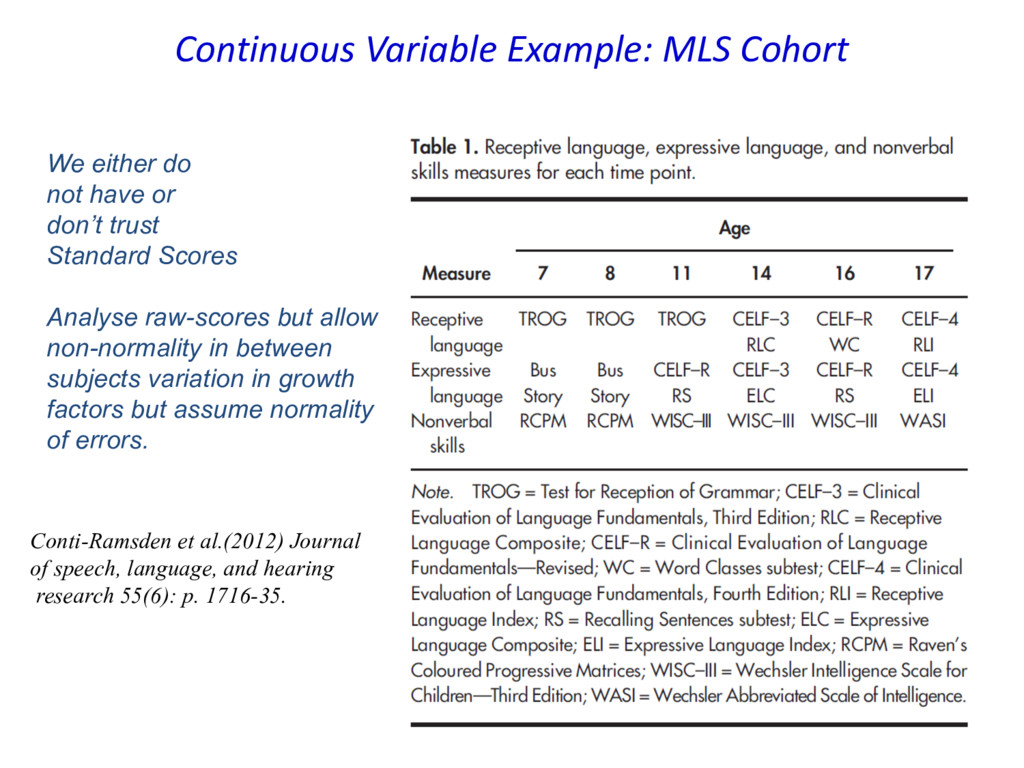
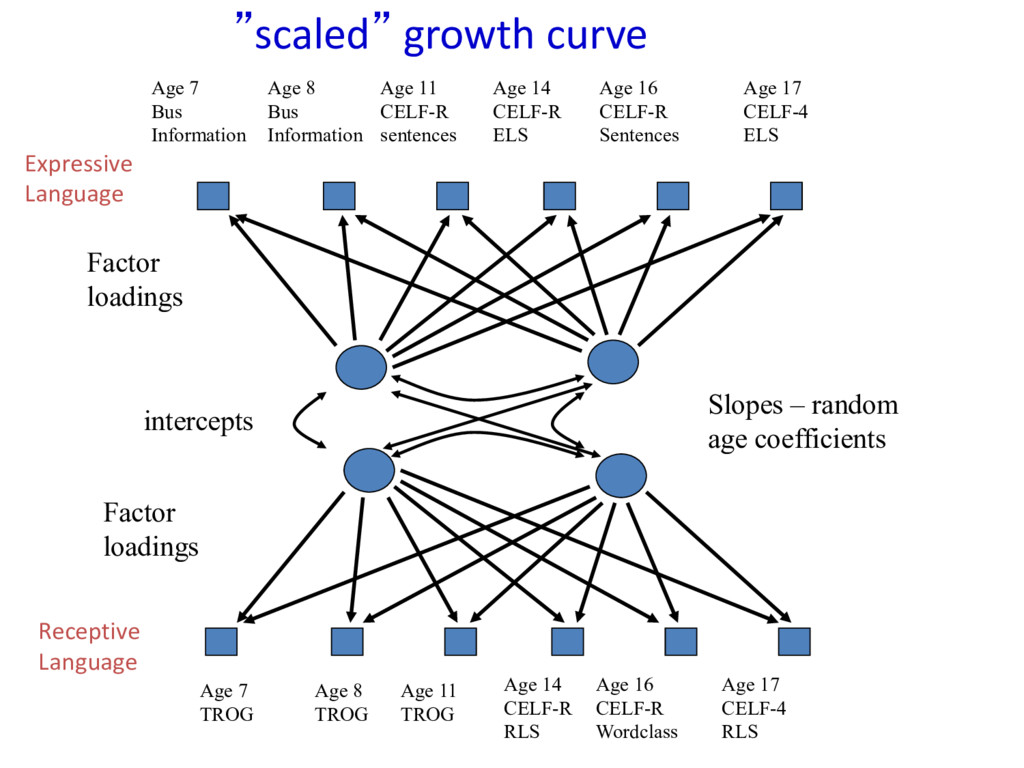
or don’t trust Standard Scores Analyse raw-scores but allow non-normality in between subjects variation in growth factors but assume normality of errors. Conti-Ramsden et al.(2012) Journal of speech, language, and hearing research 55(6): p. 1716-35.
16 CELF-R Wordclass Age 17 CELF-4 RLS Age 14 CELF-R RLS Age 7 Bus Information Age 8 Bus Information Age 11 CELF-R sentences Age 16 CELF-R Sentences Age 17 CELF-4 ELS Age 14 CELF-R ELS Slopes – random age coefficients intercepts Factor loadings Factor loadings ”scaled” growth curve Receptive Language Expressive Language
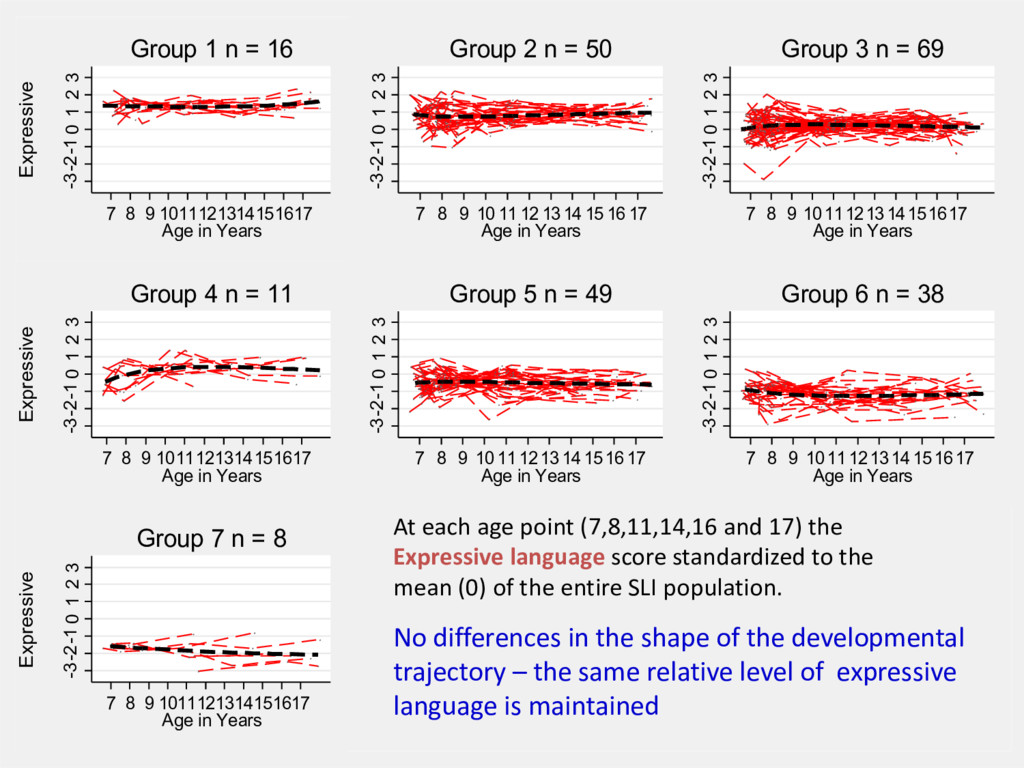
in Years Expressive Group 1 n = 16 -3-2-1 0 1 2 3 7 8 9 10 11 12 1314 15 16 17 Age in Years Group 2 n = 50 -3-2-1 0 1 2 3 7 8 9 1011121314151617 Age in Years Group 3 n = 69 -3-2-1 0 1 2 3 7 8 9 1011121314151617 Age in Years Expressive Group 4 n = 11 -3-2-1 0 1 2 3 7 8 9 10 11 1213 14 1516 17 Age in Years Group 5 n = 49 -3-2-1 0 1 2 3 7 8 9 1011 121314 151617 Age in Years Group 6 n = 38 -3-2-1 0 1 2 3 7 8 9 1011121314151617 Age in Years Expressive Group 7 n = 8 At each age point (7,8,11,14,16 and 17) the Expressive language score standardized to the mean (0) of the entire SLI population. No differences in the shape of the developmental trajectory – the same relative level of expressive language is maintained
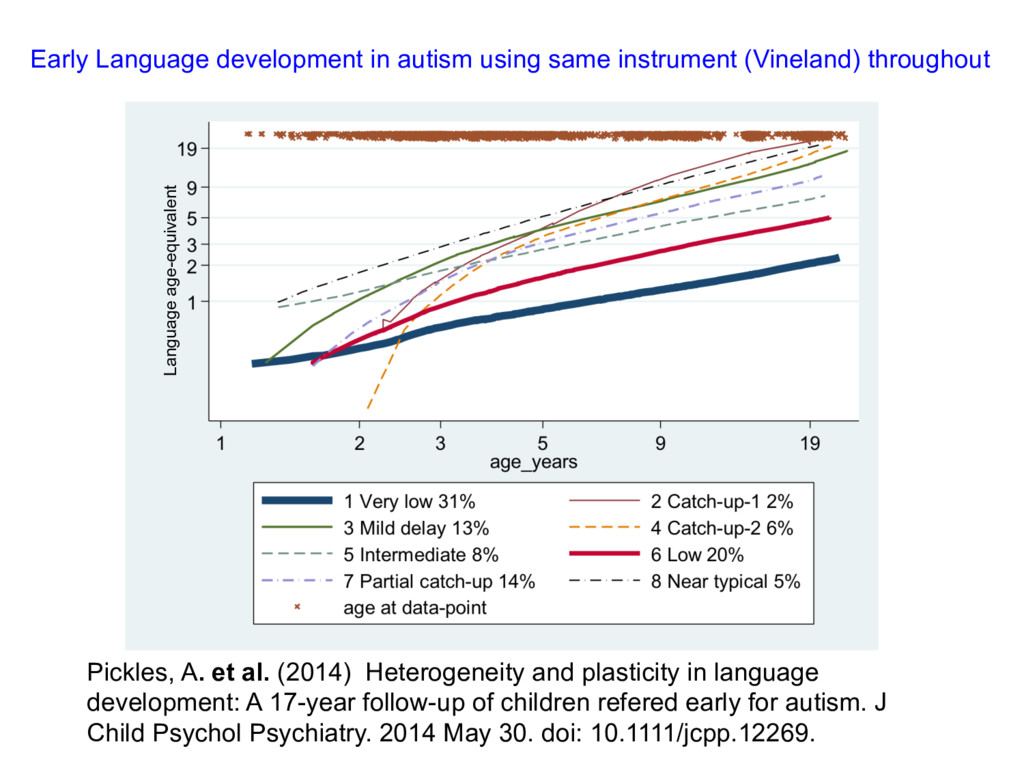
(Vineland) throughout Pickles, A. et al. (2014) Heterogeneity and plasticity in language development: A 17-year follow-up of children refered early for autism. J Child Psychol Psychiatry. 2014 May 30. doi: 10.1111/jcpp.12269.
rather little about whether they are right or not. What if we are not ready to specify a growth curve/trajectory model ? And/or What if we are interested in more than differences in “slope” and the things that influence slope ? Separating the Estimation from the Calculation of Quantities of Interest
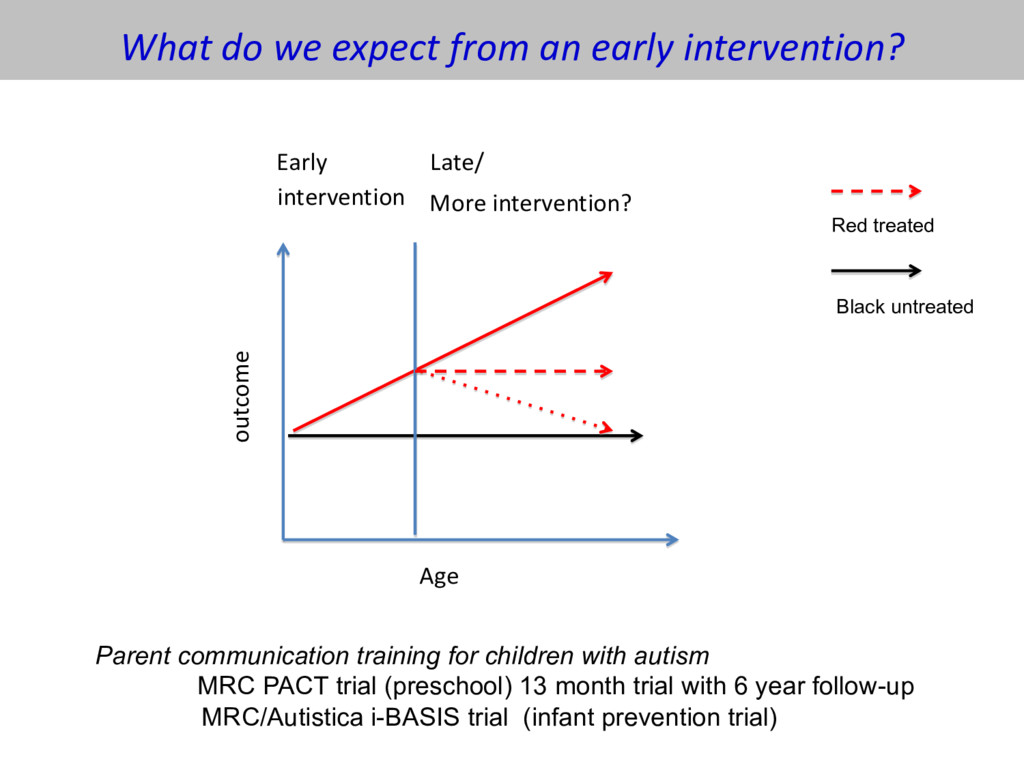
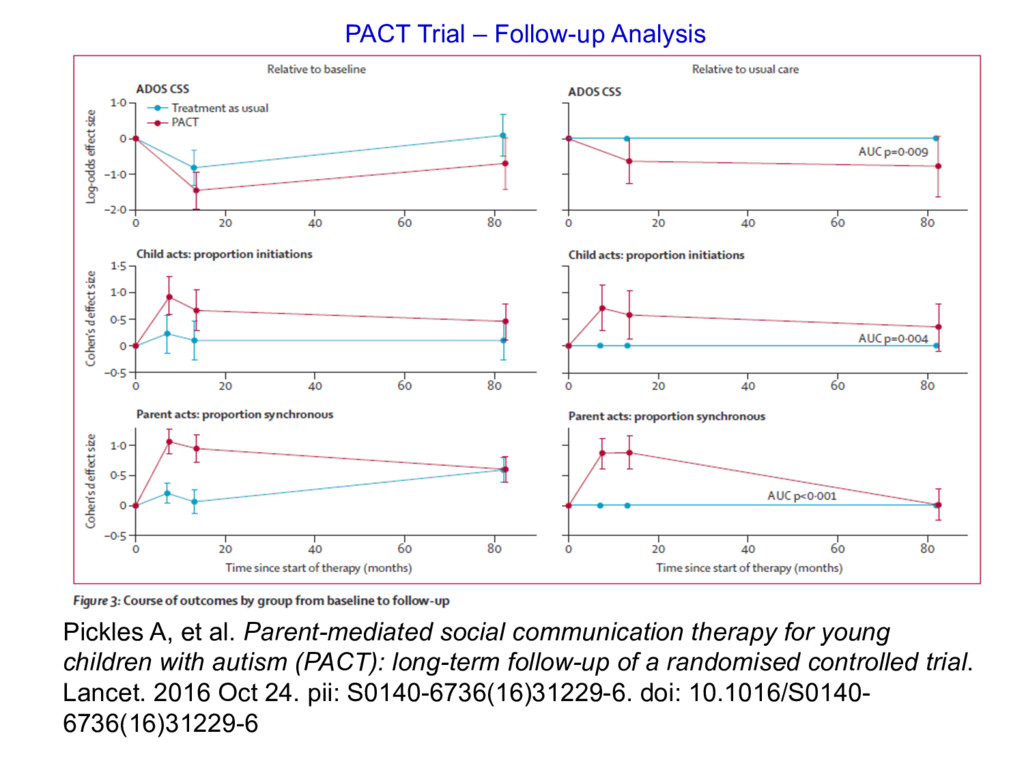
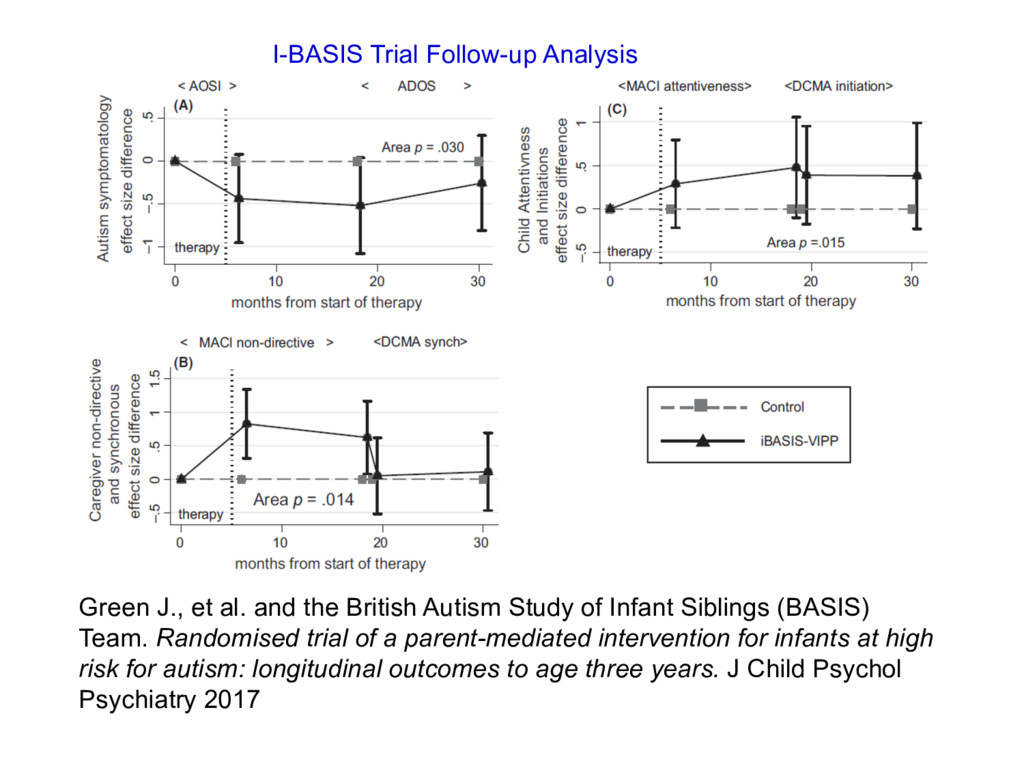
intervention? Early Late/ outcome Age Red treated Black untreated Parent communication training for children with autism MRC PACT trial (preschool) 13 month trial with 6 year follow-up MRC/Autistica i-BASIS trial (infant prevention trial)
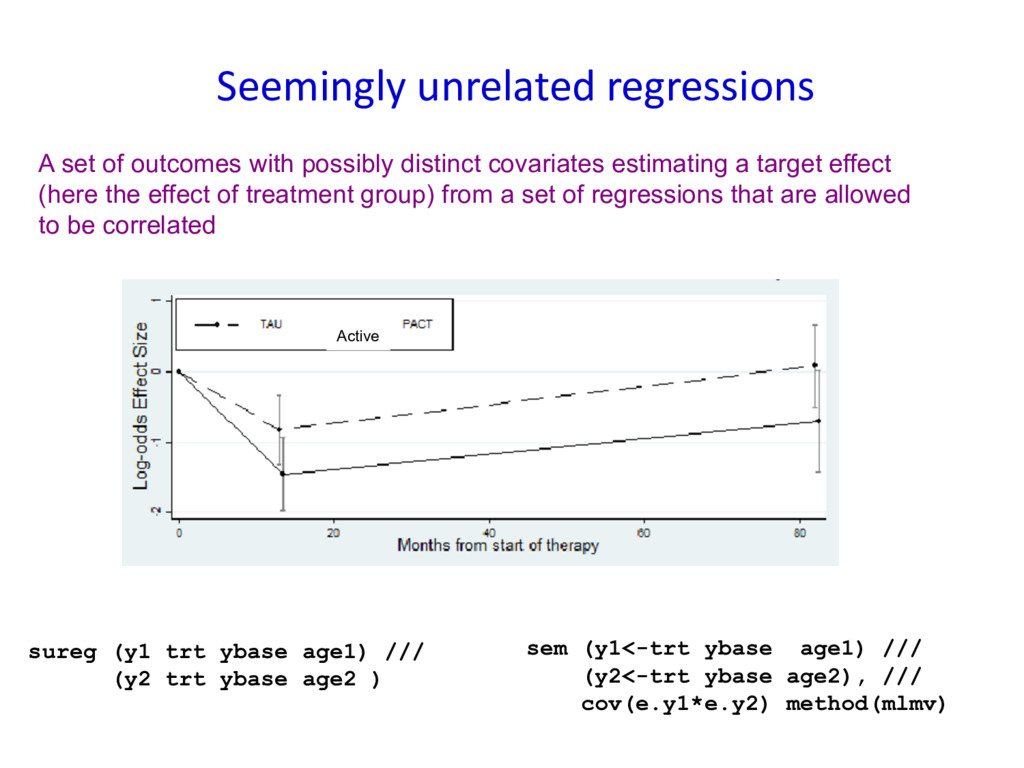
age2), /// cov(e.y1*e.y2) method(mlmv) A set of outcomes with possibly distinct covariates estimating a target effect (here the effect of treatment group) from a set of regressions that are allowed to be correlated Active sureg (y1 trt ybase age1) /// (y2 trt ybase age2 )
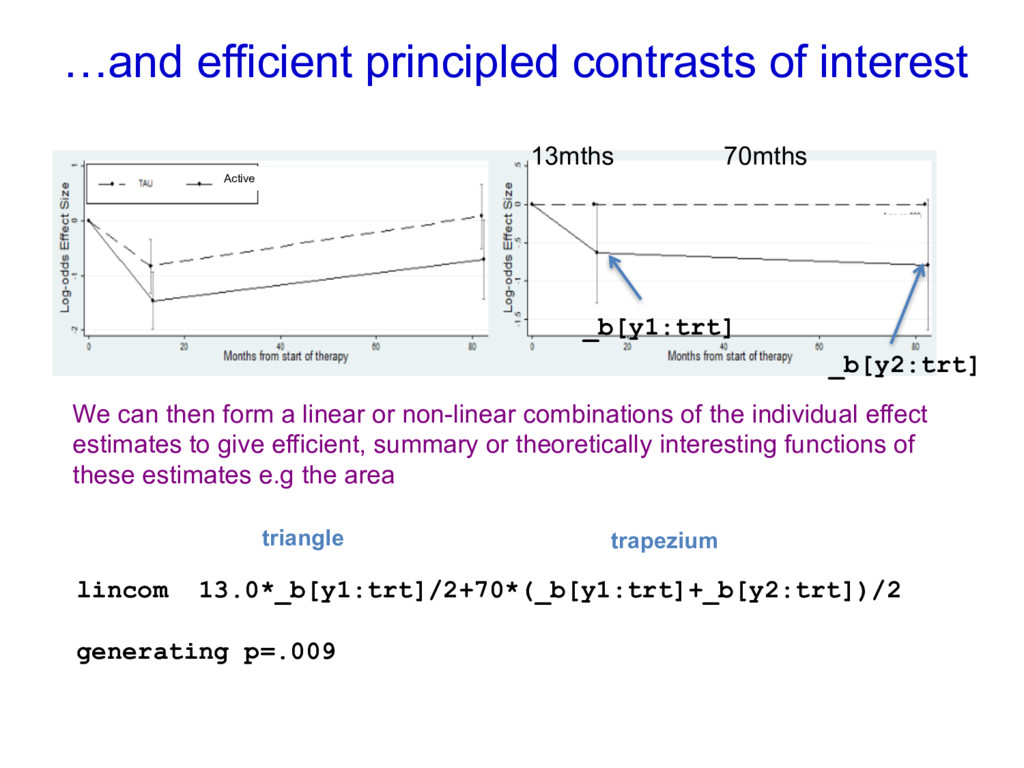
the individual effect estimates to give efficient, summary or theoretically interesting functions of these estimates e.g the area lincom 13.0*_b[y1:trt]/2+70*(_b[y1:trt]+_b[y2:trt])/2 generating p=.009 …and efficient principled contrasts of interest Active _b[y1:trt] _b[y2:trt] 13mths 70mths triangle trapezium
social communication therapy for young children with autism (PACT): long-term follow-up of a randomised controlled trial. Lancet. 2016 Oct 24. pii: S0140-6736(16)31229-6. doi: 10.1016/S0140- 6736(16)31229-6
British Autism Study of Infant Siblings (BASIS) Team. Randomised trial of a parent-mediated intervention for infants at high risk for autism: longitudinal outcomes to age three years. J Child Psychol Psychiatry 2017