multilevel estimation framework: Multivariate joint models and more Statistical Analysis of Multi-Outcome Data University of Liverpool 3rd July 2017 Michael J. Crowther Biostatistics Research Group, Department of Health Sciences, University of Leicester, UK, [email protected] @Crowther MJ Funding: MRC NIRG (MR/P015433/1) Michael J. Crowther Joint Modelling 3rd July 2017 1 / 51
I was awarded my PhD in November 2014, titled “Development and application of methodology for the parametric analysis of complex survival and joint longitudinal-survival data in biomedical research” Michael J. Crowther Joint Modelling 3rd July 2017 3 / 51
I was awarded my PhD in November 2014, titled “Development and application of methodology for the parametric analysis of complex survival and joint longitudinal-survival data in biomedical research” I was a post-doctoral biostatistician at Karolinska Institutet, 1st February 2015 - 29th February 2016, working mainly on parametric multi-state survival models Michael J. Crowther Joint Modelling 3rd July 2017 3 / 51
I was awarded my PhD in November 2014, titled “Development and application of methodology for the parametric analysis of complex survival and joint longitudinal-survival data in biomedical research” I was a post-doctoral biostatistician at Karolinska Institutet, 1st February 2015 - 29th February 2016, working mainly on parametric multi-state survival models I’m now a Lecturer in Biostatistics at the University of Leicester, where my work focuses on: Joint modelling of longitudinal and survival data Multi-state survival models Survival analysis methods for analysis of electronic health records, mainly in CVD and cancer Michael J. Crowther Joint Modelling 3rd July 2017 3 / 51
Given the current trend in improved availability in both access to data, and volume of data, there is the ever increasing need for efficient, and appropriate statistical modelling techniques, and implementations Michael J. Crowther Joint Modelling 3rd July 2017 5 / 51
Given the current trend in improved availability in both access to data, and volume of data, there is the ever increasing need for efficient, and appropriate statistical modelling techniques, and implementations Consider the EHR, we inevitably have a complex hierarchical structure to the data, such as multiple biomarkers measured repeatedly < patients < GP practice area < geographical regions, and so on Michael J. Crowther Joint Modelling 3rd July 2017 5 / 51
Given the current trend in improved availability in both access to data, and volume of data, there is the ever increasing need for efficient, and appropriate statistical modelling techniques, and implementations Consider the EHR, we inevitably have a complex hierarchical structure to the data, such as multiple biomarkers measured repeatedly < patients < GP practice area < geographical regions, and so on Further challenges include time-dependent effects, and non-linear covariate effects, both of which are arguably commonplace in many settings Michael J. Crowther Joint Modelling 3rd July 2017 5 / 51
Given the current trend in improved availability in both access to data, and volume of data, there is the ever increasing need for efficient, and appropriate statistical modelling techniques, and implementations Consider the EHR, we inevitably have a complex hierarchical structure to the data, such as multiple biomarkers measured repeatedly < patients < GP practice area < geographical regions, and so on Further challenges include time-dependent effects, and non-linear covariate effects, both of which are arguably commonplace in many settings Therefore, the need for appropriate modelling frameworks which can accommodate such complex structures is paramount Michael J. Crowther Joint Modelling 3rd July 2017 5 / 51
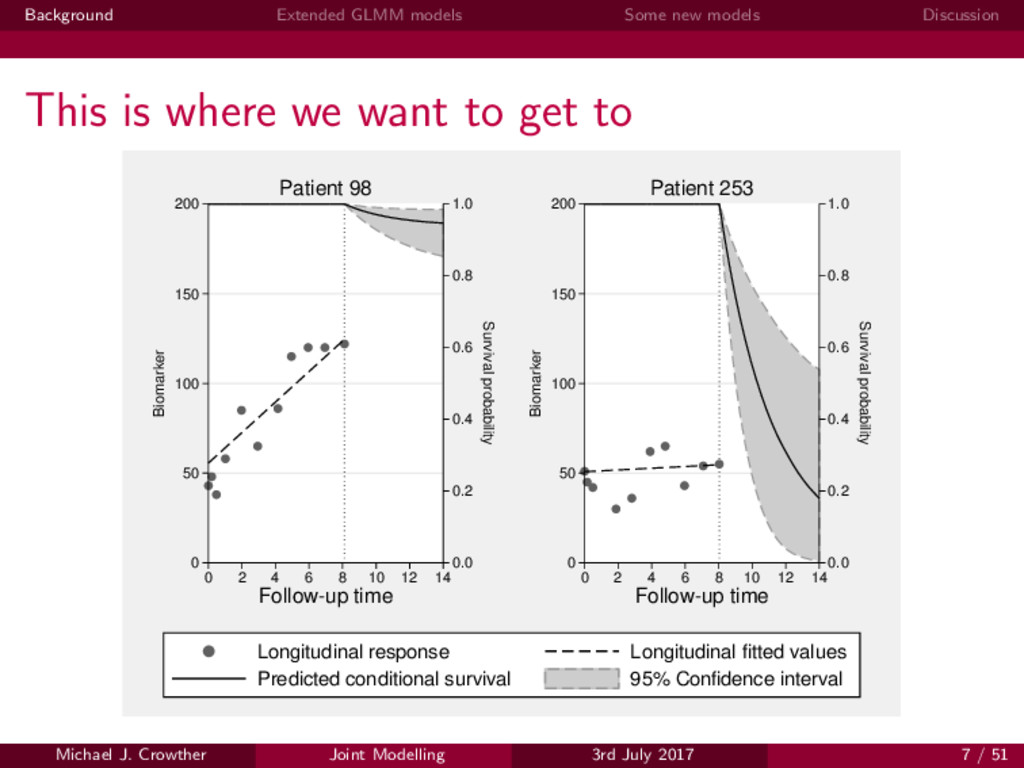
Joint longitudinal-survival models (JLSMs) [1] A model is specified for each outcome, with some form of sharing between outcome models, often done through shared or correlated random effects Michael J. Crowther Joint Modelling 3rd July 2017 6 / 51
Joint longitudinal-survival models (JLSMs) [1] A model is specified for each outcome, with some form of sharing between outcome models, often done through shared or correlated random effects Commonplace in JLSMs is linking the ‘current value’ of the longitudinal outcome, directly to survival, through its expected value conditional on subject-specific random effects Michael J. Crowther Joint Modelling 3rd July 2017 6 / 51
Joint longitudinal-survival models (JLSMs) [1] A model is specified for each outcome, with some form of sharing between outcome models, often done through shared or correlated random effects Commonplace in JLSMs is linking the ‘current value’ of the longitudinal outcome, directly to survival, through its expected value conditional on subject-specific random effects Alternatives include transformations of the current value, e.g. its gradient, or its integral Michael J. Crowther Joint Modelling 3rd July 2017 6 / 51
Joint longitudinal-survival models (JLSMs) [1] A model is specified for each outcome, with some form of sharing between outcome models, often done through shared or correlated random effects Commonplace in JLSMs is linking the ‘current value’ of the longitudinal outcome, directly to survival, through its expected value conditional on subject-specific random effects Alternatives include transformations of the current value, e.g. its gradient, or its integral These are clinically plausible ways to link such outcomes in many settings, and give us interpretable association parameters, irrespective of how complex the longitudinal model specification may be (such as when using splines). Michael J. Crowther Joint Modelling 3rd July 2017 6 / 51
There has been a tremendous amount of work in this area Competing risks [2] Different types of outcomes [3] Multiple continuous outcomes [4] Delayed entry [5] Recurrent events and a terminal event [6] Prediction [7] Many others... Michael J. Crowther Joint Modelling 3rd July 2017 8 / 51
are always limited by availability of user-friendly software frailtypack in R [8] stjm in Stata [9] joineR in R [10] JM and JMBayes in R [11, 12] Many others... Michael J. Crowther Joint Modelling 3rd July 2017 9 / 51
My aim in this work is to provide a general framework for the analysis of clustered data, which can encompass; Multiple outcomes of varying types Measurement schedule can vary across outcomes Any number of levels Any number of random effects at each level Sharing and linking random effects between outcomes Sharing functions of the expected value of other outcomes Useful predictions A reliable estimation engine Easily extendable by the user Much more... Michael J. Crowther Joint Modelling 3rd July 2017 10 / 51
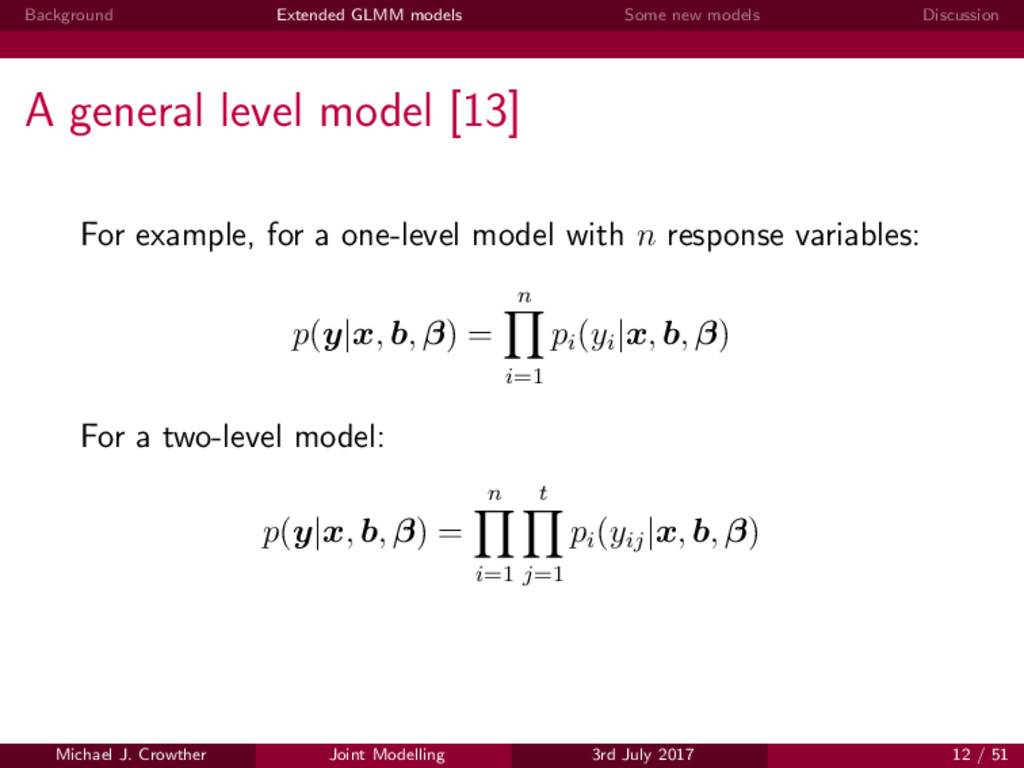
level model [13] For example, for a one-level model with n response variables: p(y|x, b, β) = n i=1 pi (yi |x, b, β) For a two-level model: p(y|x, b, β) = n i=1 t j=1 pi (yij |x, b, β) Michael J. Crowther Joint Modelling 3rd July 2017 12 / 51
level model [13] The log likelihood is obtained by integrating out the unobserved random effects, to obtain a marginal log likelihood, ll(β) = log Rr p(y|x, b, β)φ(b|Σb ) db (1) where Rr is the r-dimensional space, with each dimension spanning the real number line, and r the dimension of the random effects b. We assume φ() is multivariate normal density for b, with mean vector 0 and variance-covariance matrix Σb . Equation (1) can be expanded with further levels of nesting, with Σb becoming block diagonal, with a block for each level. I’ll refer to this as ll1. Michael J. Crowther Joint Modelling 3rd July 2017 13 / 51
conditional independence amongst level l − 1 units, given the random effects at higher levels, ll(β) = log φ(b(L)|Σ(L)) p(L−1)(y|x, bL, β) db(L) where, for l = 2, . . . , L p(l)(y|x, Bl+1, β) = φ(b(l)|Σ(l)) p(l−1)(y|x, Bl, β) db(l) I’ll refer to this as ll2 Michael J. Crowther Joint Modelling 3rd July 2017 14 / 51
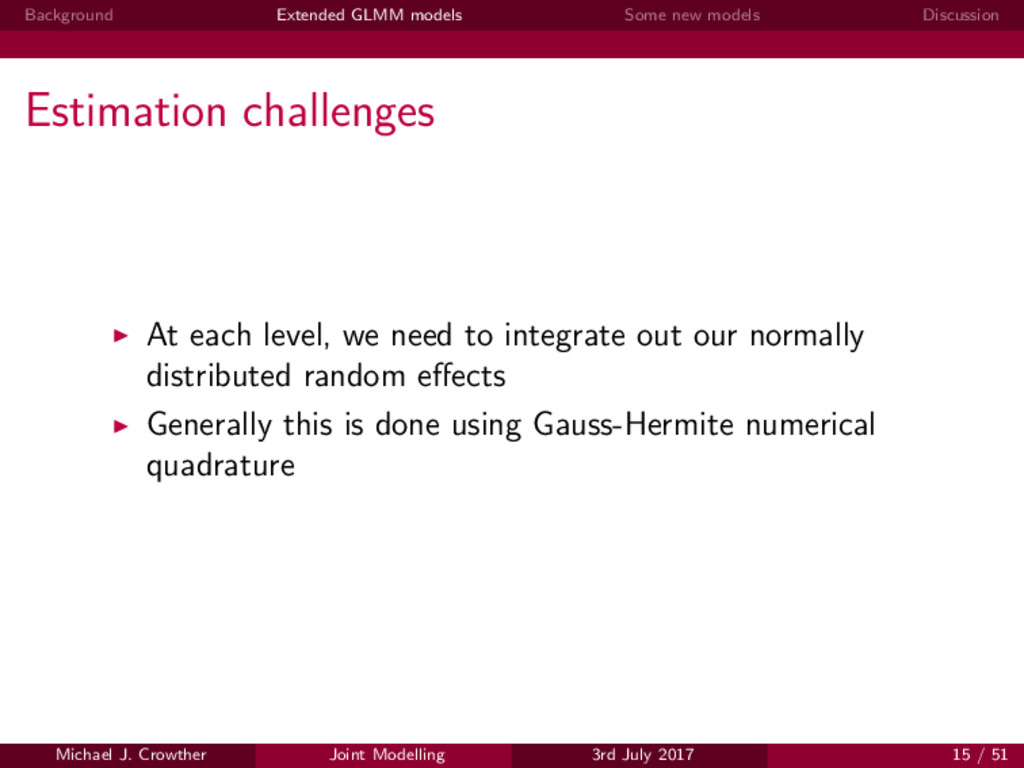
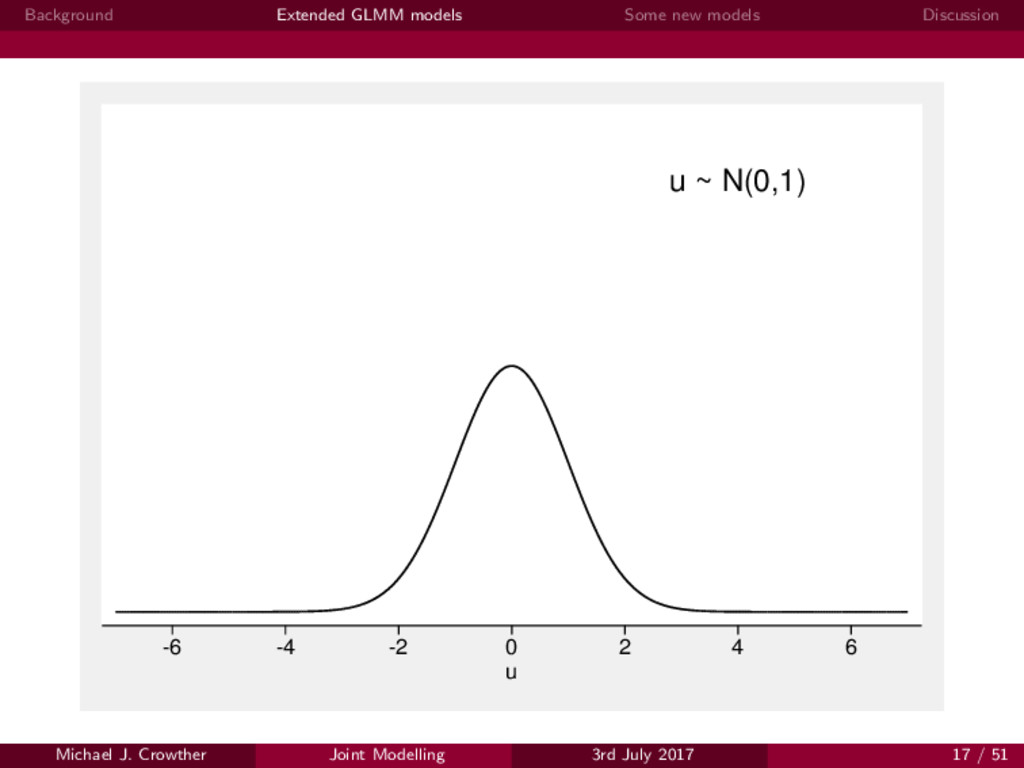
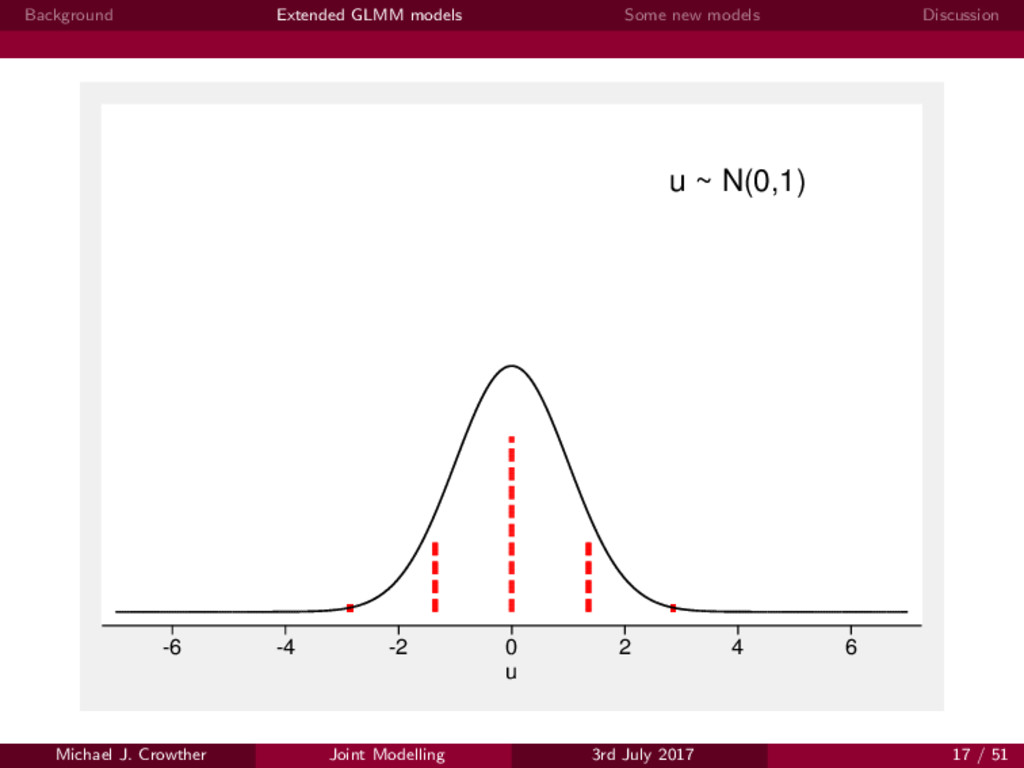
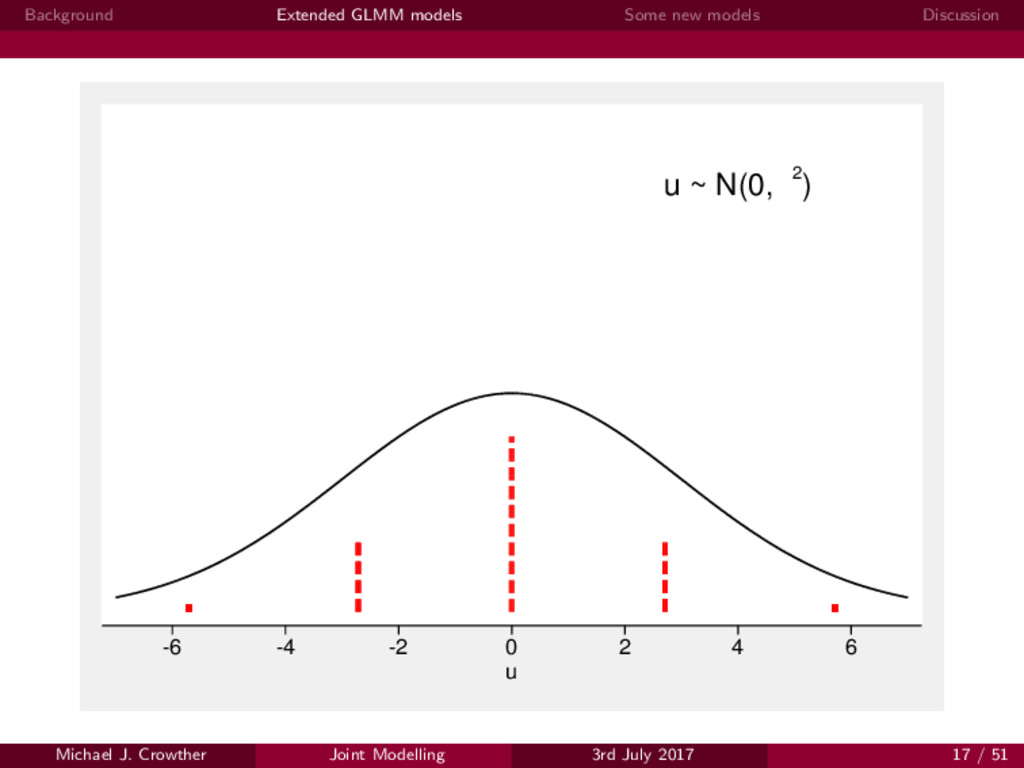
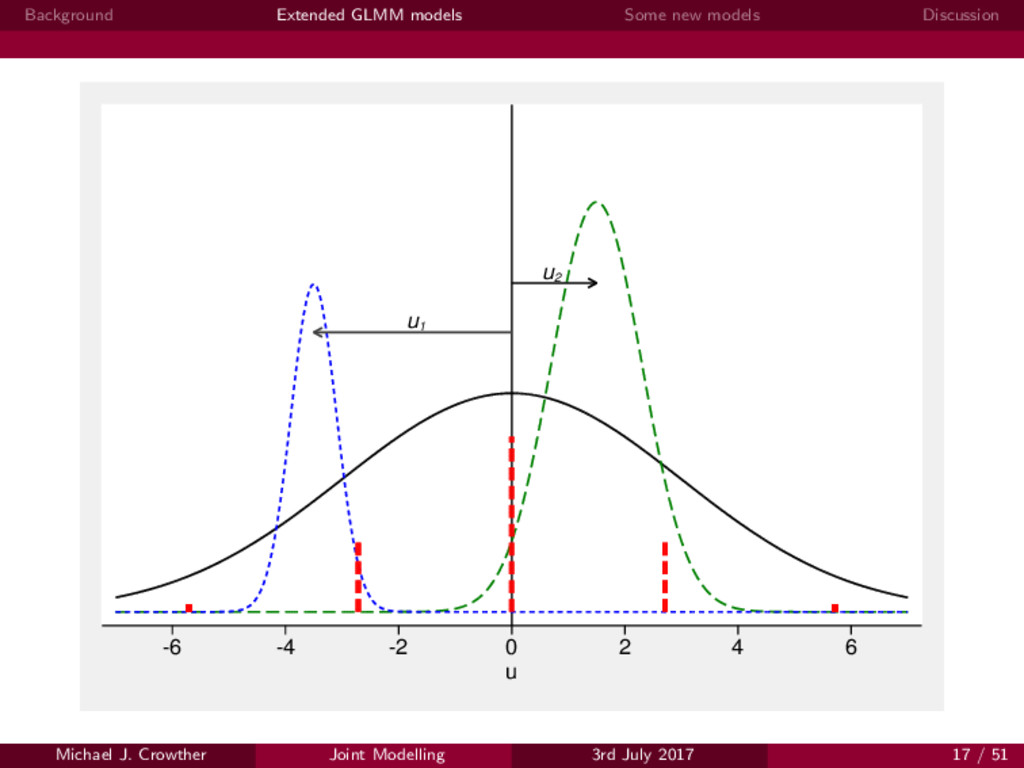
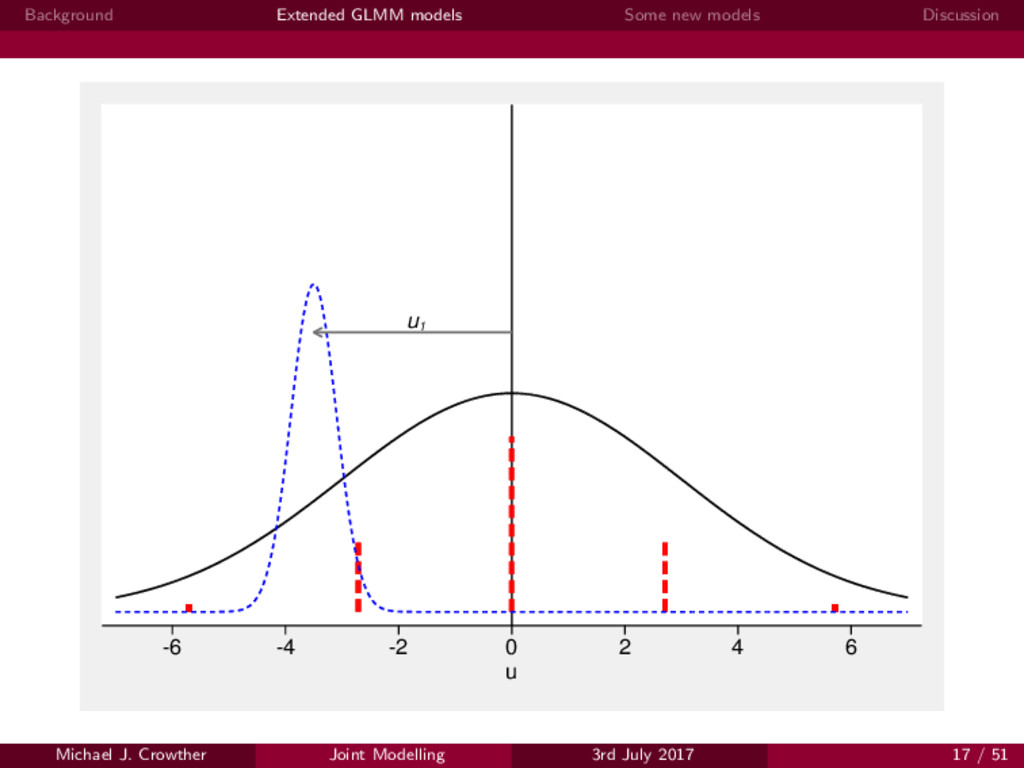
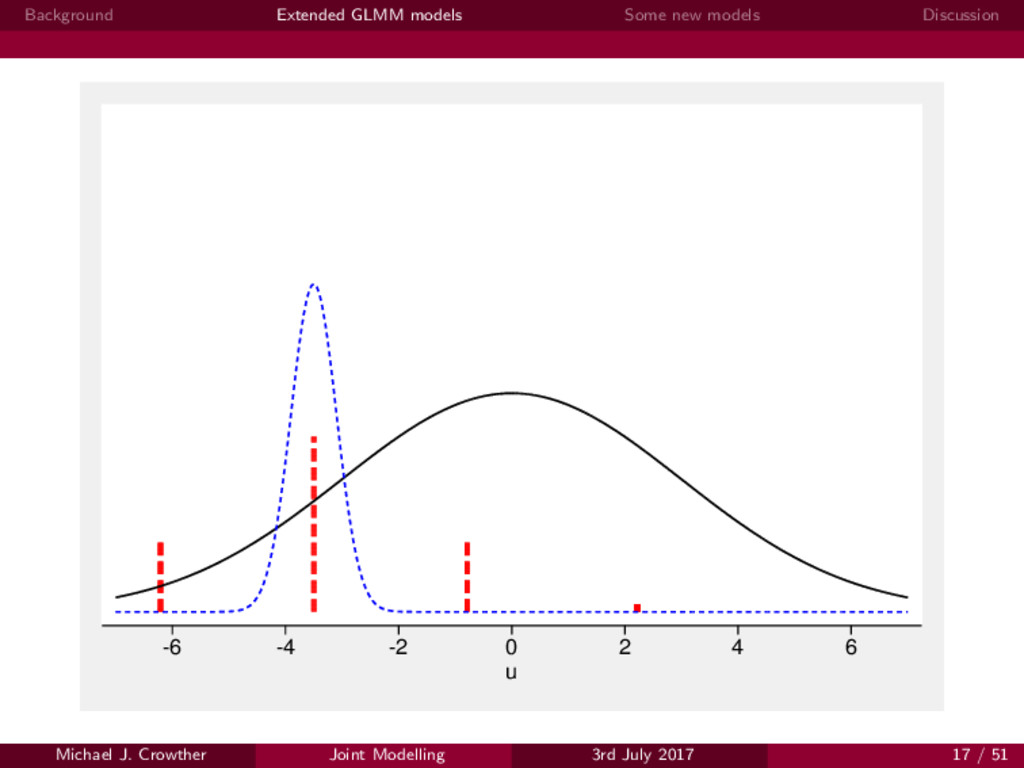
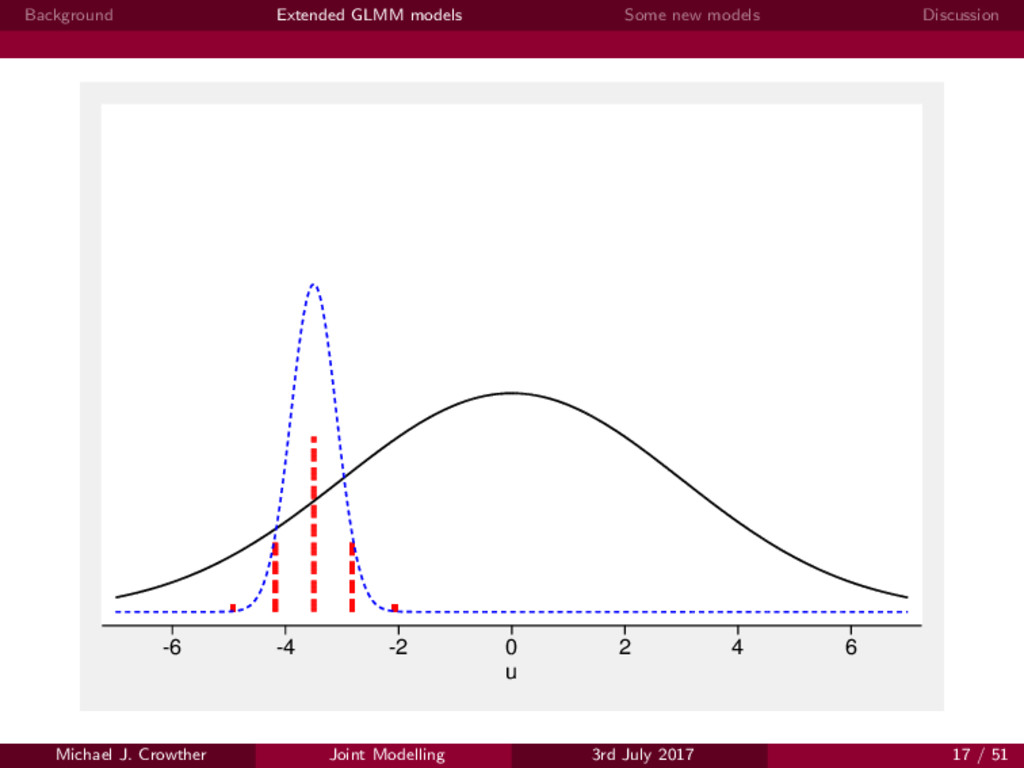
At each level, we need to integrate out our normally distributed random effects Generally this is done using Gauss-Hermite numerical quadrature Michael J. Crowther Joint Modelling 3rd July 2017 15 / 51
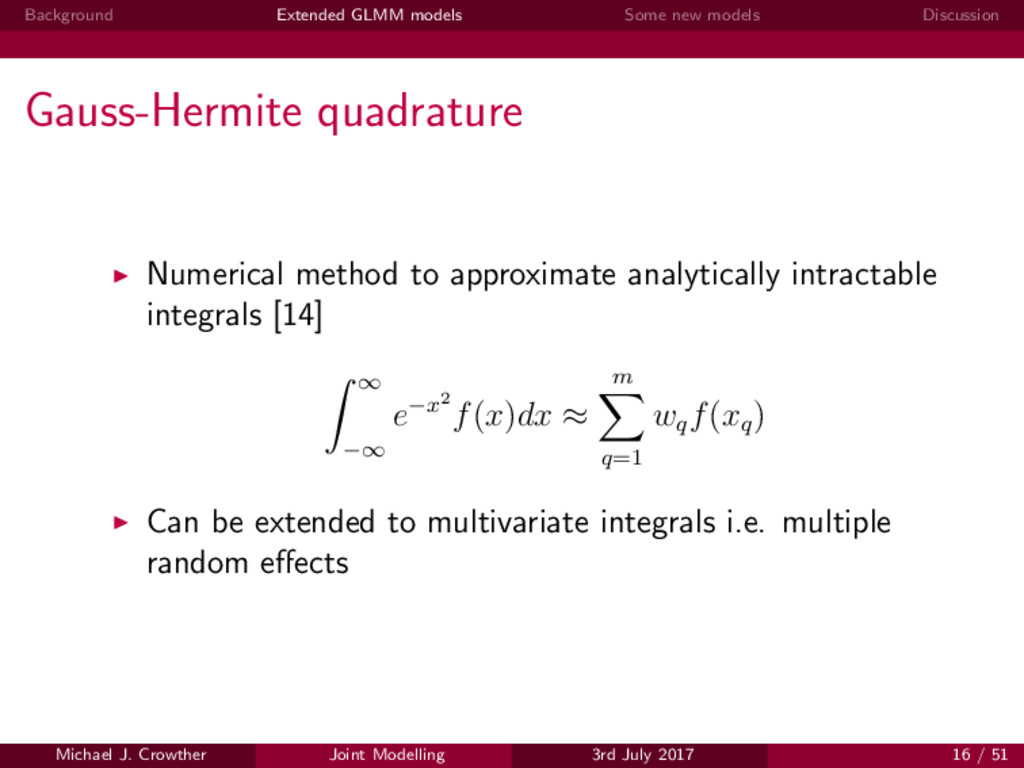
Numerical method to approximate analytically intractable integrals [14] ∞ −∞ e−x2 f(x)dx ≈ m q=1 wq f(xq ) Can be extended to multivariate integrals i.e. multiple random effects Michael J. Crowther Joint Modelling 3rd July 2017 16 / 51
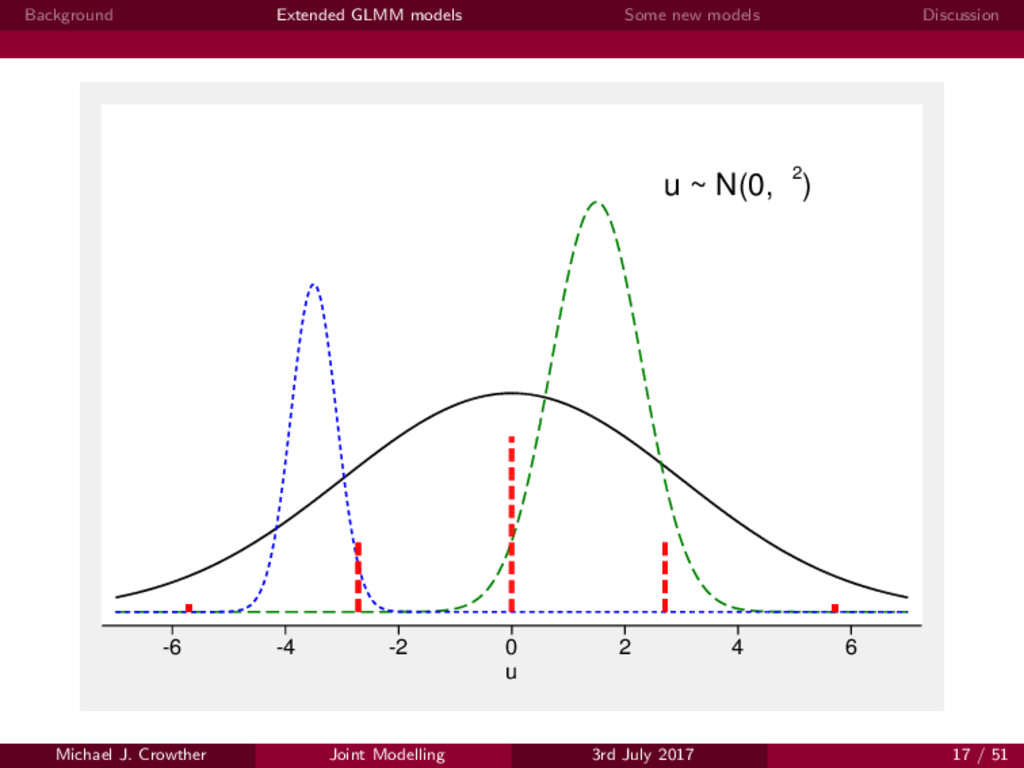
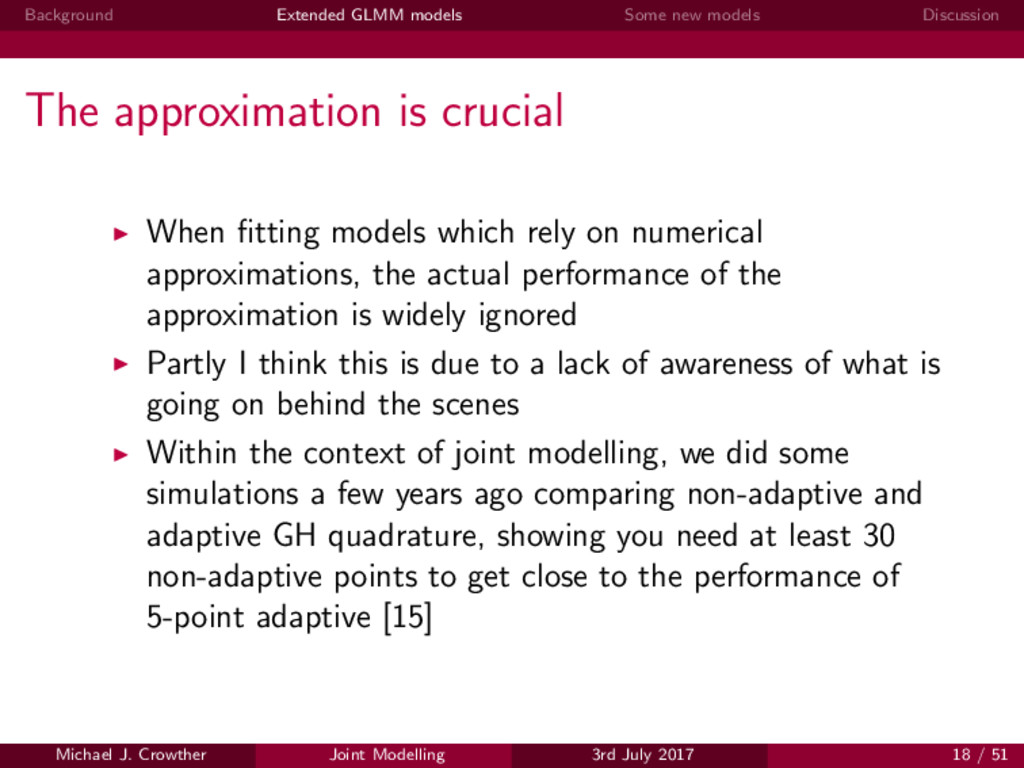
is crucial When fitting models which rely on numerical approximations, the actual performance of the approximation is widely ignored Partly I think this is due to a lack of awareness of what is going on behind the scenes Within the context of joint modelling, we did some simulations a few years ago comparing non-adaptive and adaptive GH quadrature, showing you need at least 30 non-adaptive points to get close to the performance of 5-point adaptive [15] Michael J. Crowther Joint Modelling 3rd July 2017 18 / 51
issue with GH quadrature is it doesn’t scale up well, for example, say we conduct 7-point quadrature, well for 1 random effect we evaluate our function at 7-points Say we have 3 biomarkers, each with a random intercept and linear slope, then for 6 random effects, we evaluate it at 76 = 117, 649 points An alternative is Monte Carlo integration Michael J. Crowther Joint Modelling 3rd July 2017 19 / 51
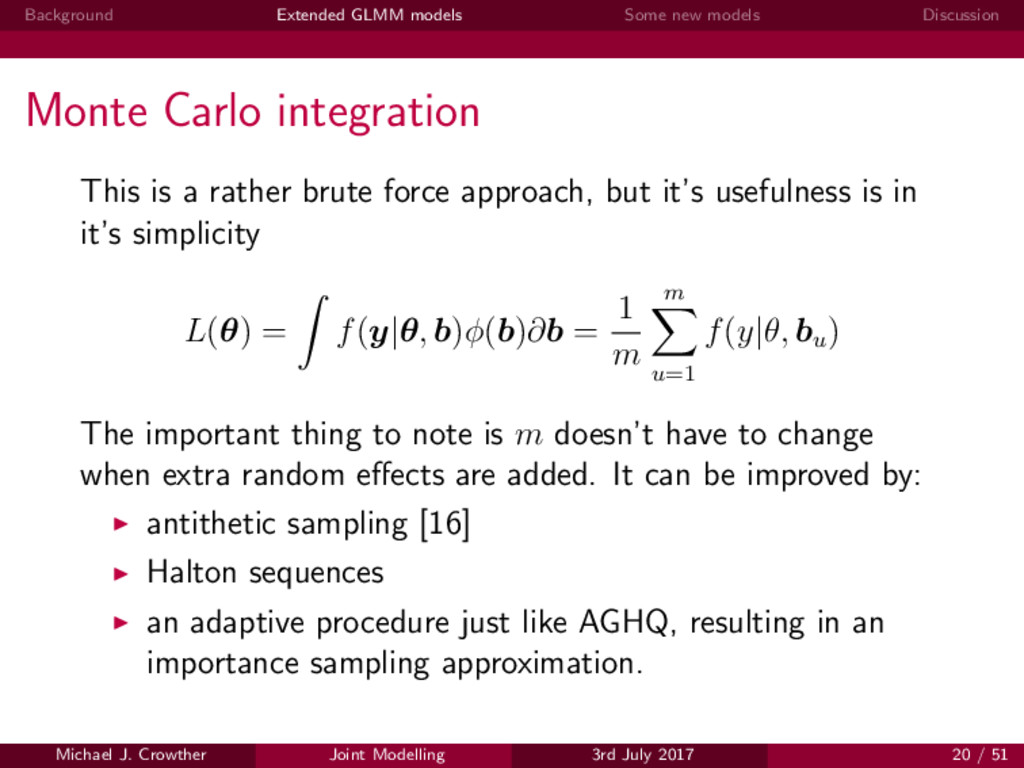
integration This is a rather brute force approach, but it’s usefulness is in it’s simplicity L(θ) = f(y|θ, b)φ(b)∂b = 1 m m u=1 f(y|θ, bu ) The important thing to note is m doesn’t have to change when extra random effects are added. It can be improved by: antithetic sampling [16] Halton sequences an adaptive procedure just like AGHQ, resulting in an importance sampling approximation. Michael J. Crowther Joint Modelling 3rd July 2017 20 / 51
techniques and random effect distributions The methods described above all assume the same distributional family for the random effects, across all levels of a model. Returning to ll2, our nested marginal likelihood, we can easily relax this, ll(θ) = log φL (b(L)|Σ(L)) p(L−1)(y|x, bL, β) db(L) where, for l = 2, . . . , L p(l)(y|x, Bl+1, β) = φl (b(l))|Σ(l) p(l−1)(y|x, Bl, β) db(l) where φl (b(l)|Σ(l)) for l = 2, . . . , L is now level-specific Michael J. Crowther Joint Modelling 3rd July 2017 21 / 51
techniques and random effect distributions This formulation now allows us to specify different distributions at each level Assess robustness using the t-distribution Issue of which integration techniques to apply at each level e.g. one random effect at level 3, many at level 2, then use AGHQ at level 3, and MCI at level 2 Michael J. Crowther Joint Modelling 3rd July 2017 22 / 51
The standard linear predictor for a general level model can be written as follows, η = Xβ + L l=2 Xlbl where subscripts are omitted for ease of exposition. We have X our vector of covariates, which could vary at any level, with associated fixed effect coefficient vector β, and Xl the vector of covariates with random effects bl at level l. Michael J. Crowther Joint Modelling 3rd July 2017 23 / 51
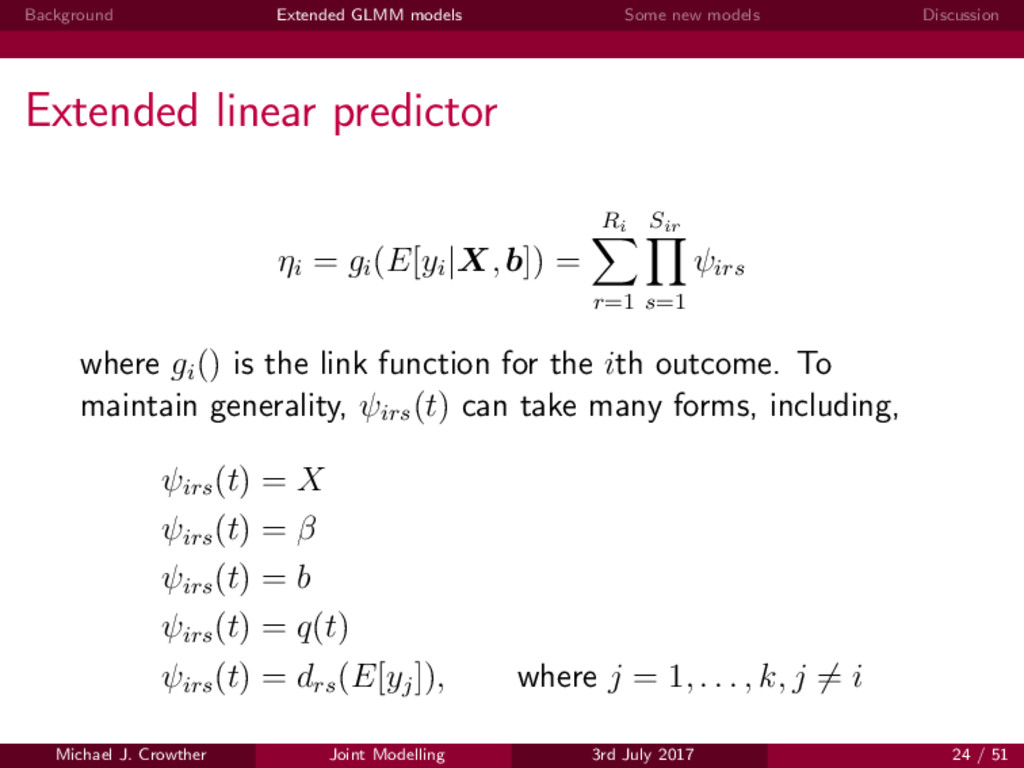
predictor ηi = gi (E[yi |X, b]) = Ri r=1 Sir s=1 ψirs where gi () is the link function for the ith outcome. To maintain generality, ψirs (t) can take many forms, including, ψirs (t) = X ψirs (t) = β ψirs (t) = b ψirs (t) = q(t) ψirs (t) = drs (E[yj ]), where j = 1, . . . , k, j = i Michael J. Crowther Joint Modelling 3rd July 2017 24 / 51
Stata Everything I’ve talked about will be available in the megenreg package in Stata It is a simplified/modified version of Stata’s official gsem, which itself is ridiculously powerful, and was based on gllamm [13] megenreg will have many extensions, such as Alternative models, such as spline based survival models Extending sharing between outcomes, motivated by joint modelling User-defined likelihood functions Other things... Michael J. Crowther Joint Modelling 3rd July 2017 25 / 51
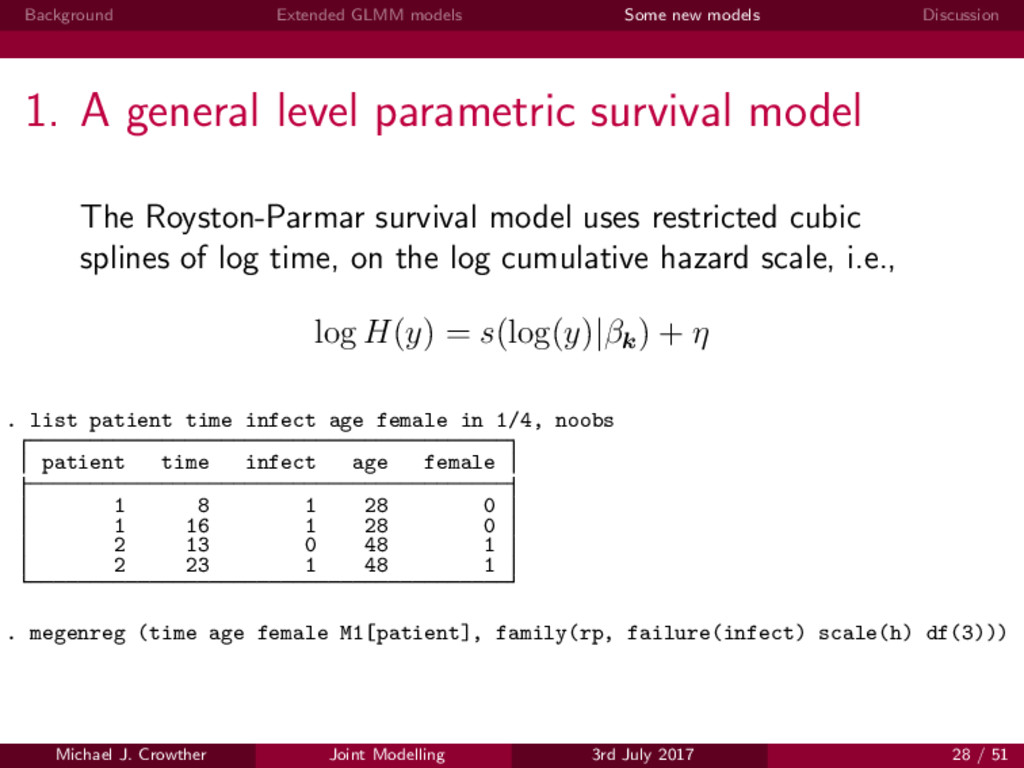
general level parametric survival model The Royston-Parmar survival model uses restricted cubic splines of log time, on the log cumulative hazard scale, i.e., log H(y) = s(log(y)|βk ) + η . list patient time infect age female in 1/4, noobs patient time infect age female 1 8 1 28 0 1 16 1 28 0 2 13 0 48 1 2 23 1 48 1 . megenreg (time age female M1[patient], family(rp, failure(infect) scale(h) df(3))) Michael J. Crowther Joint Modelling 3rd July 2017 28 / 51
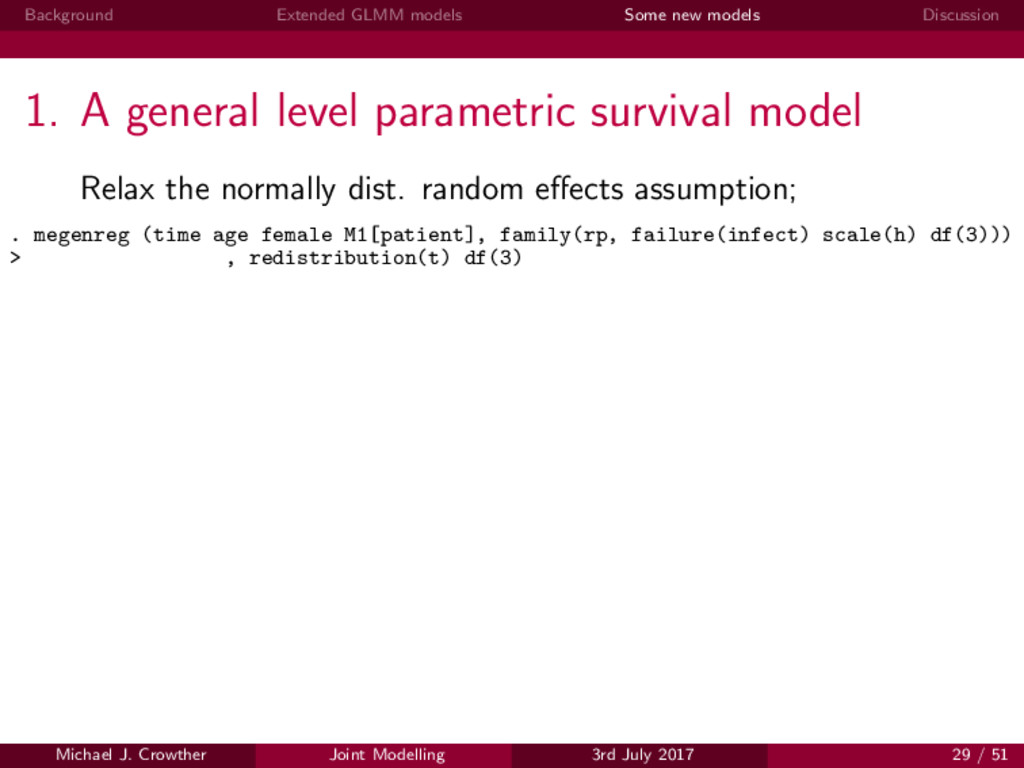
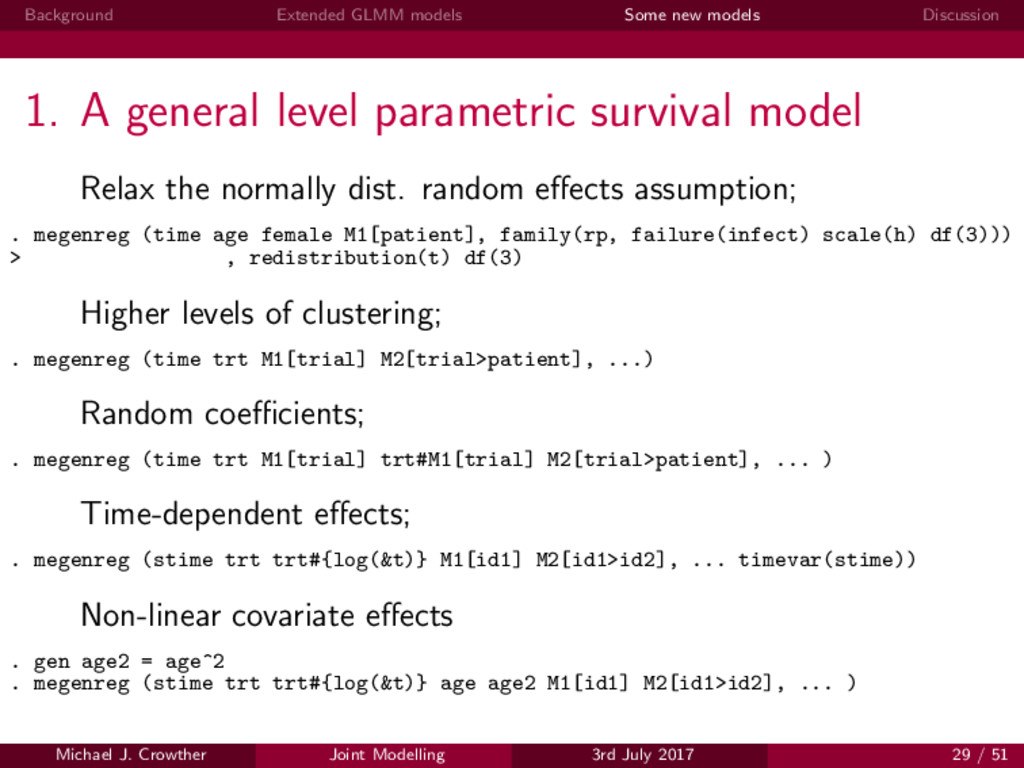
general level parametric survival model Relax the normally dist. random effects assumption; . megenreg (time age female M1[patient], family(rp, failure(infect) scale(h) df(3))) > , redistribution(t) df(3) Michael J. Crowther Joint Modelling 3rd July 2017 29 / 51
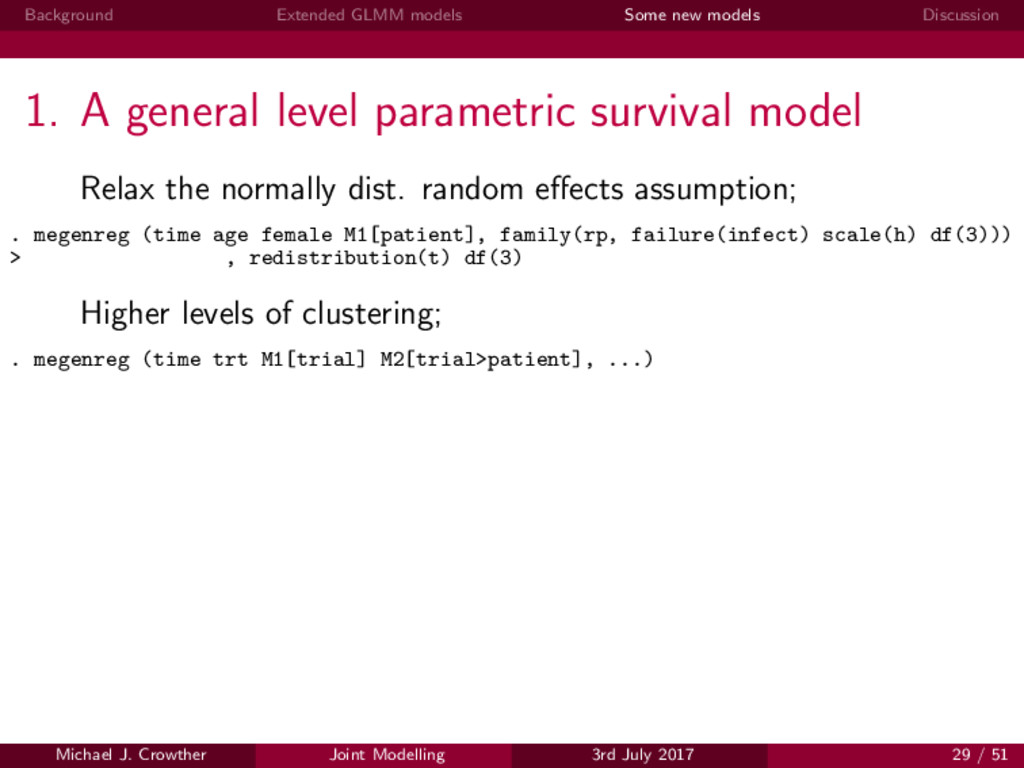
general level parametric survival model Relax the normally dist. random effects assumption; . megenreg (time age female M1[patient], family(rp, failure(infect) scale(h) df(3))) > , redistribution(t) df(3) Higher levels of clustering; . megenreg (time trt M1[trial] M2[trial>patient], ...) Michael J. Crowther Joint Modelling 3rd July 2017 29 / 51
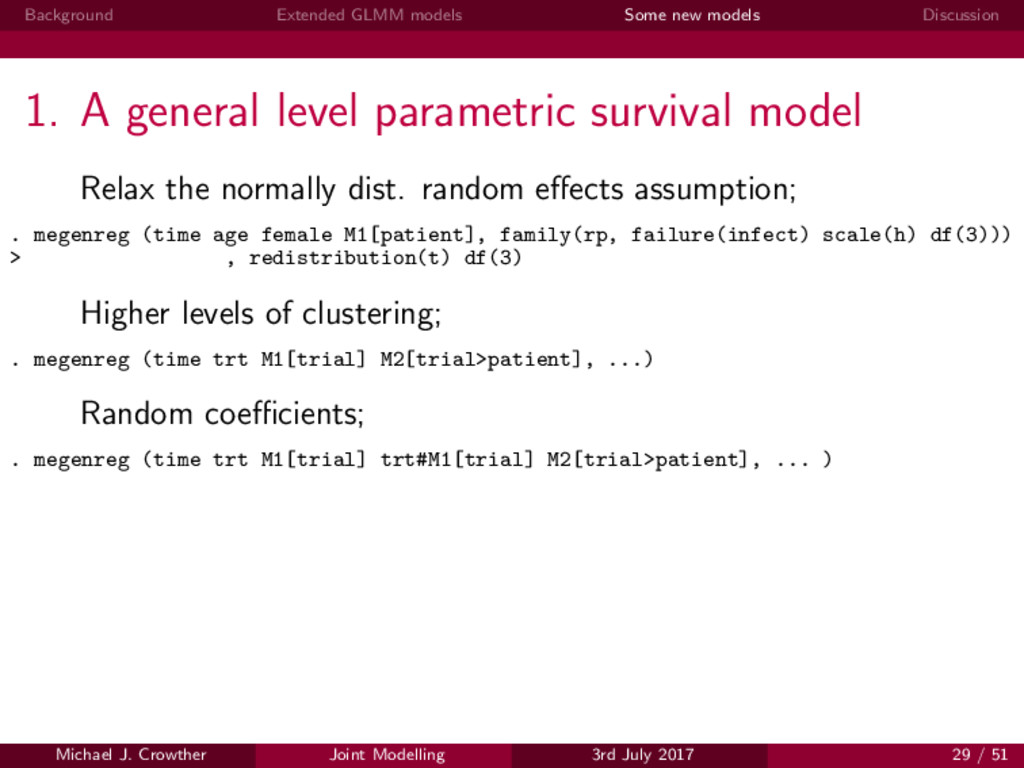
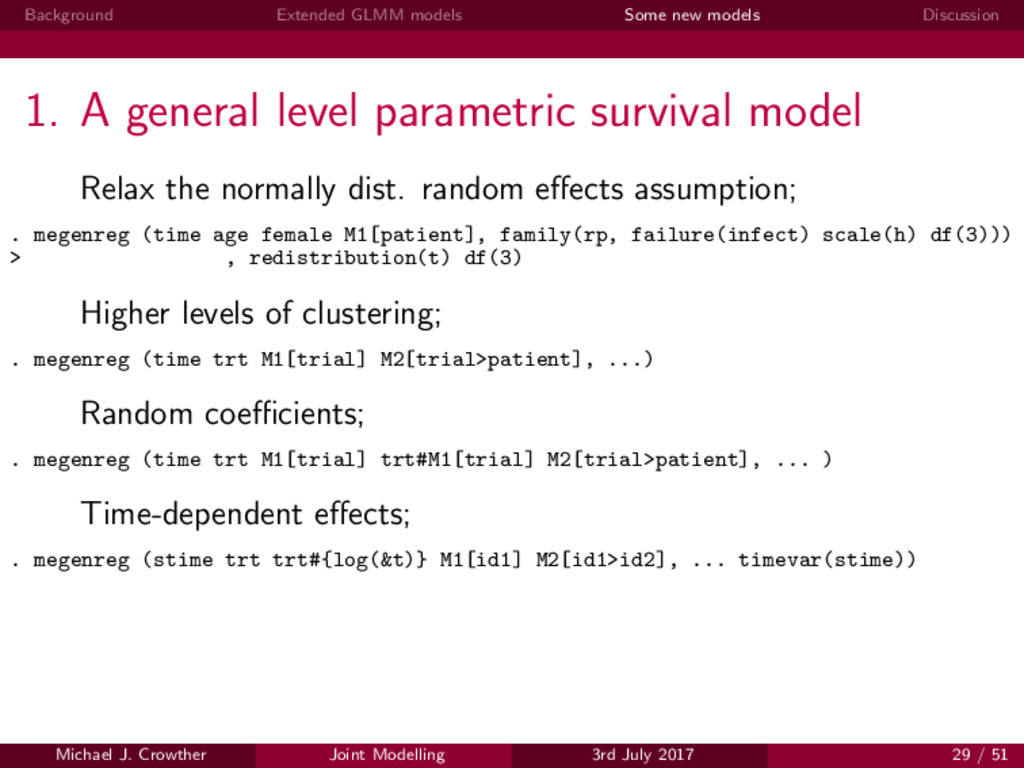
general level parametric survival model Relax the normally dist. random effects assumption; . megenreg (time age female M1[patient], family(rp, failure(infect) scale(h) df(3))) > , redistribution(t) df(3) Higher levels of clustering; . megenreg (time trt M1[trial] M2[trial>patient], ...) Random coefficients; . megenreg (time trt M1[trial] trt#M1[trial] M2[trial>patient], ... ) Michael J. Crowther Joint Modelling 3rd July 2017 29 / 51
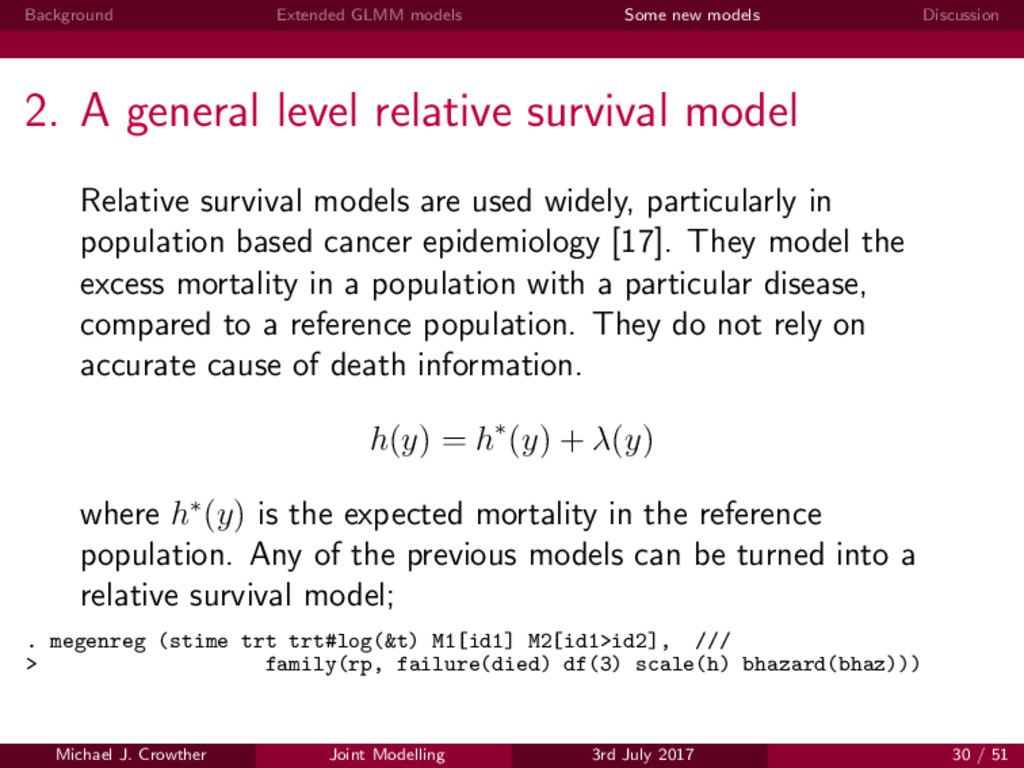
general level relative survival model Relative survival models are used widely, particularly in population based cancer epidemiology [17]. They model the excess mortality in a population with a particular disease, compared to a reference population. They do not rely on accurate cause of death information. h(y) = h∗(y) + λ(y) where h∗(y) is the expected mortality in the reference population. Any of the previous models can be turned into a relative survival model; . megenreg (stime trt trt#log(&t) M1[id1] M2[id1>id2], /// > family(rp, failure(died) df(3) scale(h) bhazard(bhaz))) Michael J. Crowther Joint Modelling 3rd July 2017 30 / 51
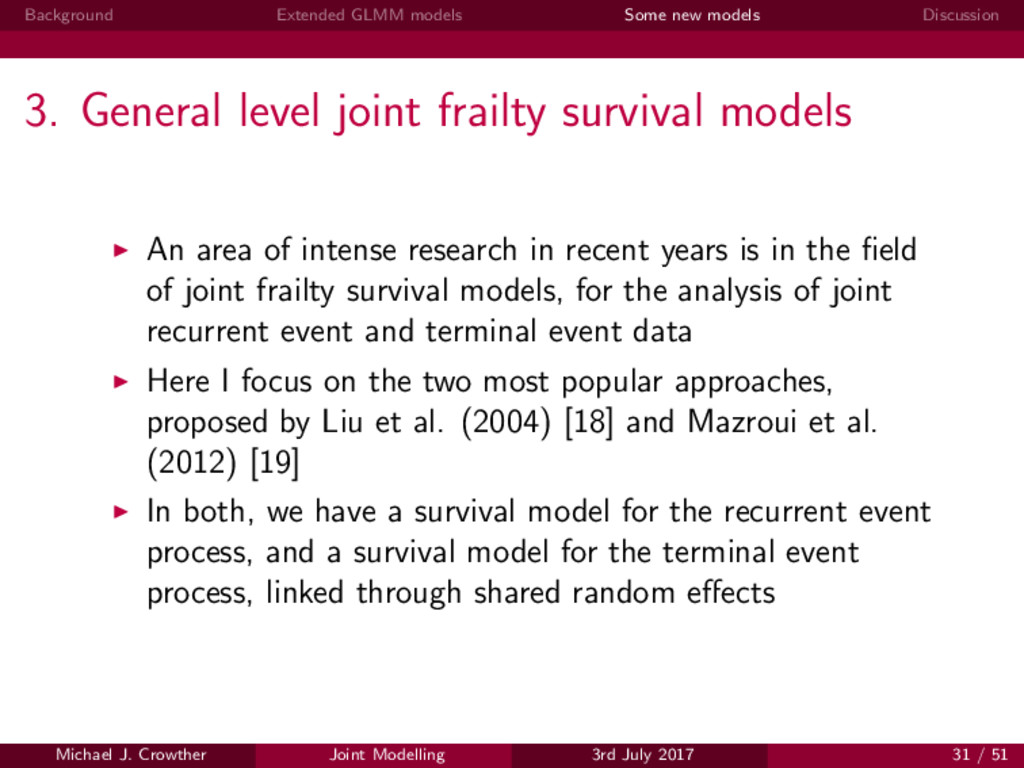
level joint frailty survival models An area of intense research in recent years is in the field of joint frailty survival models, for the analysis of joint recurrent event and terminal event data Here I focus on the two most popular approaches, proposed by Liu et al. (2004) [18] and Mazroui et al. (2012) [19] In both, we have a survival model for the recurrent event process, and a survival model for the terminal event process, linked through shared random effects Michael J. Crowther Joint Modelling 3rd July 2017 31 / 51
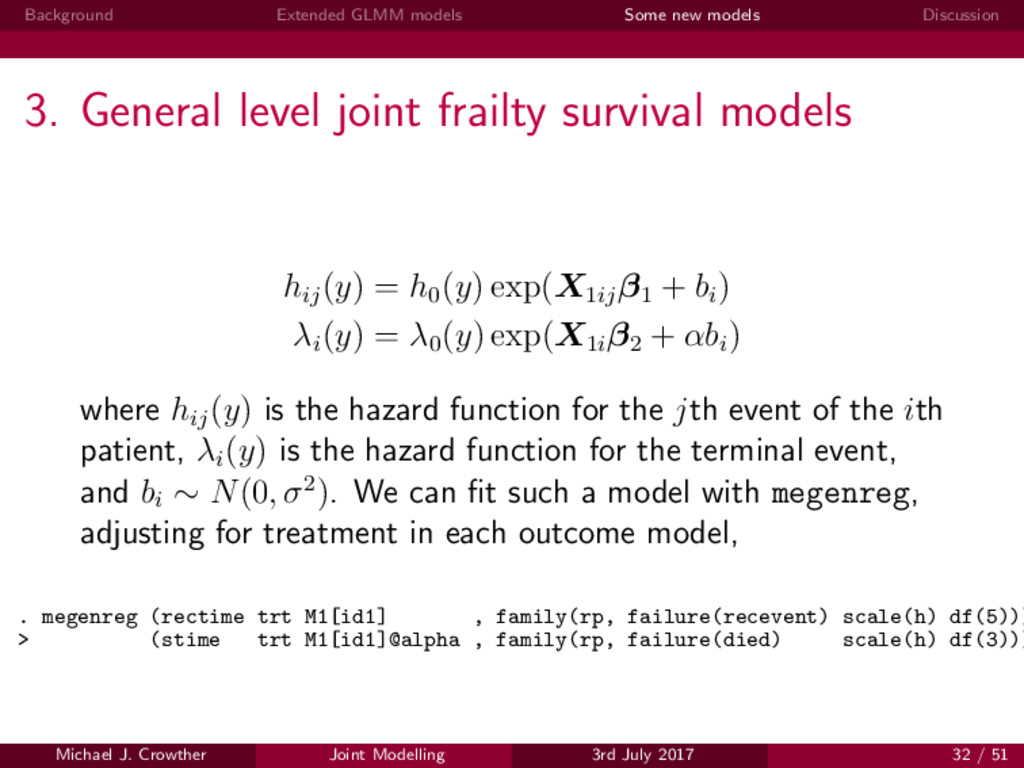
level joint frailty survival models hij (y) = h0 (y) exp(X1ij β1 + bi ) λi (y) = λ0 (y) exp(X1i β2 + αbi ) where hij (y) is the hazard function for the jth event of the ith patient, λi (y) is the hazard function for the terminal event, and bi ∼ N(0, σ2). We can fit such a model with megenreg, adjusting for treatment in each outcome model, . megenreg (rectime trt M1[id1] , family(rp, failure(recevent) scale(h) df(5))) > (stime trt M1[id1]@alpha , family(rp, failure(died) scale(h) df(3))) Michael J. Crowther Joint Modelling 3rd July 2017 32 / 51
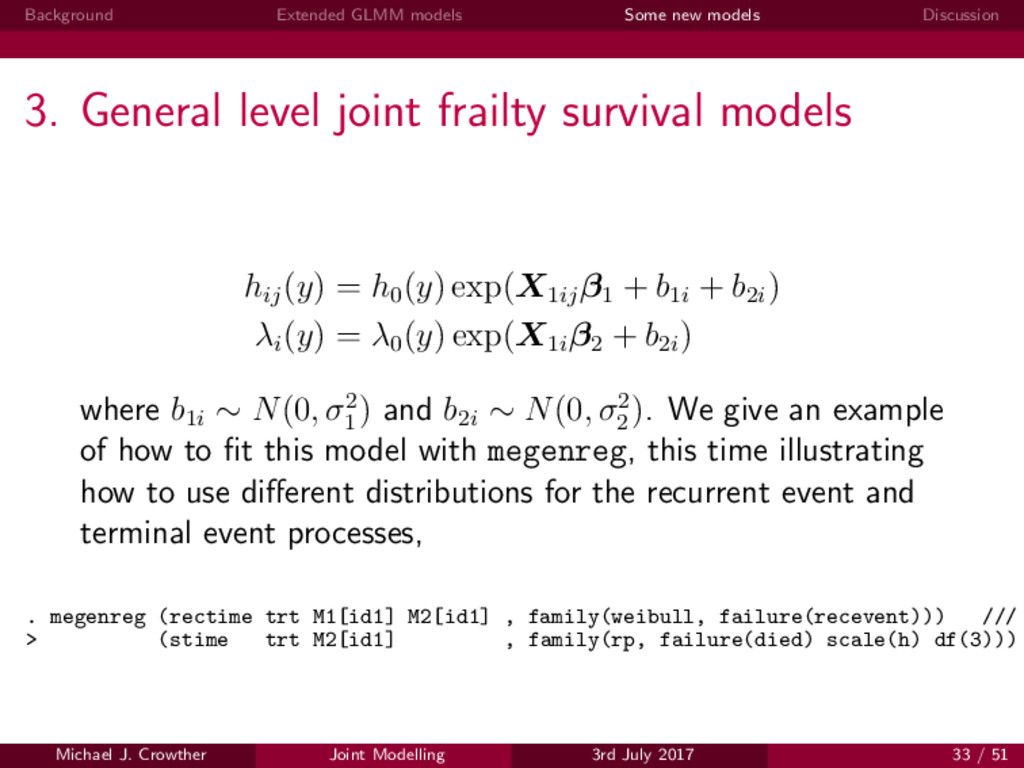
level joint frailty survival models hij (y) = h0 (y) exp(X1ij β1 + b1i + b2i ) λi (y) = λ0 (y) exp(X1i β2 + b2i ) where b1i ∼ N(0, σ2 1 ) and b2i ∼ N(0, σ2 2 ). We give an example of how to fit this model with megenreg, this time illustrating how to use different distributions for the recurrent event and terminal event processes, . megenreg (rectime trt M1[id1] M2[id1] , family(weibull, failure(recevent))) /// > (stime trt M2[id1] , family(rp, failure(died) scale(h) df(3))) Michael J. Crowther Joint Modelling 3rd July 2017 33 / 51
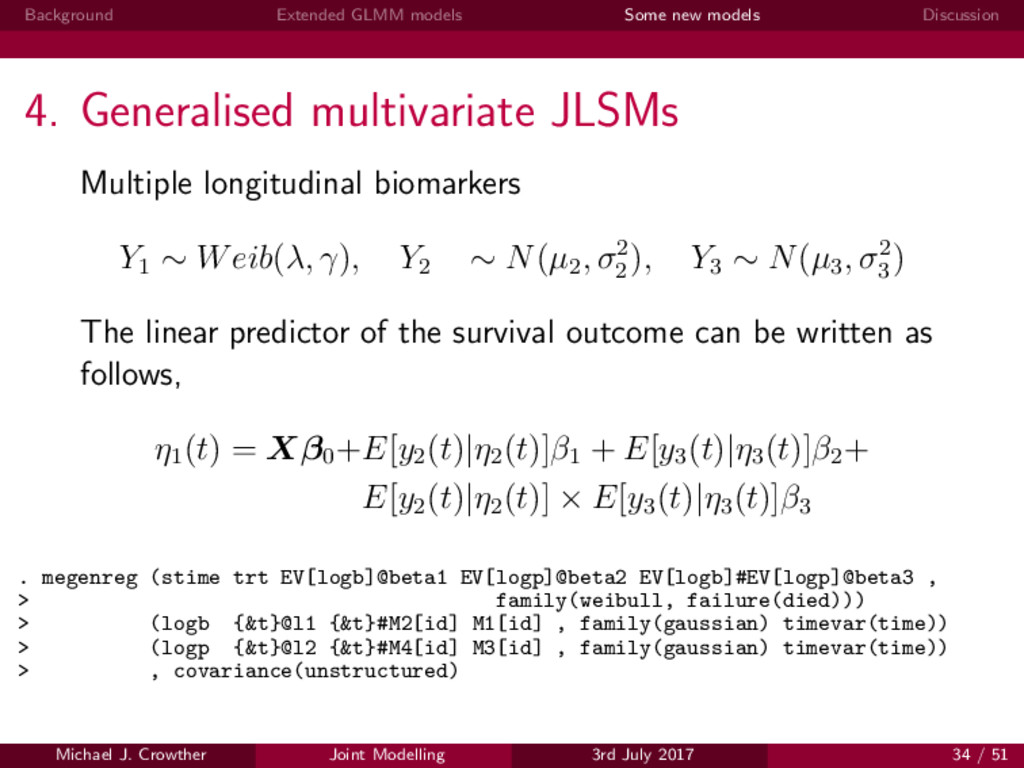
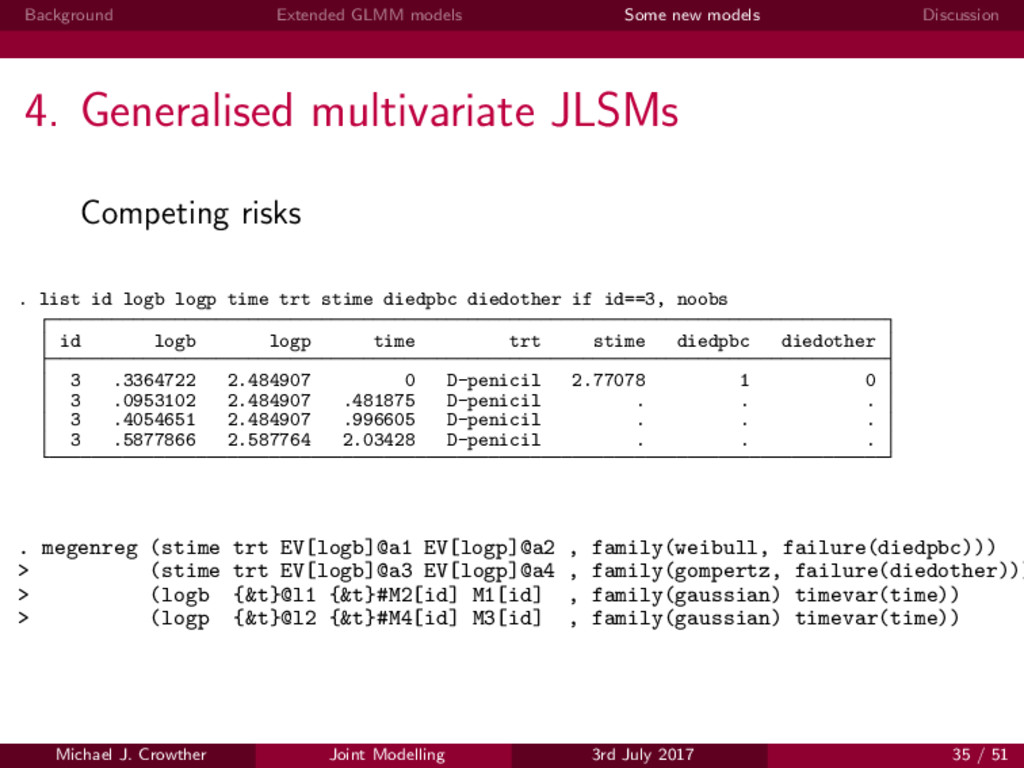
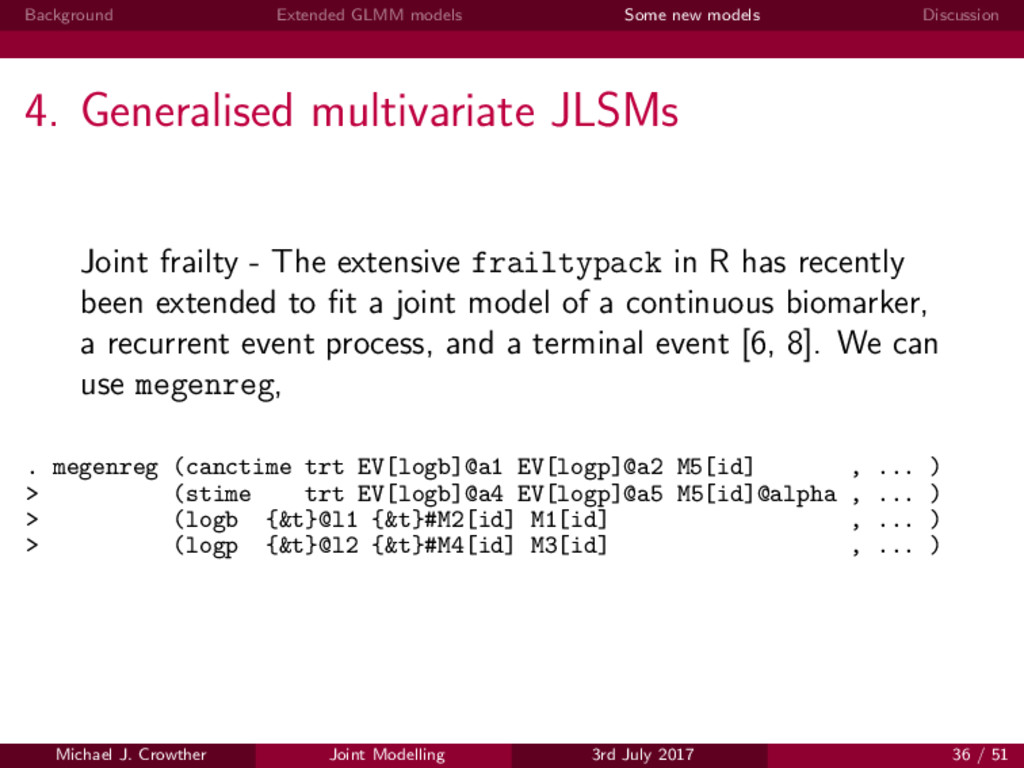
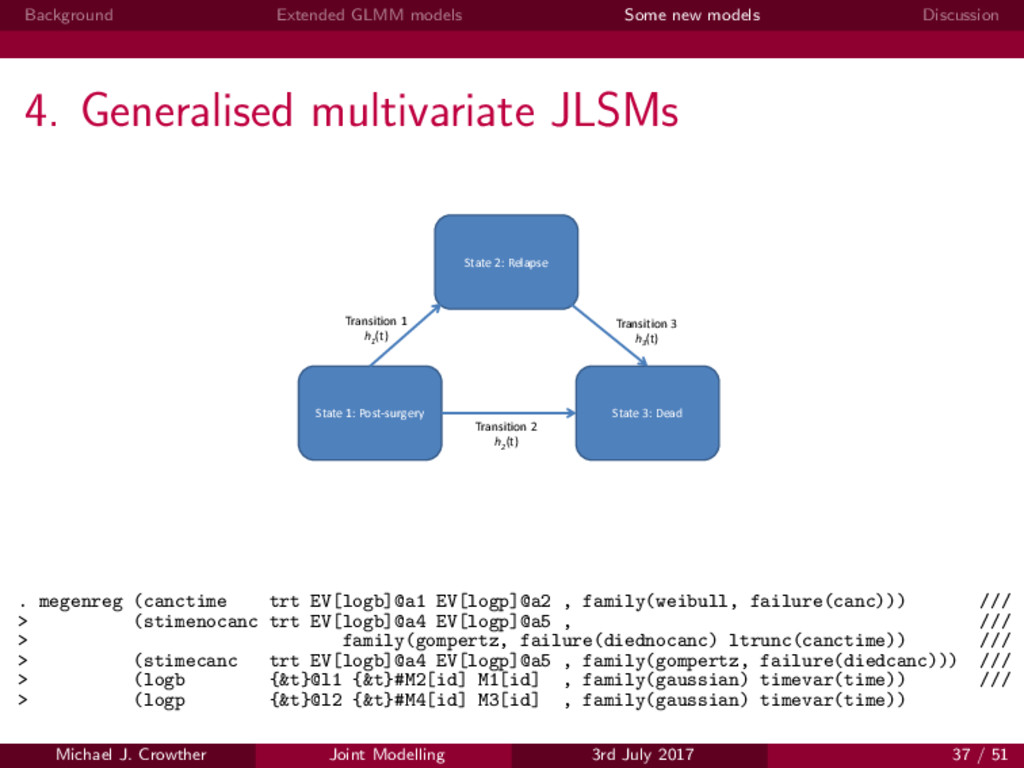
multivariate JLSMs Joint frailty - The extensive frailtypack in R has recently been extended to fit a joint model of a continuous biomarker, a recurrent event process, and a terminal event [6, 8]. We can use megenreg, . megenreg (canctime trt EV[logb]@a1 EV[logp]@a2 M5[id] , ... ) > (stime trt EV[logb]@a4 EV[logp]@a5 M5[id]@alpha , ... ) > (logb {&t}@l1 {&t}#M2[id] M1[id] , ... ) > (logp {&t}@l2 {&t}#M4[id] M3[id] , ... ) Michael J. Crowther Joint Modelling 3rd July 2017 36 / 51
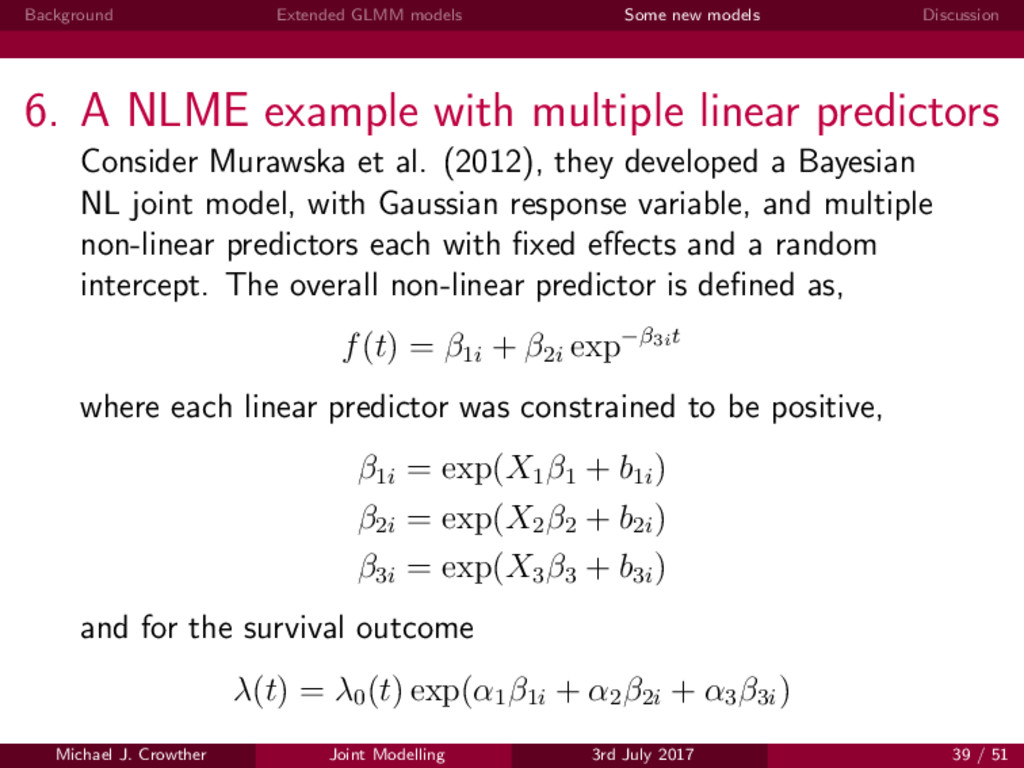
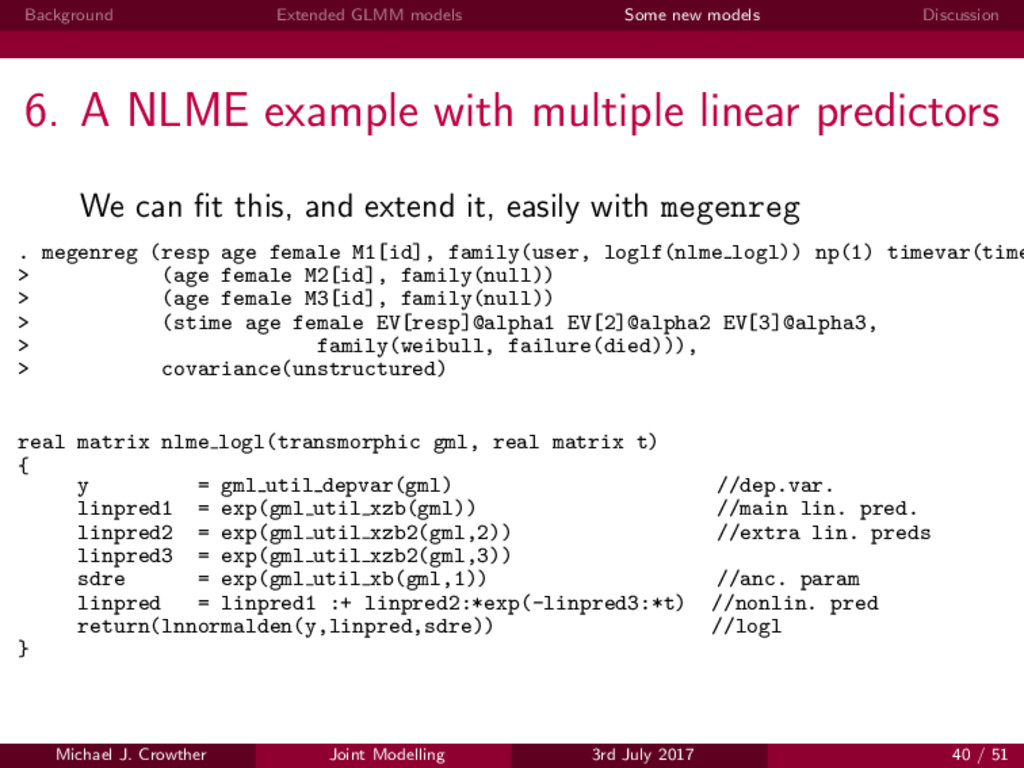
NLME example with multiple linear predictors Consider Murawska et al. (2012), they developed a Bayesian NL joint model, with Gaussian response variable, and multiple non-linear predictors each with fixed effects and a random intercept. The overall non-linear predictor is defined as, f(t) = β1i + β2i exp−β3it where each linear predictor was constrained to be positive, β1i = exp(X1 β1 + b1i ) β2i = exp(X2 β2 + b2i ) β3i = exp(X3 β3 + b3i ) and for the survival outcome λ(t) = λ0 (t) exp(α1 β1i + α2 β2i + α3 β3i ) Michael J. Crowther Joint Modelling 3rd July 2017 39 / 51
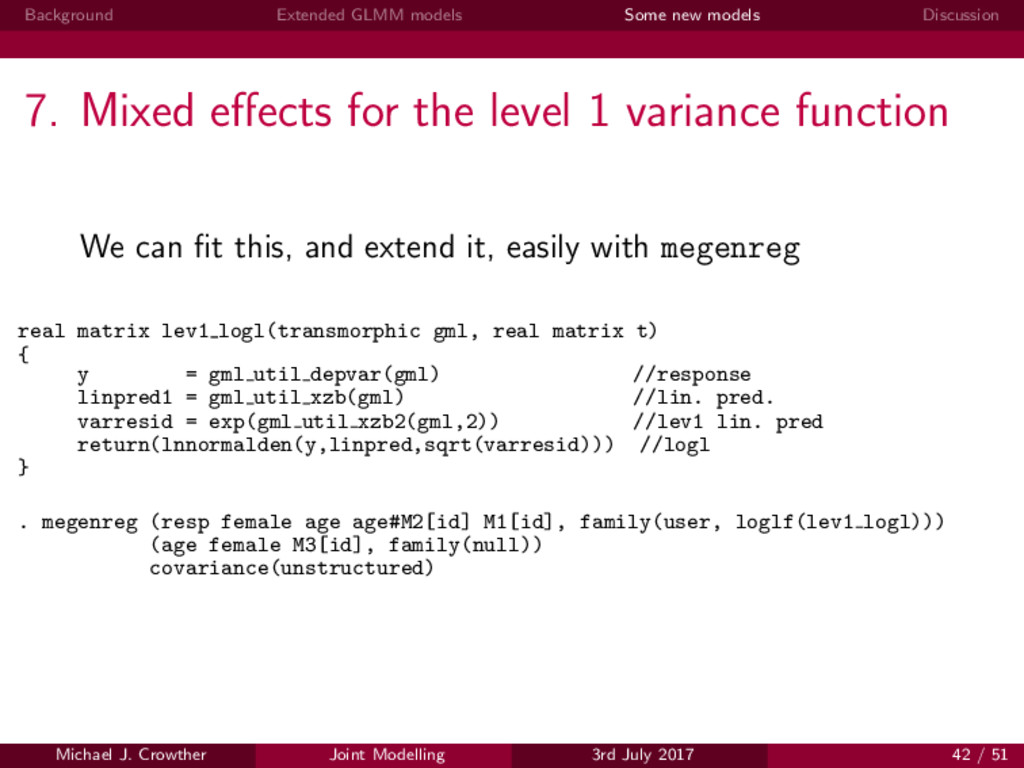
effects for the level 1 variance function A recent paper by Goldstein et al. (2017) [20] proposed a two-level model with complex level 1 variation, of the form, yij = X1ij β1 + Z1ij b1j + ij ij ∼ N(0, σ2 e ) log(σ2 e ) = X2ij β2 + Z2ij b2j b1j b2j ∼ N 0 0 , Σb1 Σb1b2 Σb2 Michael J. Crowther Joint Modelling 3rd July 2017 41 / 51
development I’ve written a few packages during and since my PhD, including: stjm - joint modelling stmixed - multilevel parametric survival survsim - simulation of survival data multistate - multi-state survival models Michael J. Crowther Joint Modelling 3rd July 2017 44 / 51
development I’ve written a few packages during and since my PhD, including: stjm - joint modelling stmixed - multilevel parametric survival survsim - simulation of survival data multistate - multi-state survival models It baffles me that often methods papers do not come with a useable implementation Michael J. Crowther Joint Modelling 3rd July 2017 44 / 51
development I’ve written a few packages during and since my PhD, including: stjm - joint modelling stmixed - multilevel parametric survival survsim - simulation of survival data multistate - multi-state survival models It baffles me that often methods papers do not come with a useable implementation Software development within an academic environment has its own unique aspects Use of functional programming should enable rapid development I am a big believer in the philosophy of to learn it, you have to code it! Michael J. Crowther Joint Modelling 3rd July 2017 44 / 51
development I find it very rewarding ‘On behalf of all of us in veterinary epidemiology (i.e. nearly ALWAYS dealing with clustered data) ... thank you very much’ Michael J. Crowther Joint Modelling 3rd July 2017 45 / 51
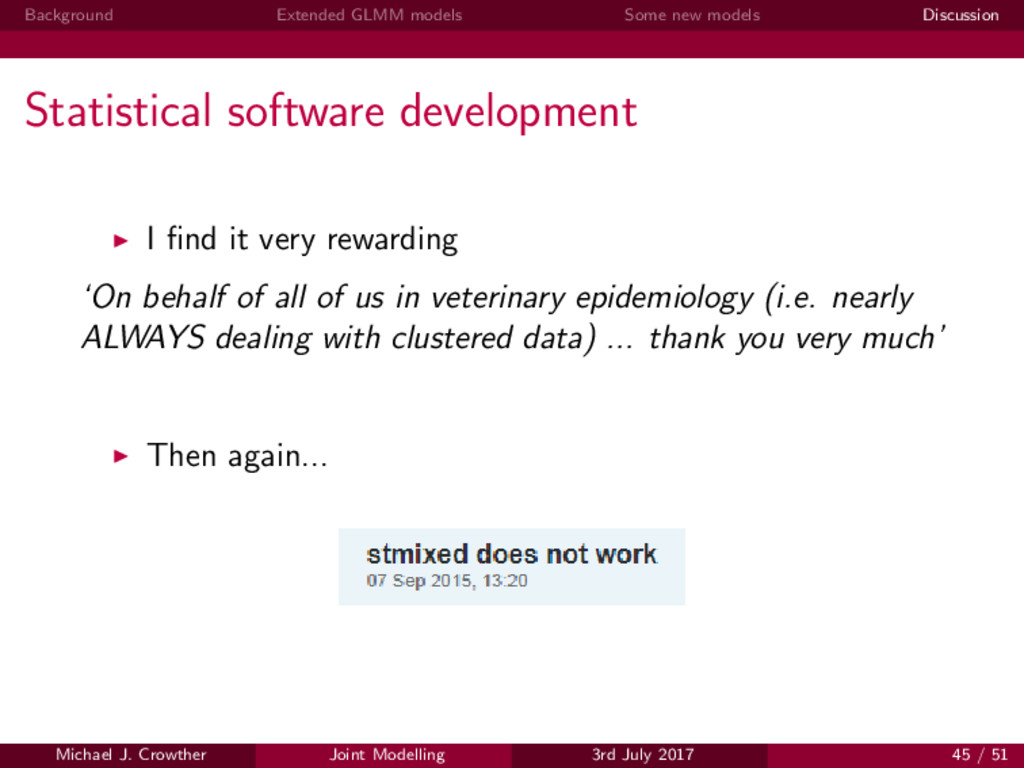
development I find it very rewarding ‘On behalf of all of us in veterinary epidemiology (i.e. nearly ALWAYS dealing with clustered data) ... thank you very much’ Then again... Michael J. Crowther Joint Modelling 3rd July 2017 45 / 51
wealth of patient data is becoming available in registry sources, as electronic healthcare record linkage moves to the forefront of life science strategy [21] Michael J. Crowther Joint Modelling 3rd July 2017 46 / 51
wealth of patient data is becoming available in registry sources, as electronic healthcare record linkage moves to the forefront of life science strategy [21] I’ve presented a very general, and hopefully usable, implementation which can fit a lot of different, and new, models, such as the Royston-Parmar models I showed Michael J. Crowther Joint Modelling 3rd July 2017 46 / 51
wealth of patient data is becoming available in registry sources, as electronic healthcare record linkage moves to the forefront of life science strategy [21] I’ve presented a very general, and hopefully usable, implementation which can fit a lot of different, and new, models, such as the Royston-Parmar models I showed Through the complex linear predictor, we allow seamless development of novel models, and crucially, a way of making them immediately available to researchers through an accessible implementation Michael J. Crowther Joint Modelling 3rd July 2017 46 / 51
wealth of patient data is becoming available in registry sources, as electronic healthcare record linkage moves to the forefront of life science strategy [21] I’ve presented a very general, and hopefully usable, implementation which can fit a lot of different, and new, models, such as the Royston-Parmar models I showed Through the complex linear predictor, we allow seamless development of novel models, and crucially, a way of making them immediately available to researchers through an accessible implementation I’ve incorporated level-specific random effect distributions, and integration techniques Michael J. Crowther Joint Modelling 3rd July 2017 46 / 51
risk prediction, predictions will be a key focus of the megenreg engine It’s so general, and hence it can be slow. E.g. 5 times slower than setting specific implementation (multivariate joint models) Michael J. Crowther Joint Modelling 3rd July 2017 47 / 51
risk prediction, predictions will be a key focus of the megenreg engine It’s so general, and hence it can be slow. E.g. 5 times slower than setting specific implementation (multivariate joint models) Currently I’m using finite differences for the score and Hessian; however, I am implementing analytic derivatives which will provide substantial speed gains. They themselves rely on numerical approximations Michael J. Crowther Joint Modelling 3rd July 2017 47 / 51
risk prediction, predictions will be a key focus of the megenreg engine It’s so general, and hence it can be slow. E.g. 5 times slower than setting specific implementation (multivariate joint models) Currently I’m using finite differences for the score and Hessian; however, I am implementing analytic derivatives which will provide substantial speed gains. They themselves rely on numerical approximations Software will be released in the coming months...I am also porting it to R Michael J. Crowther Joint Modelling 3rd July 2017 47 / 51
risk prediction, predictions will be a key focus of the megenreg engine It’s so general, and hence it can be slow. E.g. 5 times slower than setting specific implementation (multivariate joint models) Currently I’m using finite differences for the score and Hessian; however, I am implementing analytic derivatives which will provide substantial speed gains. They themselves rely on numerical approximations Software will be released in the coming months...I am also porting it to R Crowther MJ. Extended generalised multivariate multilevel data analysis. (To submit). Michael J. Crowther Joint Modelling 3rd July 2017 47 / 51
[1] Gould AL, Boye ME, Crowther MJ, Ibrahim JG, Quartey G, Micallef S, Bois FY. Joint modeling of survival and longitudinal non-survival data: current methods and issues. report of the dia bayesian joint modeling working group. Statistics in medicine 2015; 34(14):2181–2195. [2] Li N, Elashoff RM, Li G. Robust joint modeling of longitudinal measurements and competing risks failure time data. Biom J Feb 2009; 51(1):19–30, doi:10.1002/bimj.200810491. URL http://dx.doi.org/10.1002/bimj.200810491. [3] Rizopoulos D, Verbeke G, Lesaffre E, Vanrenterghem Y. A two-part joint model for the analysis of survival and longitudinal binary data with excess zeros. Biometrics 2008; 64(2):pp. 611–619. URL http://www.jstor.org/stable/25502097. [4] Lin H, McCulloch CE, Mayne ST. Maximum likelihood estimation in the joint analysis of time-to-event and multiple longitudinal variables. Stat Med Aug 2002; 21(16):2369–2382, doi:10.1002/sim.1179. URL http://dx.doi.org/10.1002/sim.1179. Michael J. Crowther Joint Modelling 3rd July 2017 48 / 51
[5] Crowther MJ, Andersson TML, Lambert PC, Abrams KR, Humphreys K. Joint modelling of longitudinal and survival data: incorporating delayed entry and an assessment of model misspecification. Statistics in medicine 2016; 35(7):1193–1209. [6] Kr´ ol A, Ferrer L, Pignon JP, Proust-Lima C, Ducreux M, Bouch´ e O, Michiels S, Rondeau V. Joint model for left-censored longitudinal data, recurrent events and terminal event: Predictive abilities of tumor burden for cancer evolution with application to the ffcd 2000–05 trial. Biometrics 2016; 72(3):907–916. [7] Barrett J, Su L. Dynamic predictions using flexible joint models of longitudinal and time-to-event data. Statistics in Medicine 2017; :n/a–n/adoi:10.1002/sim.7209. URL http://dx.doi.org/10.1002/sim.7209, sim.7209. [8] Kr´ ol A, Mauguen A, Mazroui Y, Laurent A, Michiels S, Rondeau V. Tutorial in joint modeling and prediction: a statistical software for correlated longitudinal outcomes, recurrent events and a terminal event. arXiv preprint arXiv:1701.03675 2017; . [9] Crowther MJ, Abrams KR, Lambert PC, et al.. Joint modeling of longitudinal and survival data. Stata J 2013; 13(1):165–184. Michael J. Crowther Joint Modelling 3rd July 2017 49 / 51
[10] Philipson P, Sousa I, Diggle P, Williamson P, Kolamunnage-Dona R, Henderson R. joineR - Joint Modelling of Repeated Measurements and Time-to-Event Data 2012. URL http://cran.r-project.org/web/packages/joineR/index.html. [11] Rizopoulos D. JM: An R Package for the Joint Modelling of Longitudinal and Time-to-Event Data. J Stat Softw 7 2010; 35(9):1–33. URL http://www.jstatsoft.org/v35/i09. [12] Rizopoulos D. Jmbayes: joint modeling of longitudinal and time-to-event data under a bayesian approach 2015. [13] Rabe-Hesketh S, Skrondal A, Pickles A. Reliable estimation of generalized linear mixed models using adaptive quadrature. Stata J 2002; 2:1–21. [14] Pinheiro JC, Bates DM. Approximations to the log-likelihood function in the nonlinear mixed-effects model. J Comput Graph Statist 1995; 4(1):pp. 12–35. [15] Crowther MJ, Abrams KR, Lambert PC. Flexible parametric joint modelling of longitudinal and survival data. Stat Med 2012; 31(30):4456–4471, doi:10.1002/sim.5644. URL http://dx.doi.org/10.1002/sim.5644. [16] Henderson R, Diggle P, Dobson A. Joint modelling of longitudinal measurements and event time data. Biostatistics 2000; 1(4):465–480. Michael J. Crowther Joint Modelling 3rd July 2017 50 / 51
[17] Dickman PW, Sloggett A, Hills M, Hakulinen T. Regression models for relative survival. Stat Med 2004; 23(1):51–64, doi:10.1002/sim.1597. URL http://dx.doi.org/10.1002/sim.1597. [18] Liu L, Wolfe RA, Huang X. Shared frailty models for recurrent events and a terminal event. Biometrics 2004; 60(3):747–756. [19] Mazroui Y, Mathoulin-Pelissier S, Soubeyran P, Rondeau V. General joint frailty model for recurrent event data with a dependent terminal event: application to follicular lymphoma data. Statistics in medicine 2012; 31(11-12):1162–1176. [20] Goldstein H, Leckie G, Charlton C, Tilling K, Browne WJ. Multilevel growth curve models that incorporate a random coefficient model for the level 1 variance function. Statistical methods in medical research Jan 2017; :962280217706 728doi:10.1177/0962280217706728. [21] Jutte DP, Roos LL, Brownell MD. Administrative record linkage as a tool for public health research. Annu Rev Public Health 2011; 32:91–108, doi:10.1146/annurev-publhealth-031210-100700. URL http://dx.doi.org/10.1146/annurev-publhealth-031210-100700. Michael J. Crowther Joint Modelling 3rd July 2017 51 / 51