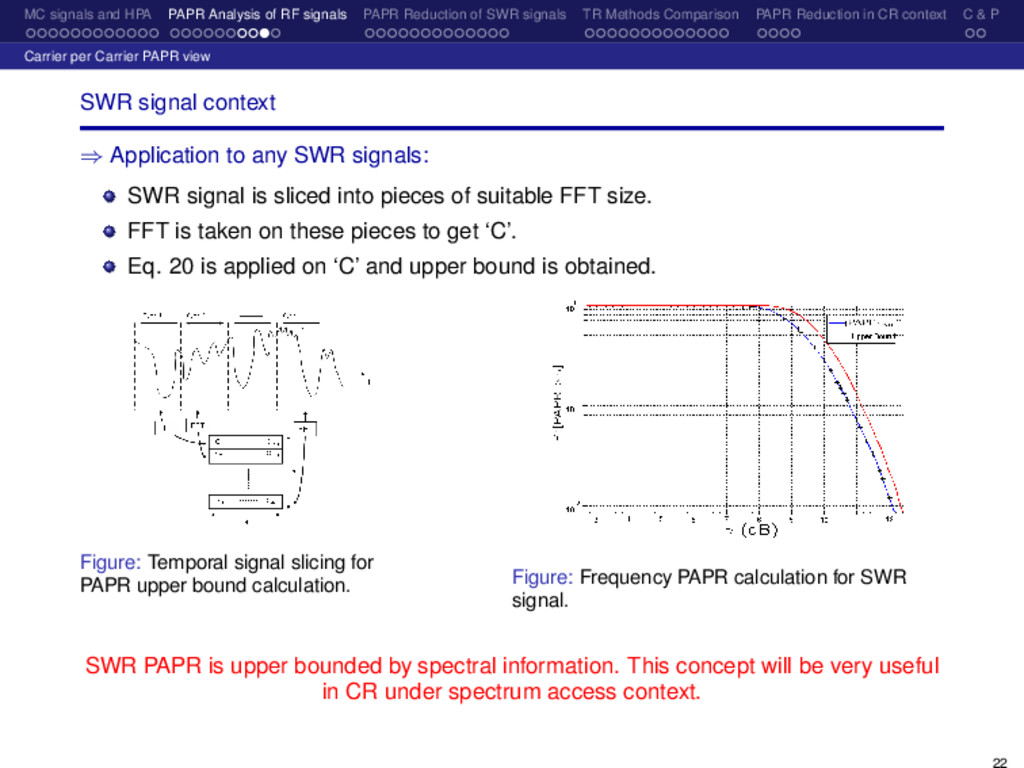
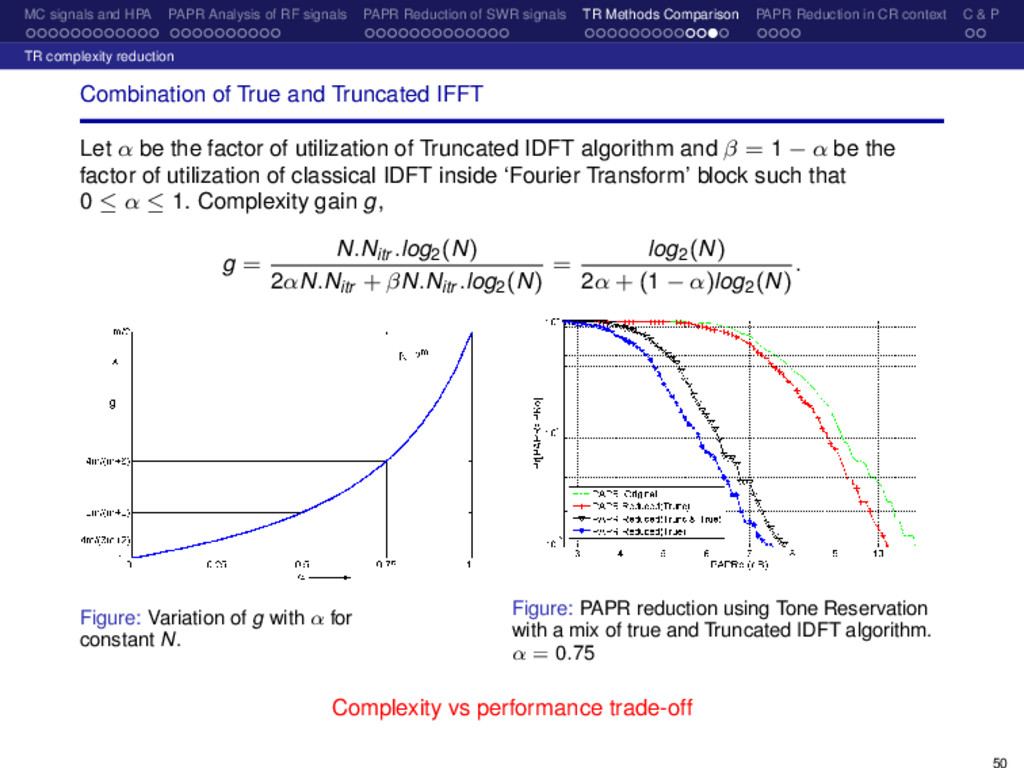
Reduction of SWR signals TR Methods Comparison PAPR Reduction in CR context C & P Personal Publications Journal Publications Sajjad Hussain, Jacques Palicot, Yves Louët, Sidkieta Zabre, “Frequency Domain Interpretation of Power Ratio Metric for Cognitive Radio Systems", Proceedings of IET Communications Journal, Volume 2, Issue 6, July 2008 Page(s):783 - 793. Sajjad Hussain, Yves Louët, Jacques Palicot, “Peak Power Control of Software Radio signals", International Journal of Digital Multimedia Broadcasting, under preparation. Book Chapters Jacques Palicot, Yves Louët, Sajjad Hussain, “Power Amplification issues related to Dynamic Spectrum Access in the Cognitive Radio Systems", in the book “Cognitive Radio Systems", ISBN 978-953-7619-25-1. Conference Publications Sajjad Hussain, Desire Guel, Yves Louët, Jacques Palicot, “Performance comparison of PRC based PAPR reduction schemes for WiLAN systems", IEEE European Wireless, Aalborg Denmark, May 09. Sajjad Hussain, Yves Louët, Jacques Palicot, “PAPR variations on dynamic spectrum access in Cognitive Radio systems", IEEE Wireless VITAE, Aalborg Denmark, May 09. 60