Upgrade to Pro — share decks privately, control downloads, hide ads and more …

Economic Evaluation of Wind Farm Projects

Sener Salci
September 17, 2017

Economic Evaluation of Wind Farm Projects

Sener Salci

September 17, 2017
Tweet

More Decks by Sener Salci

Other Decks in Education

Transcript

  1. Economic Evaluation of Grid-Connected Renewable Electricity Generation Investments in Developing

    Countries Sener SALCI – Department of Economics Queen’s University, Canada 1
  2. Outline • Introduction • Methodology • Data • Results •

    Conclusions Full Paper is available at:: https://ideas.repec.org/p/pra/mprapa/70578.html 2
  3. Electricity Generation and Consumption in Africa • More than half

    of the African countries (excluding North African countries) have an electrification coverage of less than 40 percent of population (IEA, World Energy Outlook, 2015). • Expectations are that the demand for electricity in the future will be growing substantially. • Their electricity generation systems are small and isolated, mainly consisting of open cycle and/or small diesel plants that are relatively fuel inefficient. • Most capacity was installed when fuel prices were much lower than they are today. Hence generation mix is fuel inefficient at todays prices for petroleum. 3
  4. Average Daily Load Curve 4 0 150 300 450 600

    750 900 1050 0 2 4 6 8 10 12 14 16 18 20 22 24 Hours of the Day 2001 Winter Day 2010 Winter Day 2001 Summer Day 2010 Summer Day
  5. Annual Load Duration Curve 5 200 400 600 800 1000

    1200 Demand (MW) 0 730 1460 2190 2920 3650 4380 5110 5840 6570 7300 8030 8760 Number of Hours/Year 2000 2010
  6. Electricity generation from most renewable sources (e.g. wind and solar)

    are:  intermittent: power from wind and solar is variable with time.  non - dispatchable: renewable power generator cannot be turned on and off with changing demand for energy/capacity Therefore, adding generation from a wind farm does not replace the “least efficient” plant, but alters the power plant mix of capacities in long-run. 6
  7. Economics of Renewables The economic value of a renewable energy

    source heavily depend on: •renewable power profiles (e.g. wind speeds, solar radiation levels) at different hours that determines its capacity factor in these hours and total installed capacity in the system (energy = capacity factor x installed capacity) •the correlation between renewable source and system load as well as forecast error •characteristics of the electricity generation such as fuel matrix and system flexibility •long-term impacts on optimal mix with renewable integration •expected change in demand for energy (changes in the shape of load curve over-time), future changes in fuel prices (relative changes between prices of fuel, gas, and coal) that are reflected in slopes of the thermal supply curves and ultimately affects the size of merit-order effect of renewable 7
  8. Long-Run Impacts of Wind Capacity Integration on System Scheduling and

    Planning 8 (A) without wind integration (B) with wind integration
  9. C D Impact of Wind Generation on Optimal Plant Mix

    8760 Capacity (MW) Hours A C A B 9 With Wind Without Wind B Diesel SCT CCT HB HA Hi is the minimum number of hours of planti
  10. C D Annual Load Duration Curve at Year ‘t’ (with

    and without wind project) 8760 Capacity (MW) Hours A C A B 10 With Wind Without Wind B Diesel C substitutes for B SCT B substitutes for A CCT HB HA Hi is the minimum number of hours of planti
  11. Introduction, cont. Cape-Verde Problems: absence of reliable and cost-efficient energy

    supply, financial deterioration in government budget. Objective: Supply of affordable, reliable, clean energy, and reduce fiscal burden coming from oil imports Proposed Solution (policy): as part of rehabilitation of the energy systems, utilization of local wind and solar potential (RES-E targets).13
  12. Evaluation of Electricity Generation with mix of grid-connected onshore wind

    and thermal capacity Main issues –in measuring net benefits. Fuel Savings 1. Given intensity of wind speed, what is the value of the fuel saved if system optimally dispatched? Impact on Optimal Plant mix 2. How does the energy generated by wind change the optimal mix of thermal generation over time? Impact on Reliability 3. What are the additional system cost required to maintain reliability of services? * In a system with a reserve deficit, wind or solar electricity generation do not eliminate the chronic blackouts and brownouts in a system 14 14
  13. Objective of Analysis Objective and contribution of this study is:

    • first to introduce mechanism to evaluate policy instruments to promote renewable electricity generation. • based on proposed mechanism, estimate and allocate the benefits and costs from such electricity generation investments based on PPA • to test how does each critical PPA parameter (risk variable) affects key players. • Policy Recommendation: how [we] can secure successful and sustainable IPP investments through PPAs – means of securing private investment with PPAs that are affordable for utilities. 15
  14. Model – Integrated Investment Appraisal Mechanism Application of an integrated

    investment appraisal for utility scale wind farm project* Financial Analysis Foreign IPP (InfraCo): Financial receipts in the form of sale of wind energy and carbon credits net of all investment to install wind turbines and annual fixed costs to maintain wind farm – all discounted at 10% to arrive its NPV. Electric Utility (ELECTRA): Financial benefits in the form of fuel savings net of reliability costs and financial payments in the form of wind energy payments paid to IPP – all discounted at 10% to arrive its NPV. 16
  15. Model – Integrated Investment Appraisal Mechanism Economic Analysis Economy of

    Cape-Verde: Country-economy benefits are generated from fuel savings and taxes net of economic costs in the form of reliability costs and wind energy payments paid to IPP – all transactions are adjusted with the “FEP” and corresponding conversion factor (e.g. oil) and discounted at 10% to arrive its NPV. Global Economy: Global-economy benefits from fuel savings and taxes generated net of economic costs in the form of reliability costs and wind farm investment costs (as part of global resource) – all transactions are discounted at 10% to arrive its NPV. Tax Externality Government Tax Externality: Taxes earned less taxes forgone due to wind farm project – all discounted at 10% to arrive its NPV. It is therefore reflecting the difference between resource flow of country minus cash flow of electric utility. 17
  16. Demand Data 19 0 5 10 15 20 25 30

    35 40 45 0 1000 2000 3000 4000 5000 6000 7000 8000 8760 Hours Annual Load Duration Curve (DEMAND) of Santiago Island as of 2010** ** We generated annual load duration curves from 2011 to 2030 based on Simonsen Associados (February 2008) demand study prepared for the electric utility (ELECTRA). Source: Simonsen Associados (February 2008)
  17. Supply Data 20 Source: Annual Report, 2012, Energy Regulatory Agency

    of Cape-Verde (www.are.cv) Generator Capacity and Fuel Characteristics (SUPPLY), Santiago Island as of 2012 (***) fuel efficiency of installed generation capacity falling by half per cent every year whilst fuel efficiency of new installations improving by half per cent every year and then falling by the same rate starting from year when plant is installed. DIESEL Generator Year Built Capacity (MW) Type of Fuel Fuel Consumption (litre/kWh)*** Palmarejo III 2011/2012 22 Heavy Fuel Oil 0.206 Palmarejo II 2008 14.88 Heavy Fuel Oil 0.213 Palmarejo I 2002 11.16 Heavy Fuel Oil 0.220 Prai II 1992 5.064 Gasoil 0.207 Prai I 1987 2.36 Gasoil 0.206 Assomada 2006 3.9 Gasoil 0.230 Tarrafal 1995-2000 1.4 Gasoil 0.244 S.Cruz n.d 2.2 Gasoil 0.236 Total 62.9
  18. Cabeólica wind farm project data and other relevant data 22

    Sources: Salci and Jenkins (2015) Inputs/Parameters Value 1. Wind Capacity (MW) 9.35 MW 2. Capital Cost per (million €) 17.75 million € 3. Fixed Annual O&M Expenses (% of EPC Costs) 1% 4. Total Investment Costs 2.3 million € per MW 5. Construction of Wind Farm (Years) 2 years 6. Operating Life (years) 20 years 7. Wind Capacity Factor 40% 8. Fuel Consumption for Grid Reliability (equivalent to per MWh wind energy supplied) 0.25% 8. PPA Wind Energy Price 120 €/MWH 9. Annual Wind Energy Price Escalation 0% 10.Carbon Credits from Emission Reductions 0.9049 tCO2 per MWh 11. Tax on Carbon Credits 7.5% 12. Taxes on Operations 10% 13. World Prices of HFO 180 (HFO 380), $ per barrel 80 (60) 14. Cape-Verde Prices of HFO for Electricity Generation (includes additives such as taxes and transportation costs) 150% x item #13 15. Conversion Factor of HFO 0.94 16. Foreign Exchange Premium 10% 17. Real Discount Rate, % 10% 18. Real Exchange Rate, €/$ 0.78
  19. Fuel Savings and Carbon Credits from Wind Generation 23 Fuel

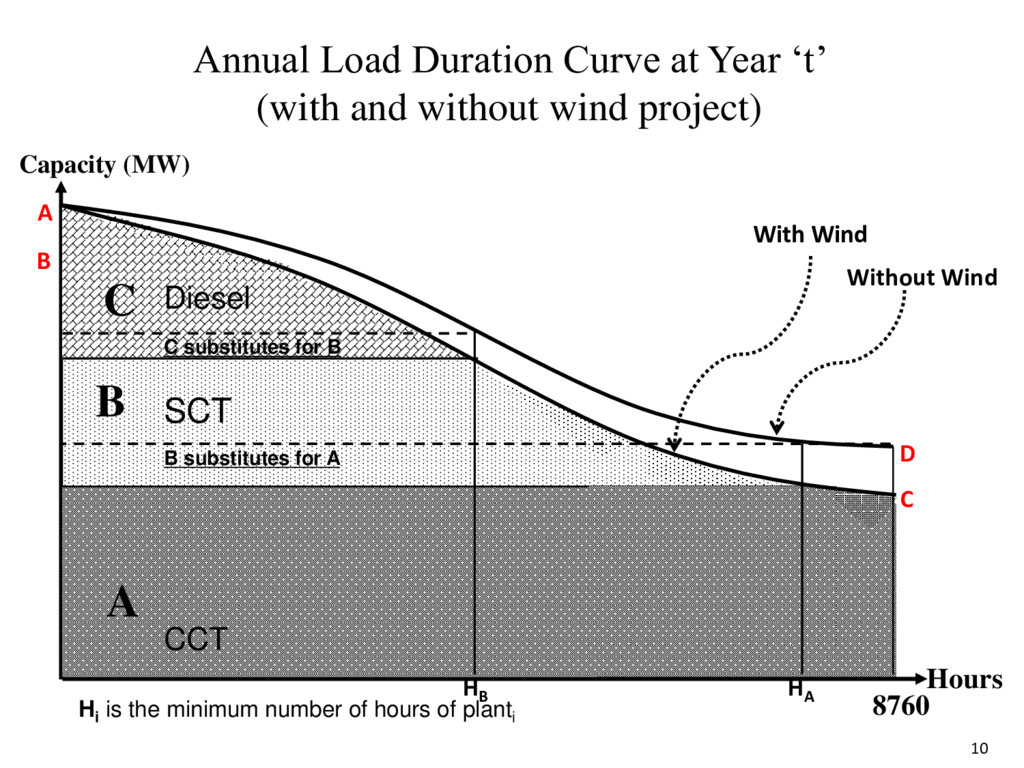
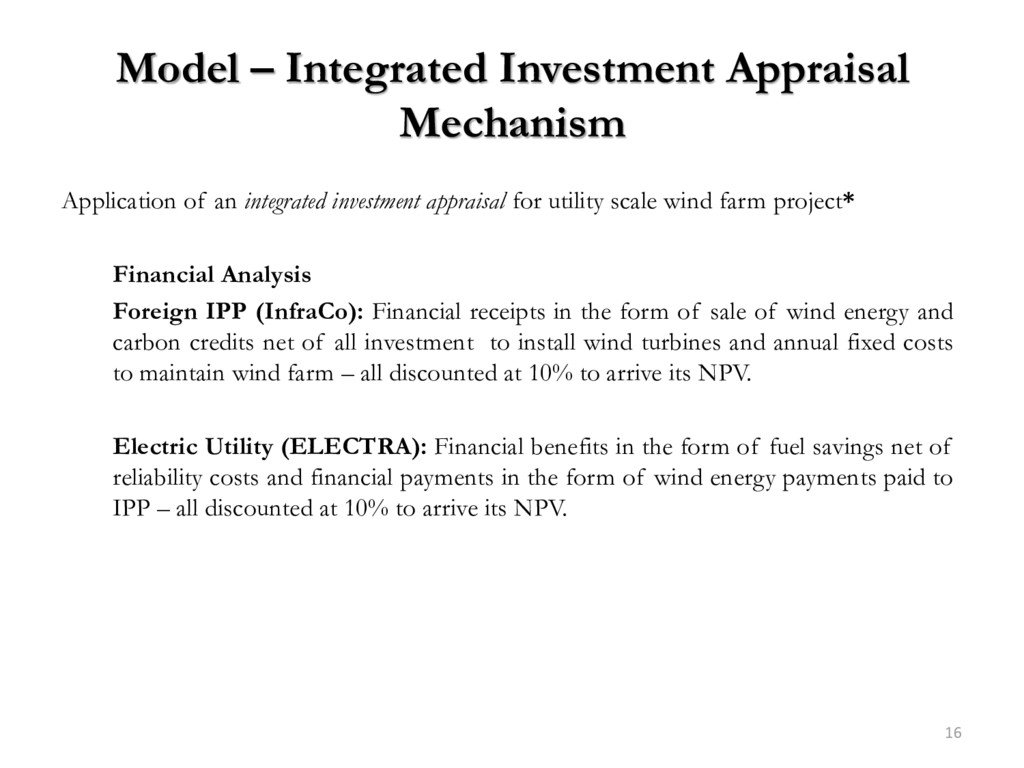
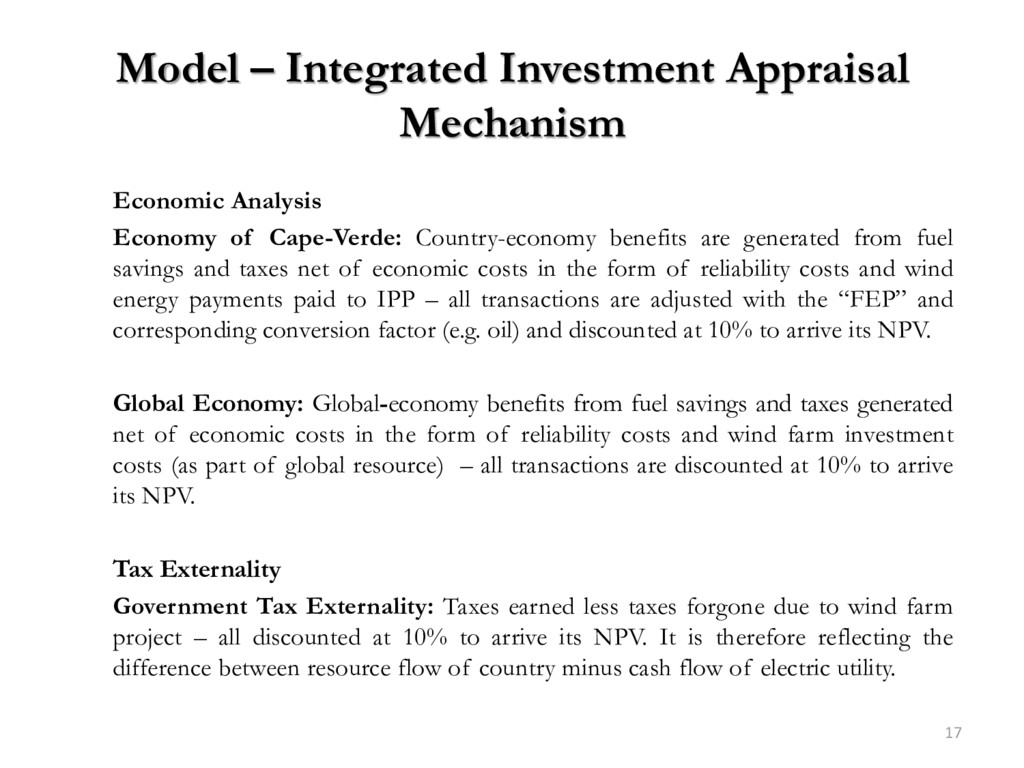
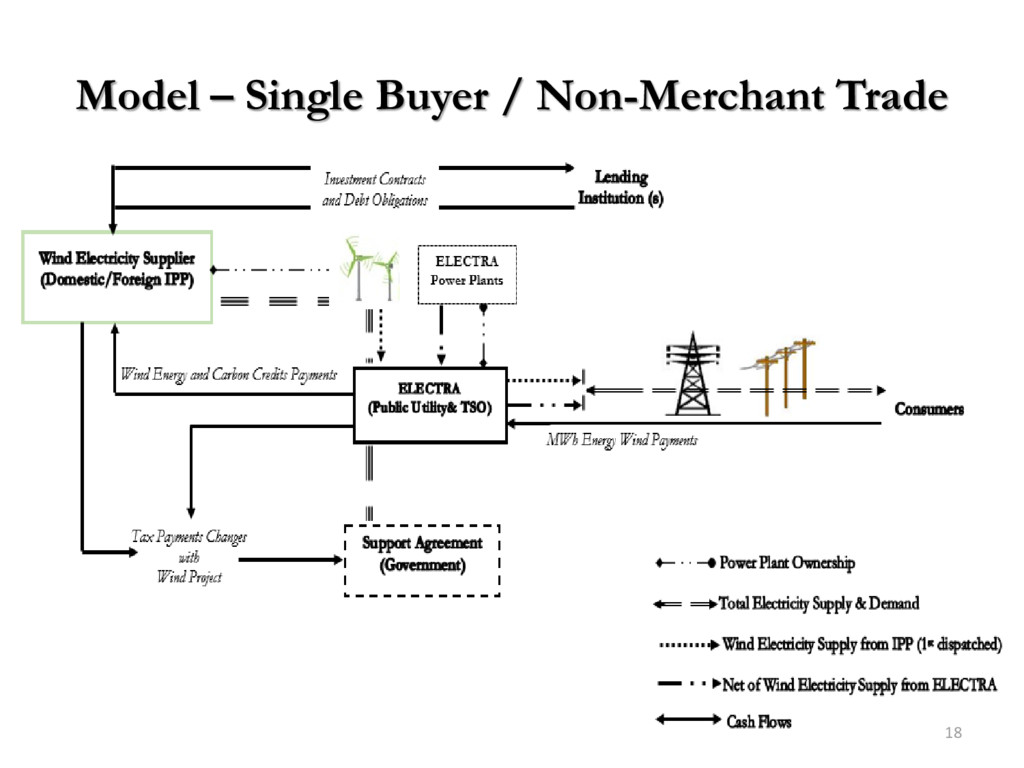
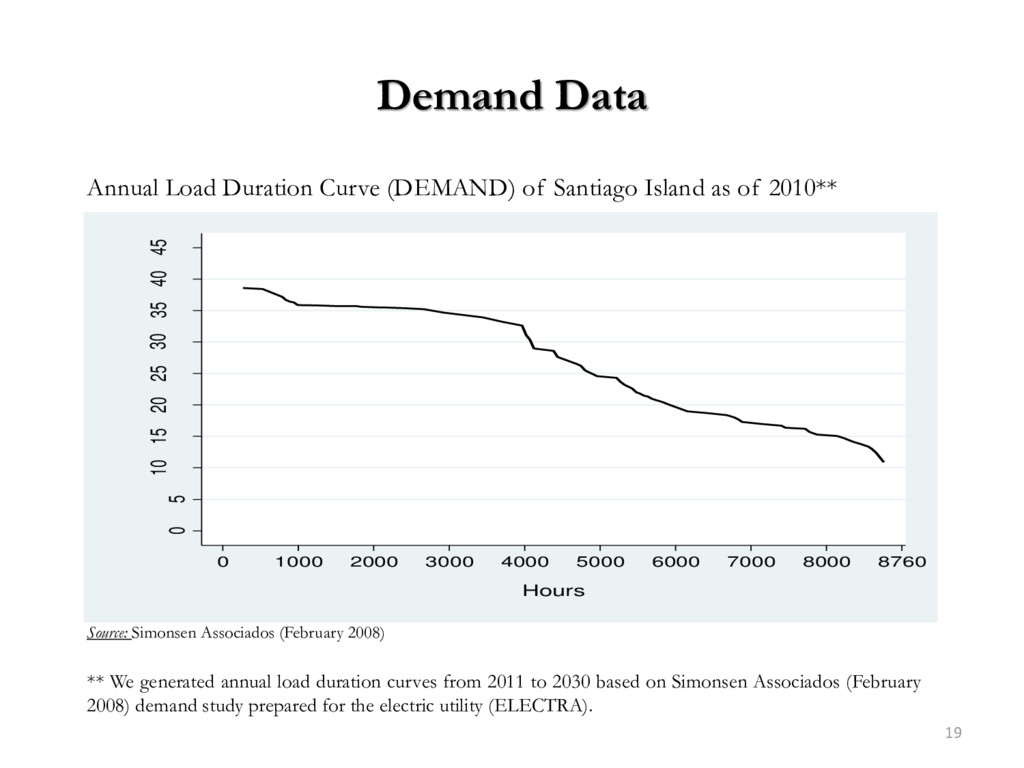
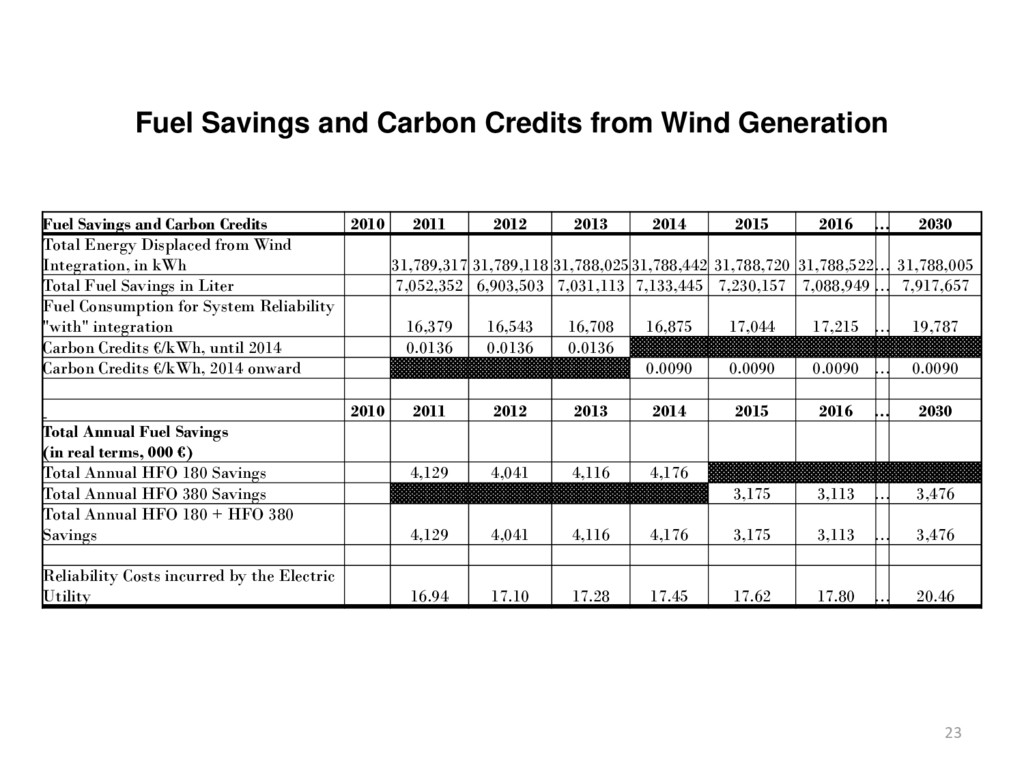
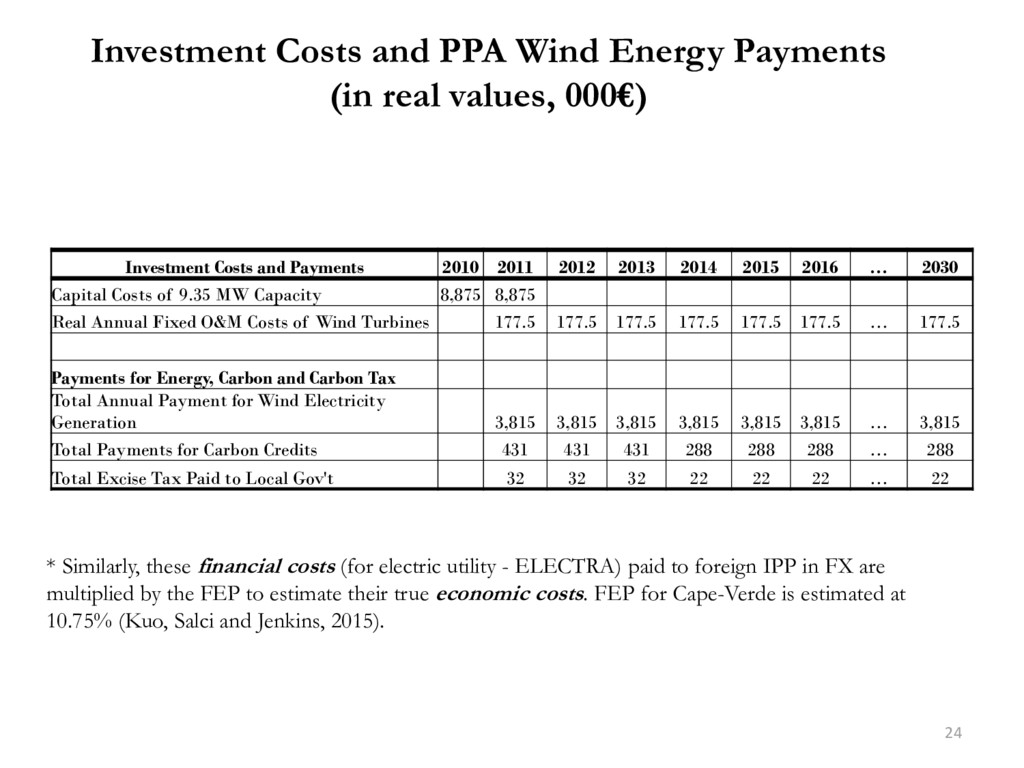
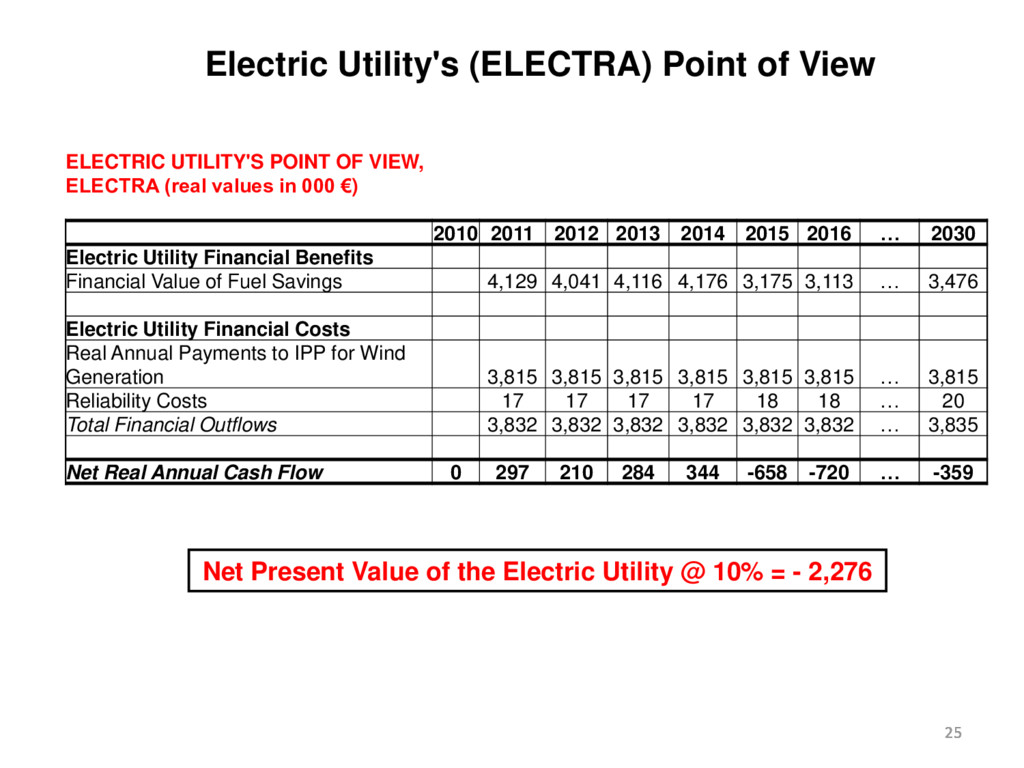
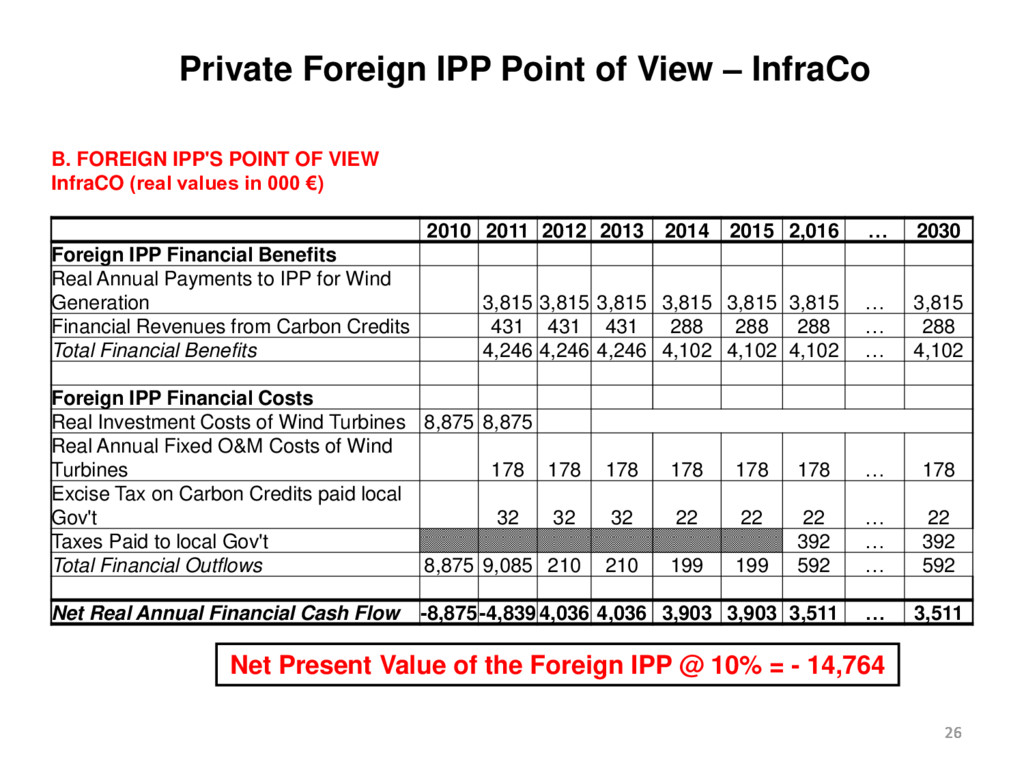
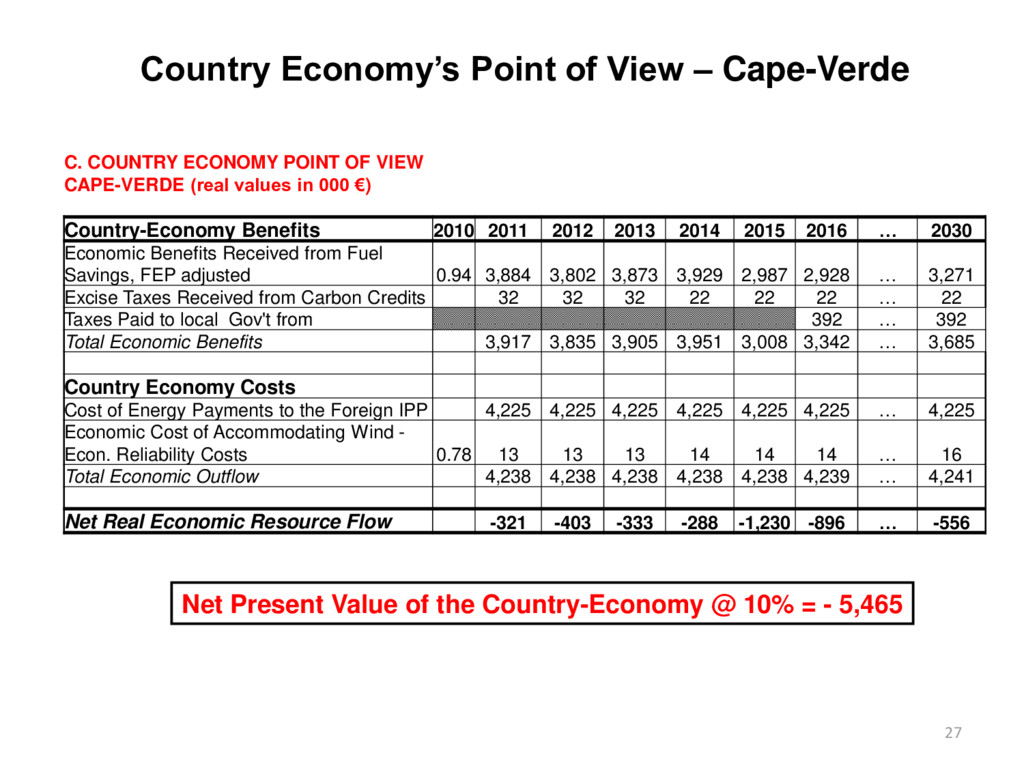
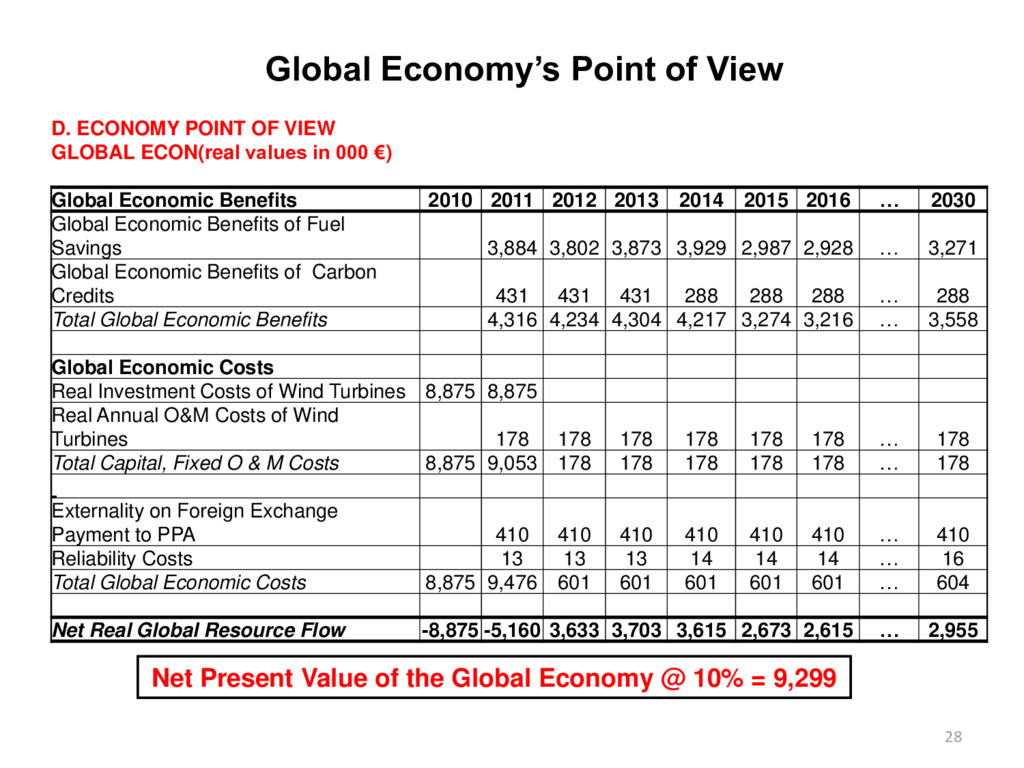
    Savings and Carbon Credits 2010 2011 2012 2013 2014 2015 2016 … 2030 Total Energy Displaced from Wind Integration, in kWh 31,789,317 31,789,118 31,788,02531,788,442 31,788,720 31,788,522… 31,788,005 Total Fuel Savings in Liter 7,052,352 6,903,503 7,031,113 7,133,445 7,230,157 7,088,949 … 7,917,657 Fuel Consumption for System Reliability "with" integration 16,379 16,543 16,708 16,875 17,044 17,215 … 19,787 Carbon Credits €/kWh, until 2014 0.0136 0.0136 0.0136 Carbon Credits €/kWh, 2014 onward 0.0090 0.0090 0.0090 … 0.0090 2010 2011 2012 2013 2014 2015 2016 … 2030 Total Annual Fuel Savings (in real terms, 000 €) Total Annual HFO 180 Savings 4,129 4,041 4,116 4,176 Total Annual HFO 380 Savings 3,175 3,113 … 3,476 Total Annual HFO 180 + HFO 380 Savings 4,129 4,041 4,116 4,176 3,175 3,113 … 3,476 Reliability Costs incurred by the Electric Utility 16.94 17.10 17.28 17.45 17.62 17.80 … 20.46
  20. Investment Costs and PPA Wind Energy Payments (in real values,

    000€) * Similarly, these financial costs (for electric utility - ELECTRA) paid to foreign IPP in FX are multiplied by the FEP to estimate their true economic costs. FEP for Cape-Verde is estimated at 10.75% (Kuo, Salci and Jenkins, 2015). 24 Investment Costs and Payments 2010 2011 2012 2013 2014 2015 2016 … 2030 Capital Costs of 9.35 MW Capacity 8,875 8,875 Real Annual Fixed O&M Costs of Wind Turbines 177.5 177.5 177.5 177.5 177.5 177.5 … 177.5 Payments for Energy, Carbon and Carbon Tax Total Annual Payment for Wind Electricity Generation 3,815 3,815 3,815 3,815 3,815 3,815 … 3,815 Total Payments for Carbon Credits 431 431 431 288 288 288 … 288 Total Excise Tax Paid to Local Gov't 32 32 32 22 22 22 … 22
  21. Electric Utility's (ELECTRA) Point of View 25 25 Net Present

    Value of the Electric Utility @ 10% = - 2,276 ELECTRIC UTILITY'S POINT OF VIEW, ELECTRA (real values in 000 €) 2010 2011 2012 2013 2014 2015 2016 … 2030 Electric Utility Financial Benefits Financial Value of Fuel Savings 4,129 4,041 4,116 4,176 3,175 3,113 … 3,476 Electric Utility Financial Costs Real Annual Payments to IPP for Wind Generation 3,815 3,815 3,815 3,815 3,815 3,815 … 3,815 Reliability Costs 17 17 17 17 18 18 … 20 Total Financial Outflows 3,832 3,832 3,832 3,832 3,832 3,832 … 3,835 Net Real Annual Cash Flow 0 297 210 284 344 -658 -720 … -359
  22. Private Foreign IPP Point of View – InfraCo 26 26

    Net Present Value of the Foreign IPP @ 10% = - 14,764 B. FOREIGN IPP'S POINT OF VIEW InfraCO (real values in 000 €) 2010 2011 2012 2013 2014 2015 2,016 … 2030 Foreign IPP Financial Benefits Real Annual Payments to IPP for Wind Generation 3,815 3,815 3,815 3,815 3,815 3,815 … 3,815 Financial Revenues from Carbon Credits 431 431 431 288 288 288 … 288 Total Financial Benefits 4,246 4,246 4,246 4,102 4,102 4,102 … 4,102 Foreign IPP Financial Costs Real Investment Costs of Wind Turbines 8,875 8,875 Real Annual Fixed O&M Costs of Wind Turbines 178 178 178 178 178 178 … 178 Excise Tax on Carbon Credits paid local Gov't 32 32 32 22 22 22 … 22 Taxes Paid to local Gov't 392 … 392 Total Financial Outflows 8,875 9,085 210 210 199 199 592 … 592 Net Real Annual Financial Cash Flow -8,875-4,839 4,036 4,036 3,903 3,903 3,511 … 3,511
  23. Country Economy’s Point of View – Cape-Verde 27 Net Present

    Value of the Country-Economy @ 10% = - 5,465 C. COUNTRY ECONOMY POINT OF VIEW CAPE-VERDE (real values in 000 €) Country-Economy Benefits 2010 2011 2012 2013 2014 2015 2016 … 2030 Economic Benefits Received from Fuel Savings, FEP adjusted 0.94 3,884 3,802 3,873 3,929 2,987 2,928 … 3,271 Excise Taxes Received from Carbon Credits 32 32 32 22 22 22 … 22 Taxes Paid to local Gov't from 392 … 392 Total Economic Benefits 3,917 3,835 3,905 3,951 3,008 3,342 … 3,685 Country Economy Costs Cost of Energy Payments to the Foreign IPP 4,225 4,225 4,225 4,225 4,225 4,225 … 4,225 Economic Cost of Accommodating Wind - Econ. Reliability Costs 0.78 13 13 13 14 14 14 … 16 Total Economic Outflow 4,238 4,238 4,238 4,238 4,238 4,239 … 4,241 Net Real Economic Resource Flow -321 -403 -333 -288 -1,230 -896 … -556
  24. Global Economy’s Point of View 28 Net Present Value of

    the Global Economy @ 10% = 9,299 D. ECONOMY POINT OF VIEW GLOBAL ECON(real values in 000 €) Global Economic Benefits 2010 2011 2012 2013 2014 2015 2016 … 2030 Global Economic Benefits of Fuel Savings 3,884 3,802 3,873 3,929 2,987 2,928 … 3,271 Global Economic Benefits of Carbon Credits 431 431 431 288 288 288 … 288 Total Global Economic Benefits 4,316 4,234 4,304 4,217 3,274 3,216 … 3,558 Global Economic Costs Real Investment Costs of Wind Turbines 8,875 8,875 Real Annual O&M Costs of Wind Turbines 178 178 178 178 178 178 … 178 Total Capital, Fixed O & M Costs 8,875 9,053 178 178 178 178 178 … 178 Externality on Foreign Exchange Payment to PPA 410 410 410 410 410 410 … 410 Reliability Costs 13 13 13 14 14 14 … 16 Total Global Economic Costs 8,875 9,476 601 601 601 601 601 … 604 Net Real Global Resource Flow -8,875 -5,160 3,633 3,703 3,615 2,673 2,615 … 2,955
  25. At the stated costs and prices, using the following relationship:

    29 Net Present Value, 000€, @ 10% Cape-Verde - Economy -5,465 Utility - Financial -2,276 Government Fiscal Impacts* -3,189 NPVCOUNTRY eco.dr = NPVUTILITY eco.dr + PVGOVERNMENT FISCAL eco.dr (*) the gov’t fiscal impacts are equal to the sum of the loss in tax revenues from reduced oil imports (−), the gain in the value of the FEP on fuel savings (+) and the loss in FEP due to the payments now made to the IPP (−), and the gain in excise taxes levied on the carbon credits received by the private operators of the project (+). Results
  26. At the stated costs and prices, then using the equation:

    30 NPVGLOBAL ECONOMY eco.dr = NPVIPP eco.dr + NPVCOUNTRY eco.dr Results Net Present Value, 000€, @ 10% Economy-Global 9,299 Financial – Foreign IPP 14,764 Economy – Country (Cape-Verde) -5,465
  27. Sensitivity Analysis Impacts of PPA wind energy tariff (NPV values

    in million €)* 31 31 Perspective / PPA tariff (€/MWh) Foreign IPP Electric Utility Government Budget Cape Verde Economy Global Economy 60 0.00 13,356 −2,376 10,980 10,980 80 4,539 8,550 −2,626 5,924 10,463 100 9,858 2,919 −2,919 0.00 9,858 110 12,615 0.00 −3,071 −3,071 9,544 120 14,764 −2,276 −3,189 −5,465 9,299 (*) NPVs are evaluated at 10% real discount rate, heavy fuel oil price at $60/barrel and wind capacity factor at 40%.
  28. Sensitivity Analysis Impacts of World Price of HFO (NPV values

    in millions €) 32 Perspective / Fuel Price ($/barrel) * Foreign IPP Electric Utility Government Budget Cape Verde Economy Global Economy 60 (90) 14,764 −2,276 −3,189 −5,465 9,299 68 (102) 14,764 0.00 −3,324 −3,324 11,441 70 (105) 14,764 610 −3,360 −2,750 12,015 80 (120) 14,764 3,533 −3,533 0.00 14,764 90 (135) 14,764 6,382 −3,701 2,681 17,445 (*) In column 1 the first price is the world price per barrel of HFO380 and the values in parenthesis are approximate prices for the fuel delivered to generation sites in Cape Verde. NPVs are evaluated using a 10% discount rate, the PPA energy tariff is held at 120 €/MWh and wind capacity factor is assigned to be 40%.
  29. Impacts of Wind Capacity Factor, NPV values in millions €)

    Sensitivity Analysis 33 Perspective / Wind Capacity Factor Foreign IPP Electric Utility Government Budget Cape Verde Economy Global Economy 30% 6,481 −1,707 −2,413 −4,120 2,361 35% 10,622 −1,991 −2,801 −4,792 5,830 40% 14,764 −2,276 −3,189 −5,465 9,299 45% 18,906 −2,560 −3,577 −6,138 12,769 50% 23,048 −2,845 −3,966 −6,810 16,238 (*) NPVs are evaluated at a 10% discount rate, a PPA Tariff of 120 €/MWh and a heavy fuel price of $60/barrel.
  30. Conclusions • Renewable energy technology should be chosen based on

    cost-efficiency concerns rather than considering only the availability of renewable resources. • In this example with the costs as stated, wind turbine electricity generation is both financially (utility’ point of view only) economically viable only at relatively high cost of fuel price for electricity generation caused by high caused by high crude oil prices, high transportation charges. • Based on long-term energy policy of the national gov’t regarding fuel oil switching (from HFO180 to HFO 380), we can also conclude that the risk of wind turbine generation for the utility and economy depends on one’s view of future oil price as well as expected (or planned) long-term fuel oil matrix. 34 34
  31. Conclusions, cont. • negotiations of the PPA price – equivalent

    to ask one: is it risky to sign 20 year fuel purchase contract? Yes, at the present time 20 year fixed price contracts for oil are too risky to exist!. • problem of wind capacity factor and price of heavy fuel oil so possibility of integrating operating efficiencies (if any) into power purchase contracts (e.g. high capacity factor at low fuel prices) • In the future, wind can be a cheap option for electricity generation for Cape-Verde at high wind capacity factor based upon reduction in capital costs for wind installations so reflected in wind energy prices. 35 35