Upgrade to Pro — share decks privately, control downloads, hide ads and more …

Energy, Environment, and Project Evaluation

Sener Salci
September 17, 2017

Energy, Environment, and Project Evaluation

Sener Salci

September 17, 2017
Tweet

More Decks by Sener Salci

Other Decks in Education

Transcript

  1. Outline Broadly Speaking •  Introduc5on •  Electricity (kWh) – Challenges (economics

    and environment) – Solu5ons •  not only kWh (biomass, wood) – Challenges (economics and environment) – Solu5ons 2
  2. Energy and Poverty Three hallmarks of poverty in developing countries

    relates to energy access are: •  lack of electricity access and insufficient capacity •  very high connec5on fees •  lack of power supply reliability •  heavy reliance on tradi5onal biomass use Note: addi5onal country-specific causes or triggers for power shortages vary across countries and are not listed in here. IntroducOon 3
  3. IntroducOon [Prudent] Energy Policy •  Supply of energy (not only

    electricity) should be: –  Reliable –  Affordable –  Environmentally sound energy 4
  4. Electricity (1): It is clear that there is also huge

    difference between urban poor electrifica6on and urban rich households’ electrifica6on . Source: IEA, World Energy Outlook, 2013 Region PopulaOon without electricity millions ElectrificaOon rate % Urban electrificaOon rate % (1) Rural electrificaOon rate % Developing countries 1,257 76.5 90.6 65.1 Africa 600 43 65 28 North Africa 1 99 100 99 Sub-Saharan Africa 599 32 55 18 Developing Asia 615 83 95 75 India 306 75 94 67 Rest of developing Asia 309 87 95 80 La5n America 24 95 99 81 Middle East 19 91 99 76 Transi5on economies & OECD 1 99.9 100.0 99.7 World 1,258 81.9 93.7 69.0 6
  5. Electricity, cont. These are shares to total popula5on, but same

    projec5ons from IEA also show that both number of people living without electricity and without access to clean cooking facili6es will increase in absolute values during the same period. Source: IEA, World Energy Outlook, 2013 7
  6. Challenges in Electricity Sector 1. Low access and insufficient capacity

    –  access to new connec5ons is slower than popula5on growth. –  under-investment in infrastructure; as of February 2013 total capacity installed in Africa is 147 GW and it is equivalent to capacity installed in Belgium (AfDB Blogs, 18 February, 2013). 2. Poor power supply reliability –  firms must operate their own diesel generator as they face with frequent power outages, even outages on a daily basis (aver5ng expenditure). •  Diesel generators are not only costly, but also dirty. –  poor power supply reliability costs firms ranging 6% with back-up capacity to 20% with limited back-up capacity (WB, 2013) –  It costs to economies in Africa ranging from 1% to 5% of GDP annually in Senegal, Kenya and Tanzania (Foster and Briceno-Garmendia, 2010). 9
  7. What is the cost-effecOve way to supply reliable and less-polluOng

    electricity to cover the current power deficit and possibly meet the future power needs in Africa? 13
  8. SoluOons for ElectrificaOon A. Economically Viable: the choice of technology

    determines the cost of generaOng electricity so the price of electricity paid by end-users + the reliability of the system as a whole. –  capital costs ($ per kW) and fuel costs ($ per tonne etc.)and system fuel efficiency (fuel requirement per kWh) –  system reliability and availability B. Environmentally Sound Energy: the choice of technology determines the amount of environmental externaliOes (i.e. various emissions) produced from electricity supply. –  type of fuel and emission intensi5es of these fuels –  amount of fuel required to generate addi5onal kWh of energy by each plant (i.e. system fuel efficiency) –  load factor of plants operate in the system 14
  9. A. Economically Viable Energy Source and GeneraOon System Type Fuel

    Cost / Availability (excluding transporta5on and other charges) Capital Costs System Efficiency (for MC esOmates) System Reliability and Availability Coal- Fired Steam Cycle Oil Fired Steam Cycle Natural Gas Fired Steam Cycle Intermediate / Best Highest / Fair High / Fair Very High High High High High High High Very High Very High Oil Fired Combus5on Engine Natural Gas Fired Comb. Engine Highest / Fair High / Fair Lowest Lowest Low Low Lowest Lowest Oil Fired Combined Cycle Natural Gas Fired Comb. Cycle Highest / Fair High / Fair Intermediate Intermediate Very High Very High Medium Medium Geothermal Steam Low / limited by area Intermediate Lowest High Nuclear Hydroelectric Wind Solar Low / Good Lowest / Limited by area free/ Limited by area free / limited by area Highest Intermediate to Highest Very high Higher tan wind Intermediate Seasonal variatons Only integra5on costs High Highest if water is available Intermihent and available only when wind (sun) blows (rises) 15 Sources: Shaalan, H.E. (2003) except, wind and solar; Joskow (2010)
  10. B. Ecologically Viable Energy Source (Fuel Type) Major Environmental Impact

    by Fuel Type (A) Actual Impact from power generaOon (B) Total Environmental Impact from Electricity GeneraOon Coal Vary across power plants – depending on how much fuel is used to generate one kWh of electricity from par5cular plant (fuel efficiency) Oil Natural Gas Nuclear radioac5ve waste disposal Size of plant Hydro Clean but generally requires contruc5on of dams Size of hydro dams Wind and Solar Renewables (abstrac5ng from noise pollu5on, bird mortali5es, and visual impacts) Emissions from back-up capacity unit and reserves per MW of renewable capacity installed in the system (e.g. if diesel plants are used, then high emissions are expected) 16
  11. Method of Assessment •  Benefits of using integrated approach – 

    Environmental assessment is not a separate evalua5on, but part of project analysis that allows us to see the delicate trade-off between choices •  How much does it cost to reduce emissions per tonne? –  First best environmentally sound energy genera5on op5on might provide the third or fourth best economically viable op5on for electricity genera5on. –  First best economically viable op5on for electricity genera5on might be the second-best or the third-best op5on for environment quality, however. (1) Need to compare economic viability from implemen5ng choosing power project over another using system wide cost and reliability measures. (2) Need to iden5fy and compare the expected environment and ecological changes from implemen5ng power project using environmental degrada5on measures (IAEA, 1999, p.68) - impacts on human health - impacts on biological resources such as on forests, ground water, crops, etc. Compare results; benefits and costs from (1) and (2) simultaneously. 17
  12. Method of Assessment •  PotenOal cost-savings from economically viable (affordable

    and reliable) technology can be o  transferred to consumers in terms of lower price of electricity who already pay higher than average in developing world. o  used for future capacity investments to increase na5on-wide electrifica5on o  Increase the speed of electrifica5on •  Given the facts presented such that majority of African countries sOll suffer from: o  Low electrifica5on and insufficient capacity Ø  Also low emissions from electricity sector o  Poor reliability in supply Ø  Increase in emissions from back-up diesel generators owned by businesses o  High electricity genera5on costs - so prices Ø  Produc5on costs > electricity prices = subsidy •  Therefore, these subsidies paid for exis5ng connected consumers over and above produc5on costs today can be used elsewhere, for example for rural electrifica5on programmes, health programs etc. 18
  13. Region PopulaOon relying on TRADITIONAL use of biomass millions Percentage

    of populaOon relying on TRADITIONAL use of biomass % (2) Developing countries 2,642 49.4 Africa 696 67 Sub-Saharan Africa 695 79 Nigeria 122 75 South Africa 6 13 North Africa 1 1 Developing Asia 1,869 51 India 818 66 Pakistan 112 63 Indonesia 103 42 China 446 33 La5n America 68 15 Brazil 12 6 Middle East 9 4 World 2,642 38.1 (2)Although not indicated in this table, tradi6onal biomass is widely used for both cooking as well as for space hea6ng in Africa. Based on latest survey, the percentage is 93% in rural sub-Saharan Africa, and it is 58% in urban popula6on in Sub-Saharan Africa (IEA, 2006) Source: IEA, World Energy Outlook, 2013 21 Biomass - Facts
  14. EsOmaOon of Emissions •  In the context of “tradi5onal biomass

    energy” used for cooking and hea5ng: amount of indoor pollu5on is generated is a func5on of: –  pollutant emission intensity of tradi5onal fuel used - emissions/kg –  amount of tradi5onal fuel used per day or per year (kg) These emissions have direct health hazards on humans. The amount and effects of these indoor emissions vary across users of tradi5onal biomass, for example impacts depends on size of rooms households own, size of households, etc. •  In the context of “tradi5onal biomass energy” used for cooking and hea5ng: impact on environmental damage (outside the homes) such as global warming impact, food security, climate of the country (i.e. reduc5on in rainfalls) is a func5on of: –  speed of deforesta5on from such ac5vi5es (land-use change) 22
  15. Biomass Use in Africa •  Greater the reliance on “biomass

    energy resources” in Africa than anywhere else in the world. Biomass energy forms supply bulk of Africa’s total energy supply except in North African countries and in South Africa. It will remain to play a vital role in mee5ng local energy demand in many regions and reliance on biomass is unlikely to change: (IEA, 1998; 2002; 2006; UNDP, 2003) •  Although there was a decrease from the share of biomass, number of people relying on biomass for cooking and hea5ng in Africa will increase by 27% from 2000 to 2030 - that is increase from 583 millions to 823 millions (IEA, 2002;2003). WHY? •  Easily available for poor, and it is affordable for cooking and space hea5ng and can be even “free” if collected by poor (Reddy et al., 1997) 23
  16. Biomass Use in Africa, cont. •  Tradi>onal biomass energy use

    refers to conversion of wood, charcoal, leaves, agricultural residues…for cooking, hea5ng and charcoal produc5on. •  The bulk of tradi5onal biomass energy use in sub-Saharan Africa is because it comes at: Ø low cost Ø does not require processing before its use 24
  17. Problems with TradiOonal Biomass 1.  Majority of rural households obtain

    firewood for free in rural areas. Firewood is regularly used for cooking and heaOng in rural areas. 2.  Majority of urban households use charcoal for cooking and heaOng. Charcoal produced from natural forests and woodland areas are inefficient in Africa: by inefficiency we mean loss in energy when wood fuel is converted into charcoal. Because wood is regarded as free good almost in all parts of Africa, it is an obstacle for efficient charcoal producOon based on “grown wood”.* 3. TradiOonal stove use is another problem in Africa. A tradiOonal stove requires more consumpOon of charcoal or firewood than improved stoves. * In early 2000s, Gov’t of Kenya added responsibili5es to Kenya Forest Service to own, manage and protect all state forests, prevent logging ac5vi5es, enforcing the condi5ons of charcoal produc5on. In addi5on, during same years, Kenya has already started and introduced ‘The Kenya Charcoal Regula6ons Pocketbook’. It contains compliance requirement and responsibili5es of charcoal produc5on, transporta5on, selling and use. 25
  18. • So, inefficient charcoal produc5on and the use of tradi5onal stoves

    directly result in increase the amount of charcoal and firewood used at homes. o  increase the household expenses on charcoals and firewood (those who pay). o  increase in indoor emissions generated from each kg of charcoal and firewood burned. o  more charcoal and firewood demand means greater their contribu5on to land degrada5on and greater their contribu5on to the speed of deforesta5on and eventually global warming. 26 Problems with TradiOonal Biomass, cont.
  19. Heath and Environmental Impacts of TradiOonal Biomass •  Indoor Emissions

    –  Heath Impacts •  Land Degrada5on and Deforesta5on –  Global Warming –  Reduc5on in Rainfalls 27
  20. Pollutant Typical concentraOons* Typical standards set to protect health Number

    of Omes in excess of guidelines Carbon monoxide (ppm?) 129 8.6 15 3300 100 33 800 2 400 150 3 50 700 100 7 •  From burning 1 kg of wood in a traditional stove in a 40 m3 kitchen with 15 air changes per hour. 28 Indoor Emissions from TradiOonal Biomass Use
  21. TradiOonal Biomass and DeforestaOon fuel wood and forestry products ⇒ land

    degrada5on and rapid deforesta5on •  problem in rural areas as well as peri-urban areas. e.g. increase in charcoal demand result in degrada5on of the surrounding woodlands and forests located nearby Nairobi in Kenya and Dar-es-salaam in Tanzania (Scully, 2002) e.g. biomass resources have been devastated in a 200 to 300 km radius around Luanda in Angola due to charcoal produc5on (IEA, 2006) 30
  22. What is the path toward “beper”? •  “Use of biomass

    is not in itself cause for concern. However, when resources are harvested unsustainably and energy conversion technologies are inefficient, there are serious adverse consequences for health, the environment and economic development” (IEA, 2006, p. 419) •  Shiu from tradi5onal biomass use to improved use and eventually to modern biomass energy use is necessary to alleviate health, environmental damage of tradi5onal biomass use and promote economic development (OECD/ IEA, 2006), including Africa (Karekezi, et al. 2002, OECD/ IEA, 2006). 33
  23. Other potenOal benefits of improved stoves programs Although it is

    difficult to capture all posi5ve impacts (benefits) of having improved stoves, some of the following long-run benefits are not negligible including: 1.  Indirect income effect via Ome savings on fuel collecOon and cooking (woman and children) -  the average amount of 5me spent collec5ng fuel wood range between one half and two hours /day. It can take longer 5me in areas where resource is scarce (OECD/IEA, 2006). For example, distance travelled to collect fuelwood in rural Lindi, Tanzania is lowest at 1.6 km but can reach 10.4 km in rural Singida, Tanzania. Also, the average fuelwood load in Sub-Saharan Africa is between 20 kg to 38 kg (OECD/IEA, 2006). Therefore, improved biomass can reduce the burden of fuel collec5on: -  increase engagement of woman in produc5on ac5vi5es that might further increase households income (further reduc5on in poverty) -  increase performance ra5o and school ahendance days gains 35
  24. Other potenOal benefits of improved stoves programs, cont. 2. Value

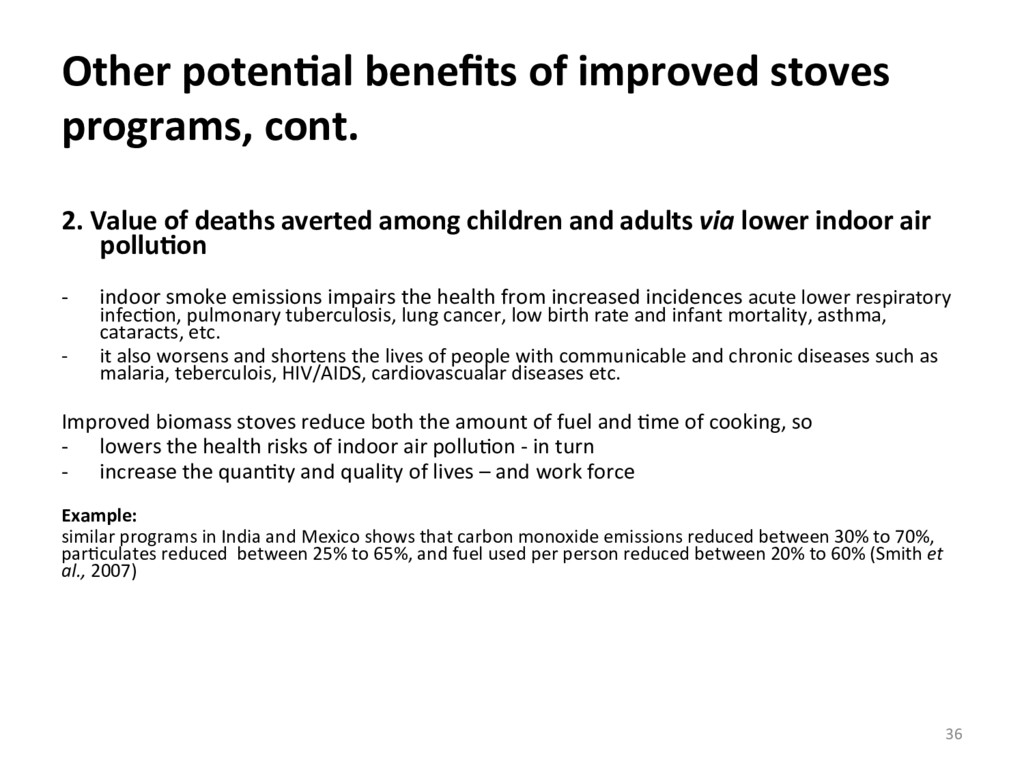
    of deaths averted among children and adults via lower indoor air polluOon -  indoor smoke emissions impairs the health from increased incidences acute lower respiratory infec5on, pulmonary tuberculosis, lung cancer, low birth rate and infant mortality, asthma, cataracts, etc. -  it also worsens and shortens the lives of people with communicable and chronic diseases such as malaria, teberculois, HIV/AIDS, cardiovascualar diseases etc. Improved biomass stoves reduce both the amount of fuel and 5me of cooking, so -  lowers the health risks of indoor air pollu5on - in turn -  increase the quan5ty and quality of lives – and work force Example: similar programs in India and Mexico shows that carbon monoxide emissions reduced between 30% to 70%, par5culates reduced between 25% to 65%, and fuel used per person reduced between 20% to 60% (Smith et al., 2007) 36
  25. Other potenOal benefits of improved stoves programs, cont. 3. Reducing

    the speed of land deforestaOon -  reduc5on in charcoal consump5on will decrease the number of trees cut every year -  farmers might also benefit from reduc5on in deforesta5on as rainfalls are nega5vely affected from deforesta5on – food security in the long-run -  e.g. similar program in Uganda preserved 222,103 tonnes of fuelwood and saved 2,196 ha of forest cover in Uganda and economic benefits are es5mated as 781,801 p.a. up from 2006. The es5mates are based on value of forest reserves = afforesta5on costs per kg firewood. 4. Employment to urban poor populaOon -  reduc5on in poverty in urban areas -  About 10,000 improved cook stoves (jikos) per year are made and sold in West Kenya alone - the Upesi stove for households in Kenya. 5. Benefits to Government -  savings on health expenditures and long-run tax benefits for the government from increased employment 37
  26. Benefits come from actual “use” •  What are the ways

    to persuade these households to use these improved stoves? –  For example, significant rural households in Mexico, India and Guatemala refused to use improved cook stoves and con5nued in the use of tradi5onal stoves (The Household Energy and Health project, 2006, Indoor Pollu5on Group, School of Public Heath, University of Berkeley). PrescripOon: Increase awareness about savings, educa5ng people about health of risks of indoor air pollu5on, educa5ng people on how to shorten cooking 5me and smoke emissions by using a pot lid and drying wood thoroughly before use, house design such as window openings, etc. 38
  27. Economics of IntervenOon Evalua5on of Gov’t interven5on to help poor

    rural and urban households to gain access to “improved use of energy”: Investments today •  How much will it cost to implement improved stoves programme? Benefits over-6me •  How much will this programme contribute (benefits) to rural and urban poor families local government, environment and global warming – IF families use them? Habermehl, H. (2007), “Economic Evalua5on of the Improved Household Cooking Stove Dissemina5on Programme in Uganda”, German Agency for Technical Coopera5on (GTZ), Household Programme – HERA –  Dissemina5on of the Rocket Lorena stove in the districts of Bushenyi and Rakai in years 2005 and 2006 –  Dissemina5on of the improved charcoal stove in Kampala in years 2005 and 2006 39