Combining Logs, Metrics, and Traces for Unified Observability @ Infoshare 2020
Learn how Elasticsearch efficiently combines data in a single store and how Kibana is used to analyze it. Plus, see how recent developments help identify, troubleshoot, and resolve operational issues faster.
jobs • You can no longer "point" to where that job lives Shift to cloud-native yields maintainable code, with costs • Traditional licensing models don't scale as well as your applications • Hurdles with autoscaling Monitoring Complexity Hardware & software trends are evolving in tandem Evolving Architectures ~↑ Monitoring Complexity
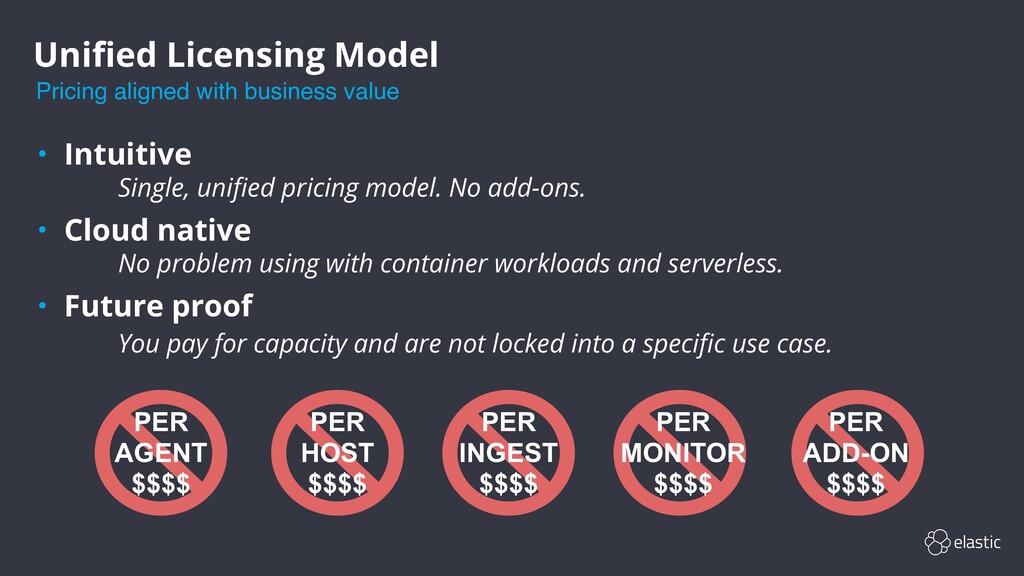
$$$$ PER HOST $$$$ PER INGEST $$$$ PER MONITOR $$$$ PER ADD-ON $$$$ • Intuitive Single, unified pricing model. No add-ons. • Cloud native No problem using with container workloads and serverless. • Future proof You pay for capacity and are not locked into a specific use case.
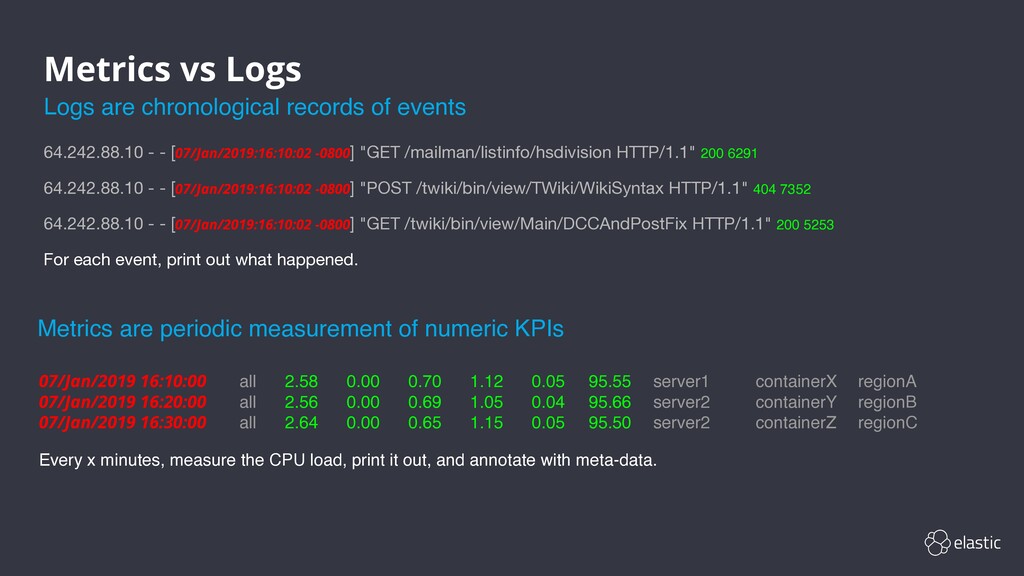
6291 64.242.88.10 - - [07/Jan/2019:16:10:02 -0800] "POST /twiki/bin/view/TWiki/WikiSyntax HTTP/1.1" 404 7352 64.242.88.10 - - [07/Jan/2019:16:10:02 -0800] "GET /twiki/bin/view/Main/DCCAndPostFix HTTP/1.1" 200 5253 For each event, print out what happened. Logs are chronological records of events
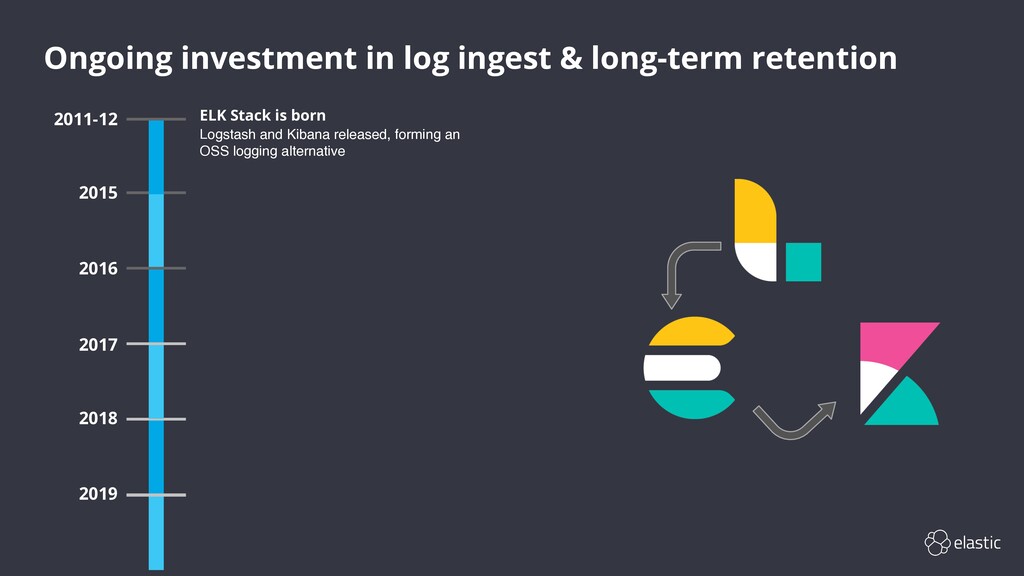
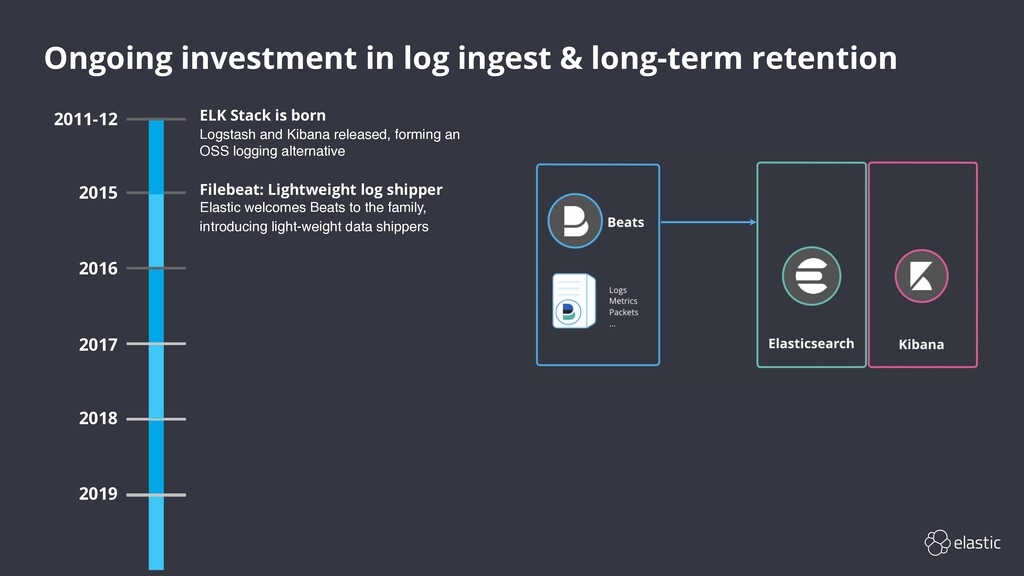
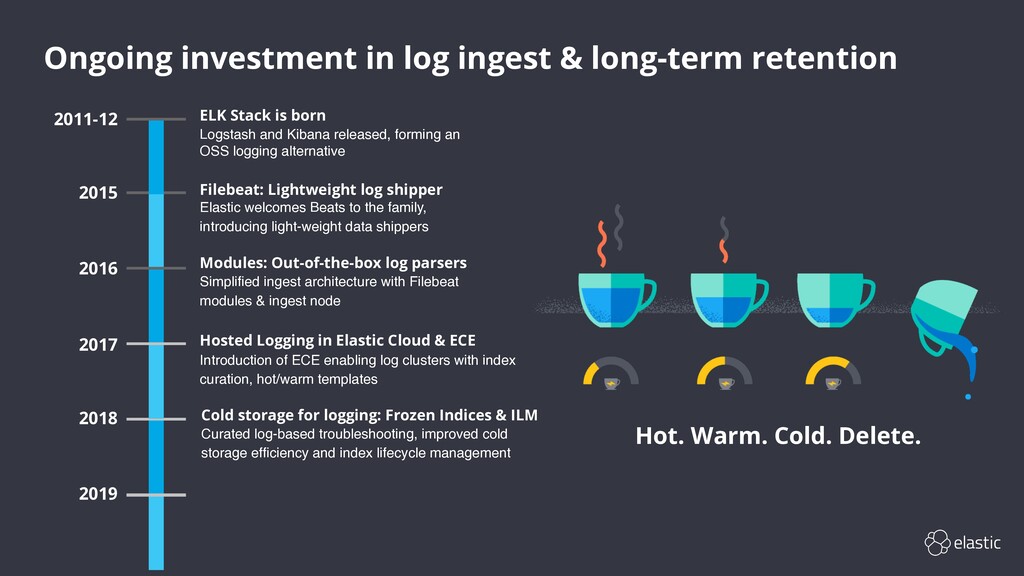
2018 Elastic welcomes Beats to the family, introducing light-weight data shippers 2017 2019 ELK Stack is born Logstash and Kibana released, forming an OSS logging alternative 2011-12 Filebeat: Lightweight log shipper
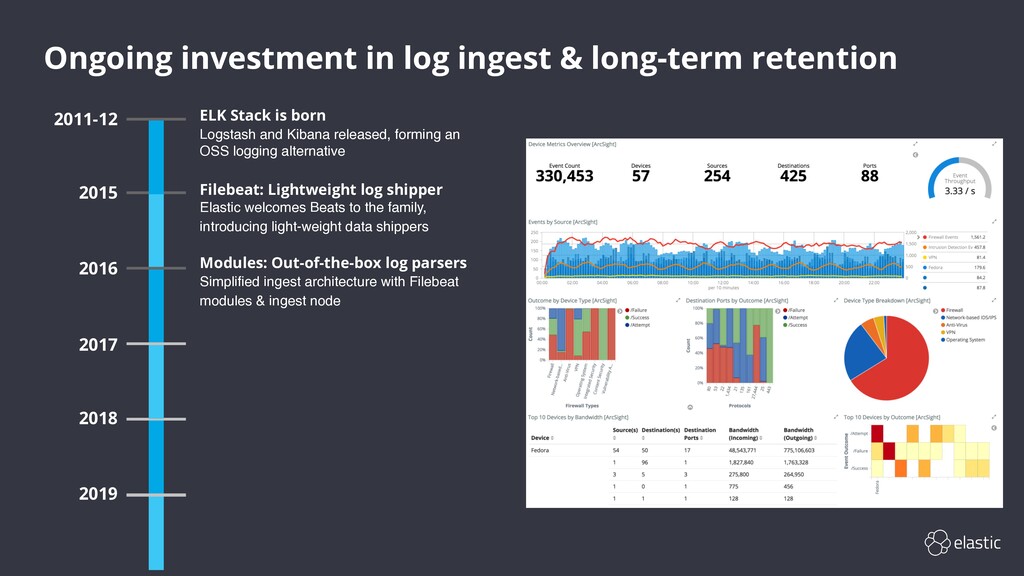
2018 Filebeat: Lightweight log shipper Elastic welcomes Beats to the family, introducing light-weight data shippers 2017 2019 Simplified ingest architecture with Filebeat modules & ingest node ELK Stack is born Logstash and Kibana released, forming an OSS logging alternative 2011-12 Modules: Out-of-the-box log parsers
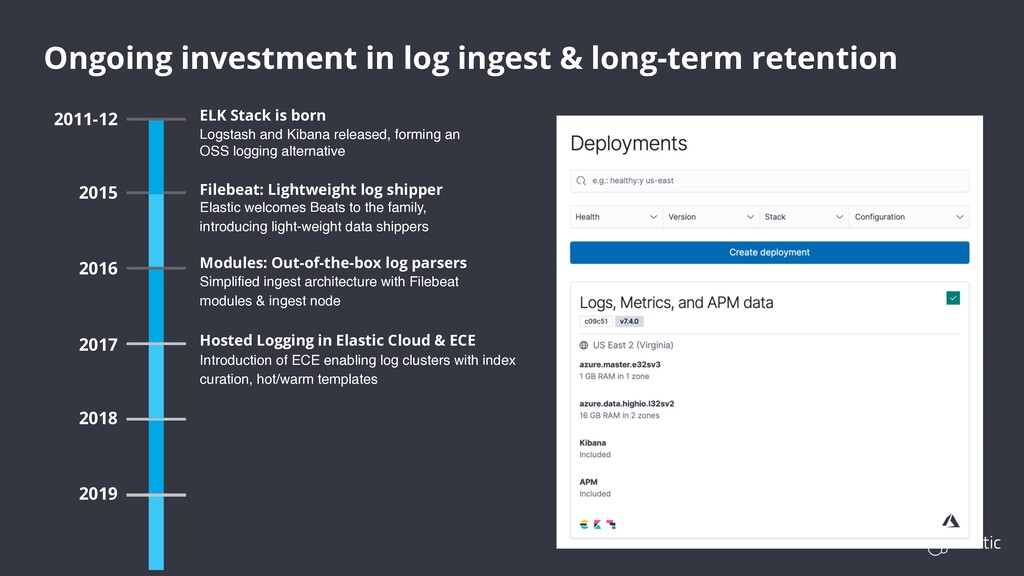
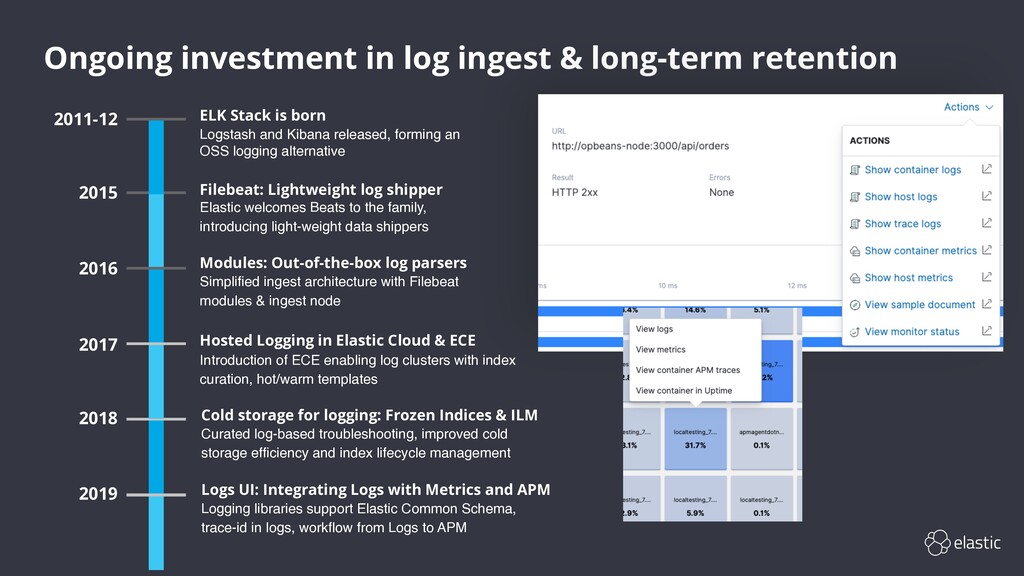
Hosted Logging in Elastic Cloud & ECE Introduction of ECE enabling log clusters with index curation, hot/warm templates 2018 2017 Cold storage for logging: Frozen Indices & ILM Curated log-based troubleshooting, improved cold storage efficiency and index lifecycle management 2019 Modules: Out-of-the-box log parsers Simplified ingest architecture with Filebeat modules & ingest node Hot. Warm. Cold. Delete. ELK Stack is born Logstash and Kibana released, forming an OSS logging alternative 2011-12 Elastic welcomes Beats to the family, introducing light-weight data shippers Filebeat: Lightweight log shipper
Hosted Logging in Elastic Cloud & ECE Introduction of ECE enabling log clusters with index curation, hot/warm templates 2018 2017 Cold storage for logging: Frozen Indices & ILM Curated log-based troubleshooting, improved cold storage efficiency and index lifecycle management 2019 Modules: Out-of-the-box log parsers Simplified ingest architecture with Filebeat modules & ingest node ELK Stack is born Logstash and Kibana released, forming an OSS logging alternative 2011-12 Logs UI: Integrating Logs with Metrics and APM Logging libraries support Elastic Common Schema, trace-id in logs, workflow from Logs to APM Elastic welcomes Beats to the family, introducing light-weight data shippers Filebeat: Lightweight log shipper
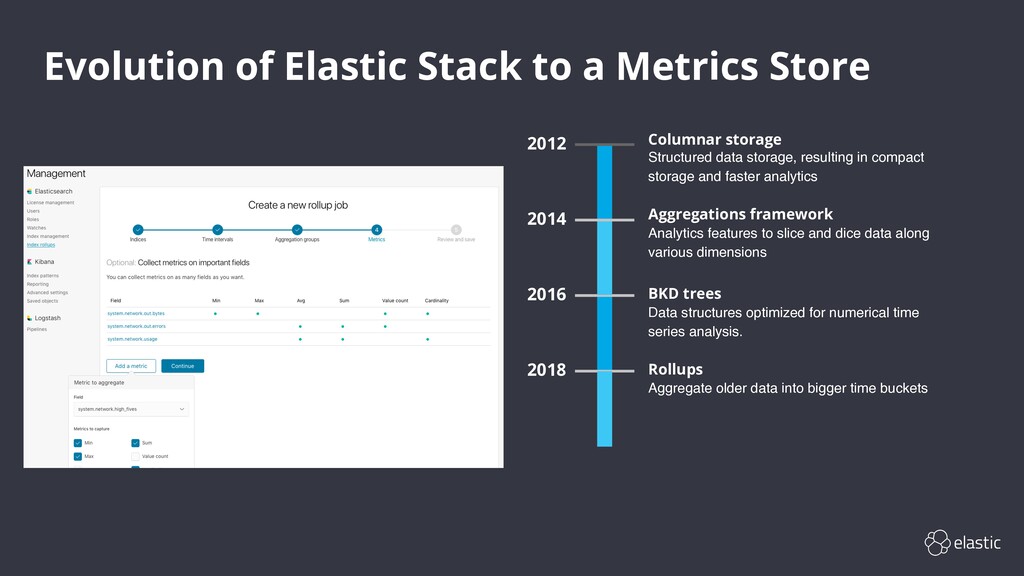
Data structures optimized for numerical time series analysis. Columnar storage Structured data storage, resulting in compact storage and faster analytics Rollups Aggregate older data into bigger time buckets Aggregations framework Analytics features to slice and dice data along various dimensions 2012 2016 2014 2018
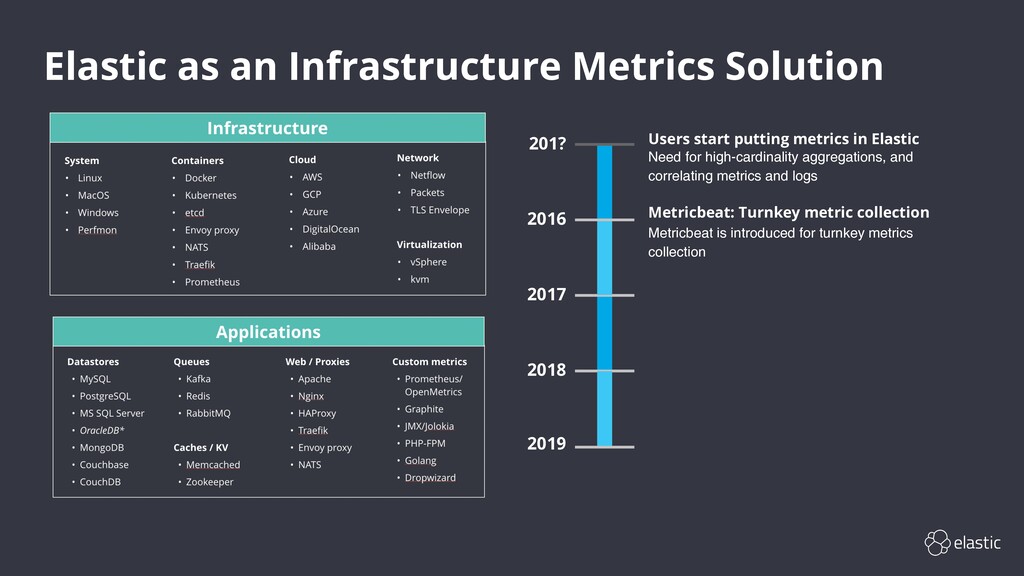
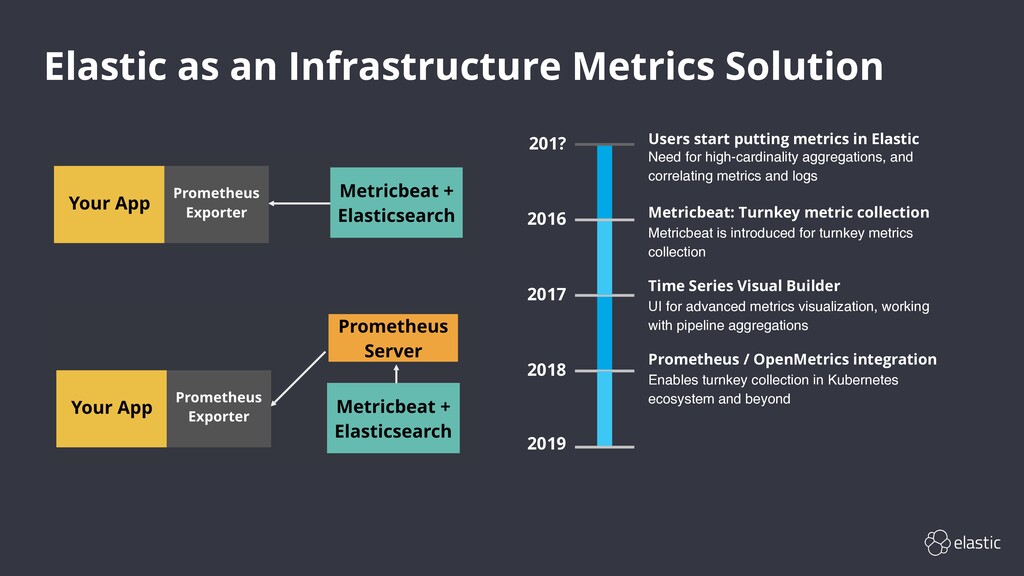
putting metrics in Elastic Need for high-cardinality aggregations, and correlating metrics and logs 2016 2018 2019 Metricbeat: Turnkey metric collection Metricbeat is introduced for turnkey metrics collection
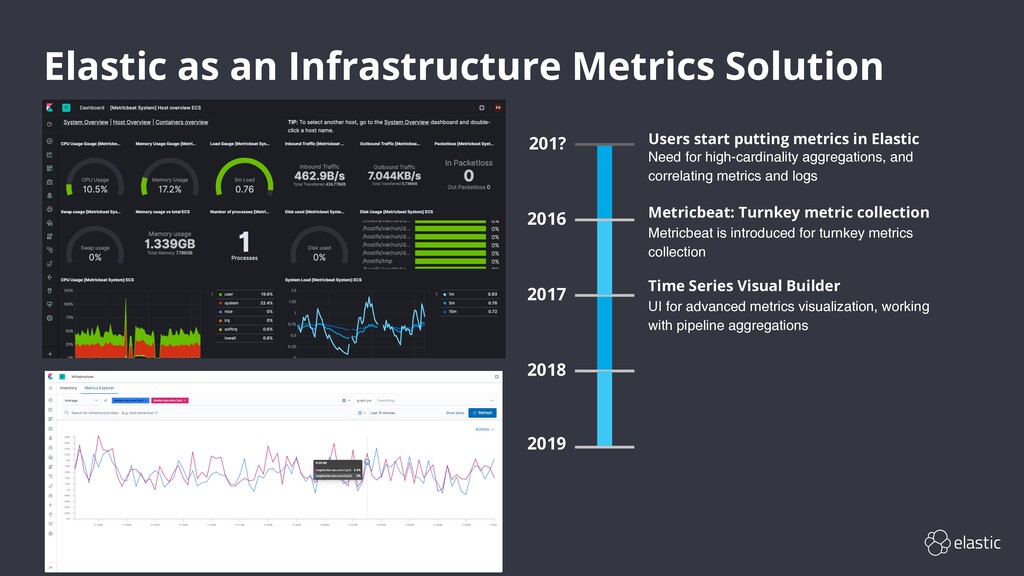
putting metrics in Elastic Need for high-cardinality aggregations, and correlating metrics and logs 2016 2018 2019 Metricbeat: Turnkey metric collection Metricbeat is introduced for turnkey metrics collection Time Series Visual Builder UI for advanced metrics visualization, working with pipeline aggregations
putting metrics in Elastic Need for high-cardinality aggregations, and correlating metrics and logs 2016 2018 2019 Metricbeat: Turnkey metric collection Metricbeat is introduced for turnkey metrics collection Time Series Visual Builder UI for advanced metrics visualization, working with pipeline aggregations Prometheus / OpenMetrics integration Enables turnkey collection in Kubernetes ecosystem and beyond
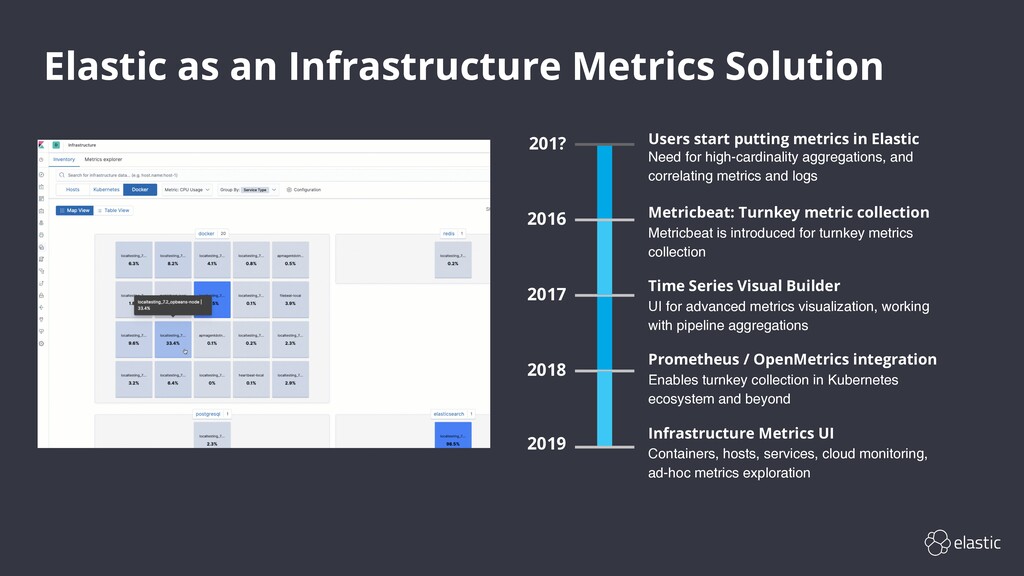
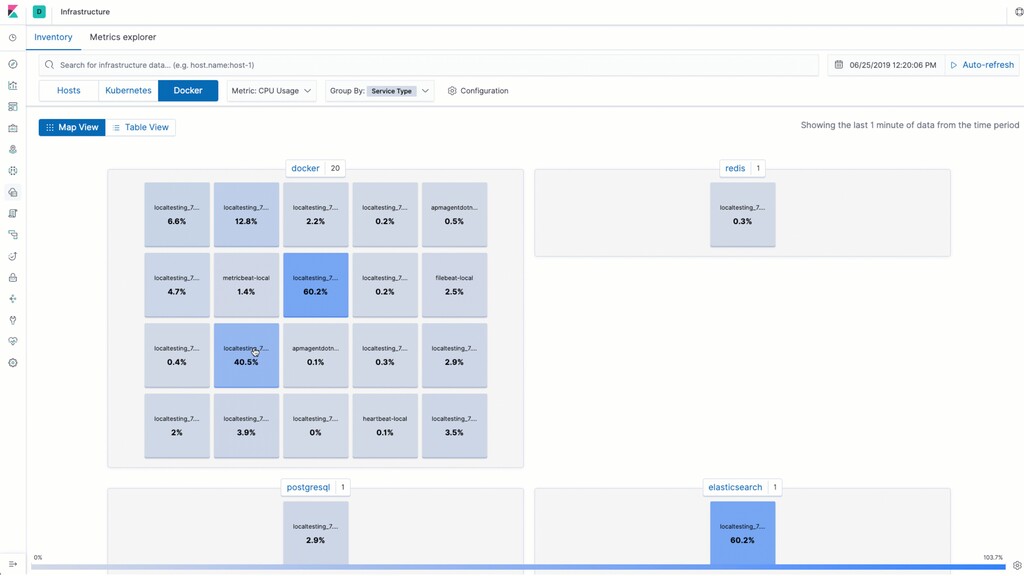
putting metrics in Elastic Need for high-cardinality aggregations, and correlating metrics and logs 2016 2018 2019 Metricbeat: Turnkey metric collection Metricbeat is introduced for turnkey metrics collection Time Series Visual Builder UI for advanced metrics visualization, working with pipeline aggregations Prometheus / OpenMetrics integration Enables turnkey collection in Kubernetes ecosystem and beyond Infrastructure Metrics UI Containers, hosts, services, cloud monitoring, ad-hoc metrics exploration
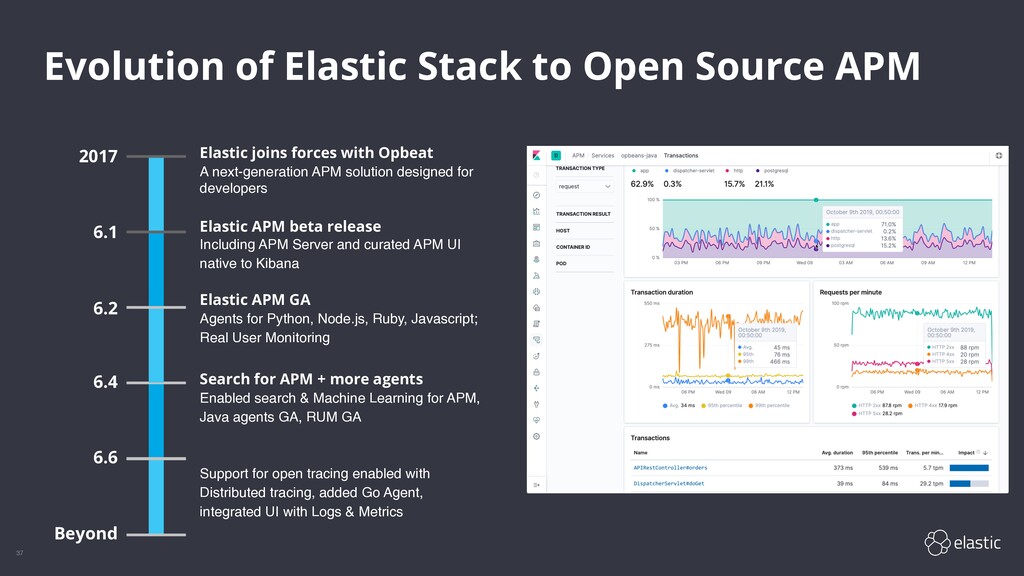
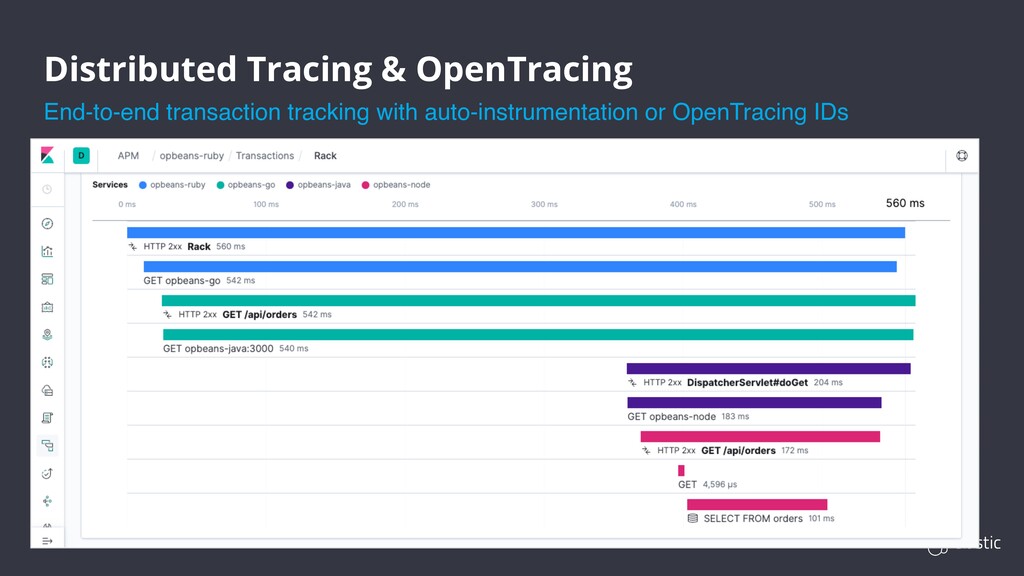
joins forces with Opbeat A next-generation APM solution designed for developers 2017 6.1 Search for APM + more agents Enabled search & Machine Learning for APM, Java agents GA, RUM GA 6.4 Elastic APM beta release Including APM Server and curated APM UI native to Kibana 6.2 Support for open tracing enabled with Distributed tracing, added Go Agent, integrated UI with Logs & Metrics 6.6 Elastic APM GA Agents for Python, Node.js, Ruby, Javascript; Real User Monitoring Beyond
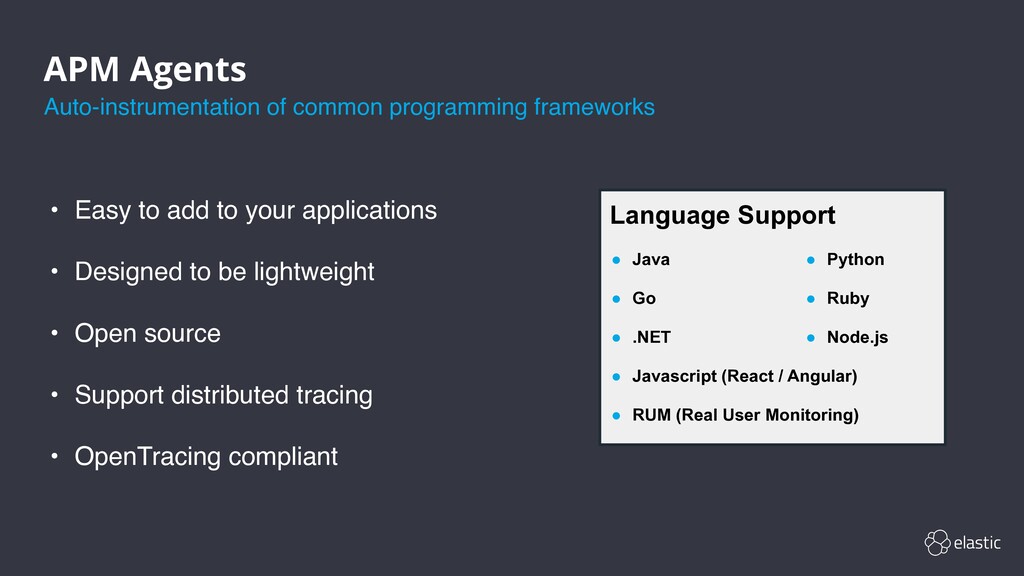
(React / Angular) • RUM (Real User Monitoring) Language Support • Python • Ruby • Node.js • Easy to add to your applications • Designed to be lightweight • Open source • Support distributed tracing • OpenTracing compliant Auto-instrumentation of common programming frameworks
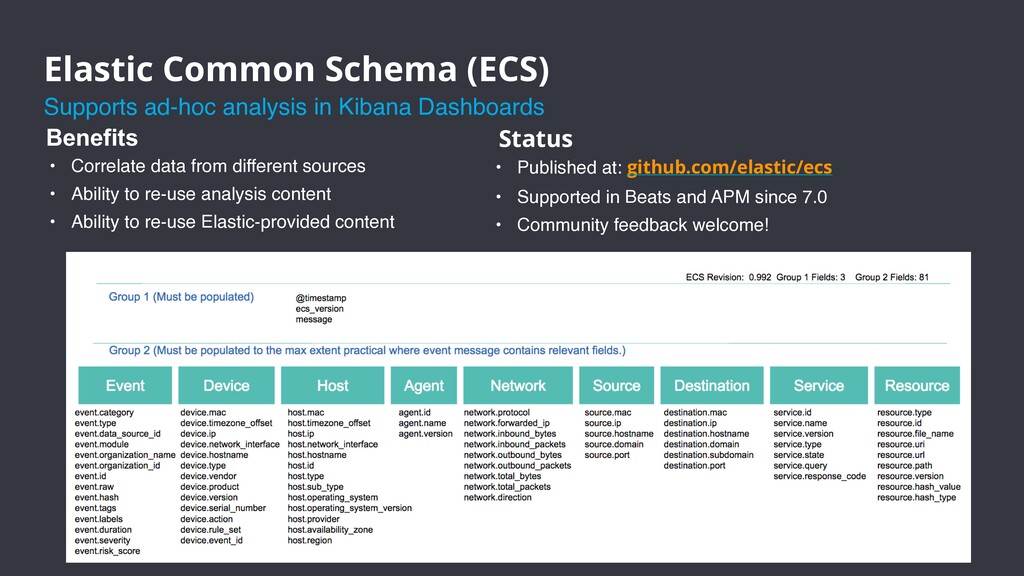
analysis content • Ability to re-use Elastic-provided content Benefits • Published at: github.com/elastic/ecs • Supported in Beats and APM since 7.0 • Community feedback welcome! Status Elastic Common Schema (ECS) Supports ad-hoc analysis in Kibana Dashboards
![Logs 64.242.88.10 - - [07/Jan/2019:16:10:02 -0800] "GET /mailman/listinfo/hsdivision HTTP/1.1" 200](https://files.speakerdeck.com/presentations/16b24a5afc174c8d8585e62aca2661de/slide_14.jpg)