Upgrade to Pro — share decks privately, control downloads, hide ads and more …

Montana's Aging Population

Montana's Aging Population

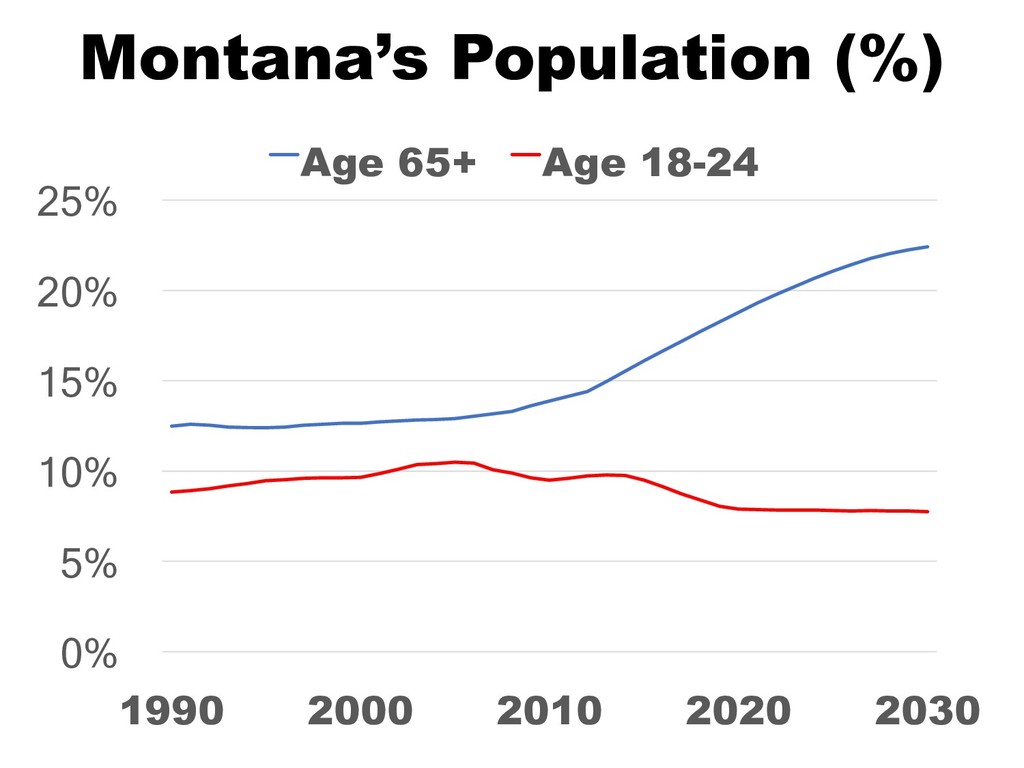
Dr. Douglas Young, MSU Wonderlust Council president and Montana State University professor emeritus (economics), presented an overview of Montana demographics at the Lifelong Learning Symposium on Oct. 4, 2018.

The symposium was hosted by MSU Wonderlust, a lifelong learning program of Montana State University's Academic Technology and Outreach (http://www.montana.edu/wonderlust)

MSU Outreach

October 04, 2018
Tweet

More Decks by MSU Outreach

Other Decks in Education

Transcript

  1. Montana’s Aging Population Douglas J Young Professor Emeritus (Economics) Montana

    State University 1 Lifelong Learning: New Opportunities for Aging Communities October 4, 2018
  2. Prior Work with George Haynes and Myles Watts • Blue

    Cross/Blue Shield of Montana • Montana Agricultural Experiment Station • Montana Area Agencies on Aging Association • Montana Association of Counties • Montana Bankers Association • Montana Chamber Foundation • Montana State University • Montana State University Extension • NorthWestern Energy • PPL Montana • University of Montana • Montana Council on Economic Education (MCEE) • ONE MONTANA: Bridging the Rural-Urban Divide 2
  3. Outline 1. Montana is Rapidly Aging 2. Aging varies Widely

    Across the State 3. Migration Plays a Big Role 4. Opportunities and Challenges
  4. Montana’s Population (%) 0% 5% 10% 15% 20% 25% 1990

    2000 2010 2020 2030 Age 65+ Age 18-24
  5. 1. Montana is Rapidly Aging • The Population Age 65+

    is • Growing in Both Absolute terms and as a Percentage of the Total Population. • The Population Age18-24 • Has been declining and is not expected to grow as a Percentage of the Total Population • The “Market” for Life Long Learning is Growing while that for Traditional Age Learning is Stagnant
  6. Measuring Migration Net Migration = # of People Who Move

    Into Montana minus # of People Who Move Out of Montana
  7. -2,000 -1,500 -1,000 -500 0 500 1,000 1,500 2,000 10

    15 20 25 30 35 40 45 50 55 60 65 70 75 Persons Age in 2010 Net Migration 2000 to 2010 11 Sources: U.S. Census and CDC
  8. -2,000 -1,500 -1,000 -500 0 500 1,000 1,500 2,000 10

    15 20 25 30 35 40 45 50 55 60 65 70 75 Persons Age in 2010 Net Migration Western/Southern Montana 2000 to 2010 13 Sources: U.S. Census and CDC
  9. -500 -400 -300 -200 -100 0 100 200 300 400

    500 10 15 20 25 30 35 40 45 50 55 60 65 70 75 Persons Age in 2010 Net Migration Yellowstone County 2000 to 2010 14 Sources: U.S. Census and CDC
  10. -2,000 -1,500 -1,000 -500 0 500 1,000 1,500 2,000 10

    15 20 25 30 35 40 45 50 55 60 65 70 75 Persons Age in 2010 Net Migration Eastern/Northern Montana 2000 to 2010 15 Sources: U.S. Census and CDC
  11. 4. Opportunities and Challenges • The Target Population for Life

    Long Learning will grow by 40% - more than 100,000 persons – between 2010 and 2030. • They are Spread across the 4th Largest State • Sixty Percent of the Target Population will Reside in Seven Counties: Cascade, Flathead, Gallatin, Lewis and Clark, Missoula, Ravalli, Yellowstone