Upgrade to Pro — share decks privately, control downloads, hide ads and more …

MAPPING ROSENBERG’S UTILITIES

Sponsored · Your Podcast. Everywhere. Effortlessly. Share. Educate. Inspire. Entertain. You do you. We'll handle the rest.

MAPPING ROSENBERG’S UTILITIES

More Decks by Texas Natural Resources Information System

Other Decks in Technology

Transcript

  1. Rosenberg in the 2000s • Rosenberg is booming. • Long-time

    (20-30yr) utility staff retiring • 2008 Massive Sewer Rehab began • New Pro-GIS department head
  2. Way back in 2014… • Fall 2014 – City hires

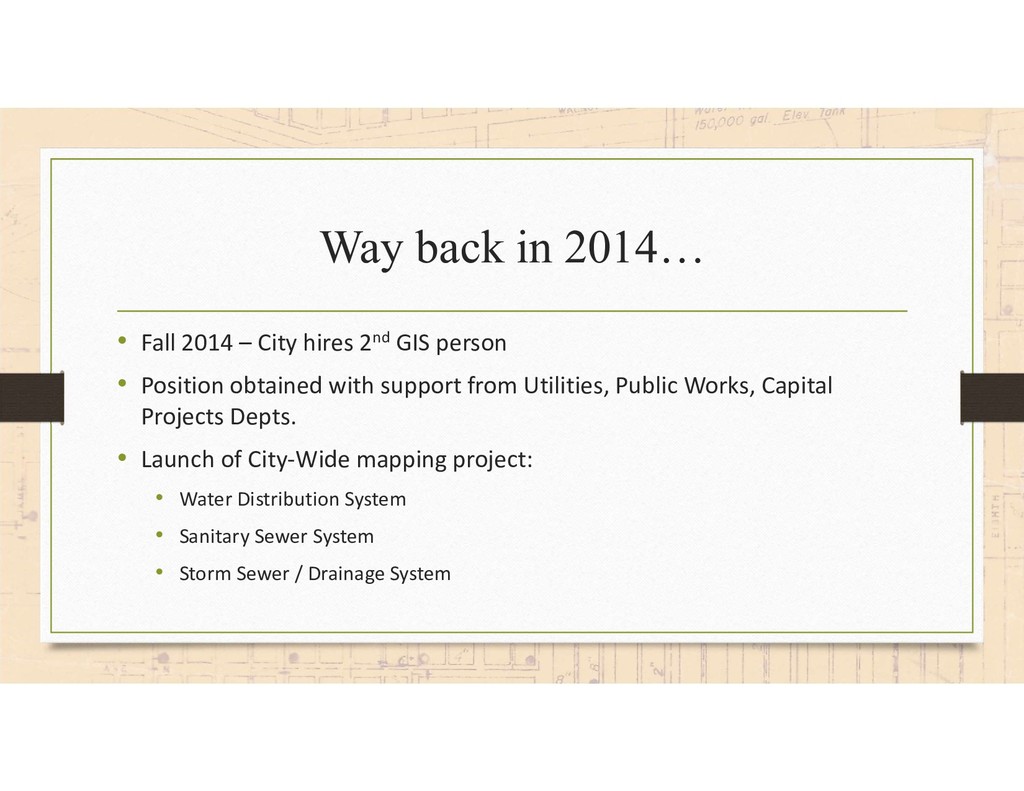
    2nd GIS person • Position obtained with support from Utilities, Public Works, Capital Projects Depts. • Launch of City-Wide mapping project: • Water Distribution System • Sanitary Sewer System • Storm Sewer / Drainage System
  3. First things First • Nov 2014 – Jan 2015 •

    Assessed Data • Held Stakeholder Meetings • Developed Data Model
  4. Data Assessment • Reviewed our existing data • GIS layers

    existed, but… • Looked at other Cities • Looked at ESRI Local Government Model
  5. Water Layers Source: ? Issues: • No connectivity • Missing

    newest areas • No Attributes! • Poor locational accuracy Assessment: Garbage
  6. Sanitary Layers Source: 2006 Study Advantages: • Original survey input

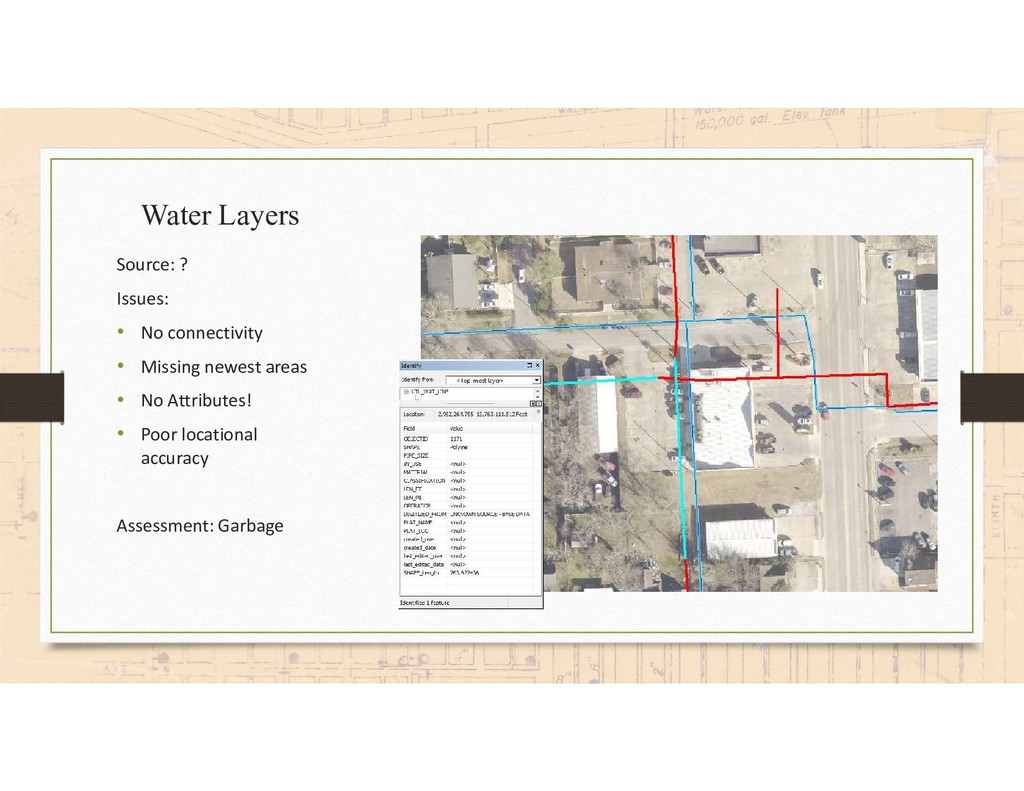
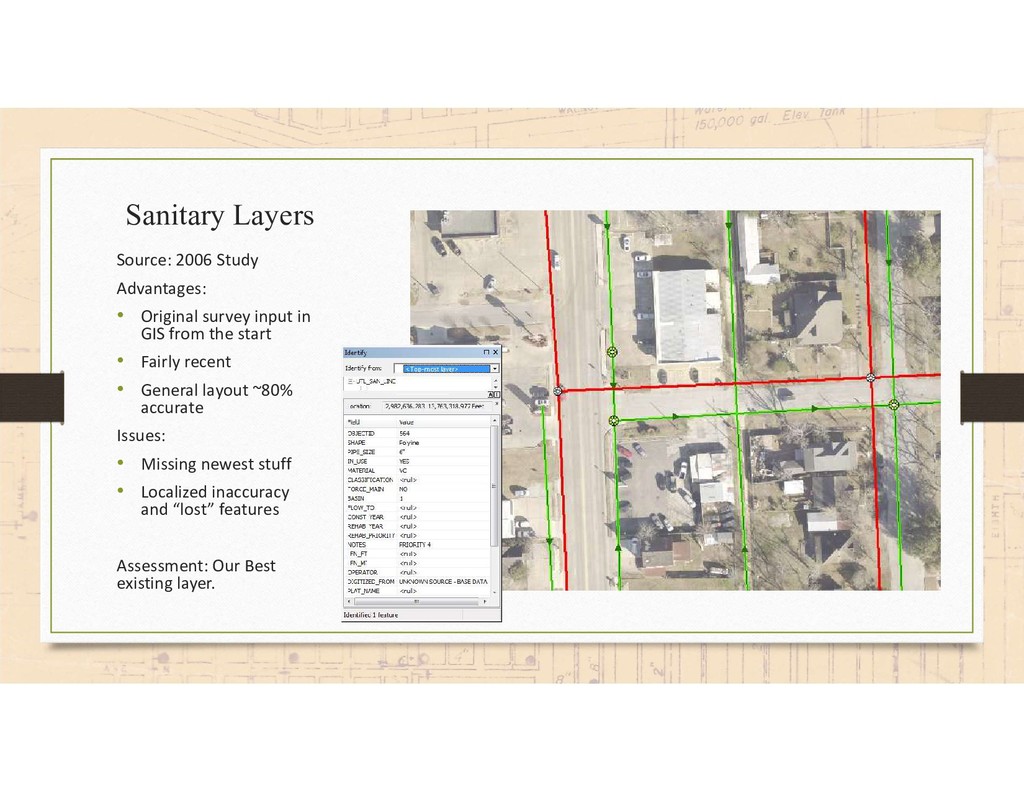
    in GIS from the start • Fairly recent • General layout ~80% accurate Issues: • Missing newest stuff • Localized inaccuracy and “lost” features Assessment: Our Best existing layer.
  7. Storm Layers Source: CAD file(s)from 1990s Issues: • No match

    inlet to lines • Missing new areas • No Attributes! Assessment: Not much better than water layers
  8. Stake Holder Meetings • Conducted 3 separate meetings – one

    for each system • Meetings included: • GIS Staff • City Engineer (contractor) • Head of Public Services Division • Relevant Department Head – Utilities, Public Works
  9. Stake Holder Meetings • Discussed: • Schema (though not in

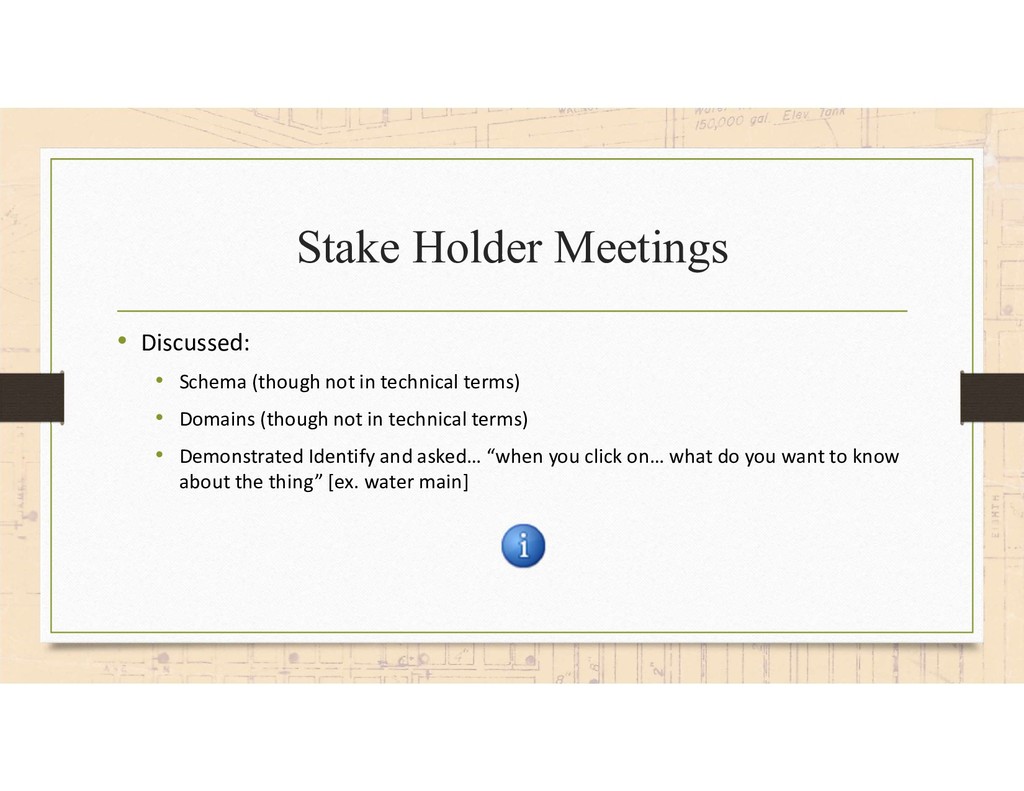
    technical terms) • Domains (though not in technical terms) • Demonstrated Identify and asked… “when you click on… what do you want to know about the thing” [ex. water main]
  10. (New) Data Model • Modified ESRI Local Government Model •

    Dropped a field or two • Added a few fields
  11. “Mapping Phase” • Prepped Existing Data (for transfer) • Transferred

    exiting data to new schema • 1st Stage Cleanup • Correct Geometry • Populate Attributes • 2nd Stage Cleanup (Topology) • 3rd Stage (Geometric Network) • Maintenance & Refinement… into eternity
  12. The Process (Stage 1) • Separated the City into Project

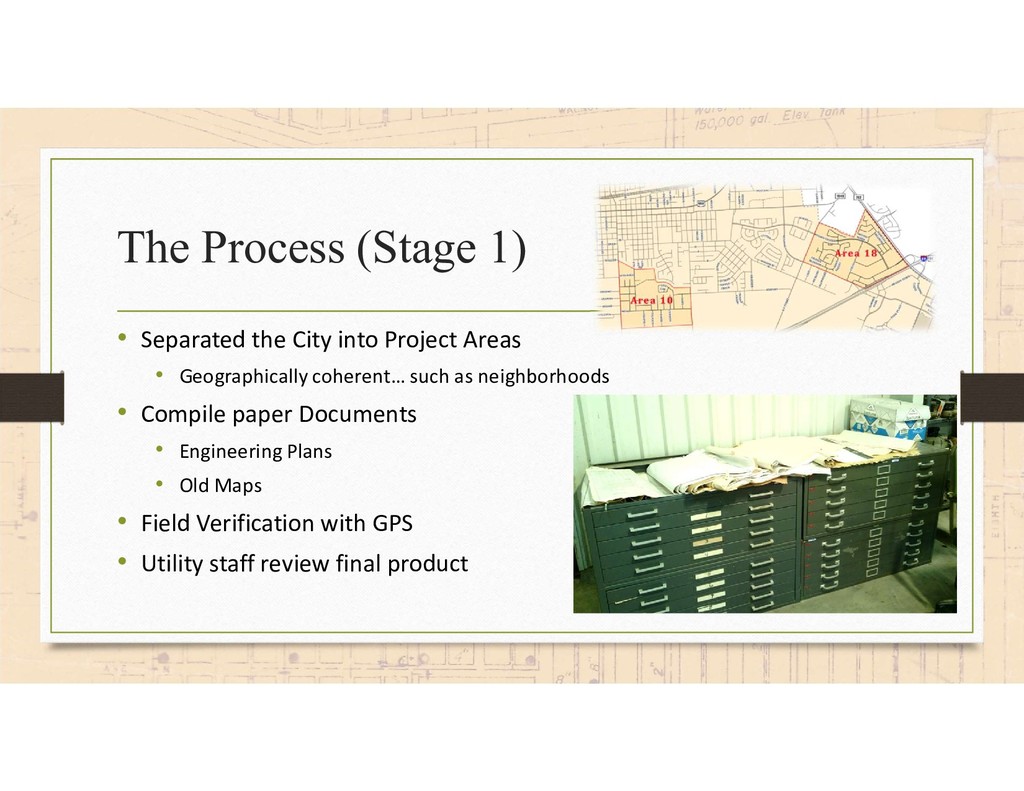
    Areas • Geographically coherent… such as neighborhoods • Compile paper Documents • Engineering Plans • Old Maps • Field Verification with GPS • Utility staff review final product
  13. Data Collection – Paper Records Old Plans were: • Sorted

    • Scanned • Georeferenced • Glorified Tracing… Plans accounted for the vast bulk of our information.
  14. Data Collection – Field Verification In the field: • GPS

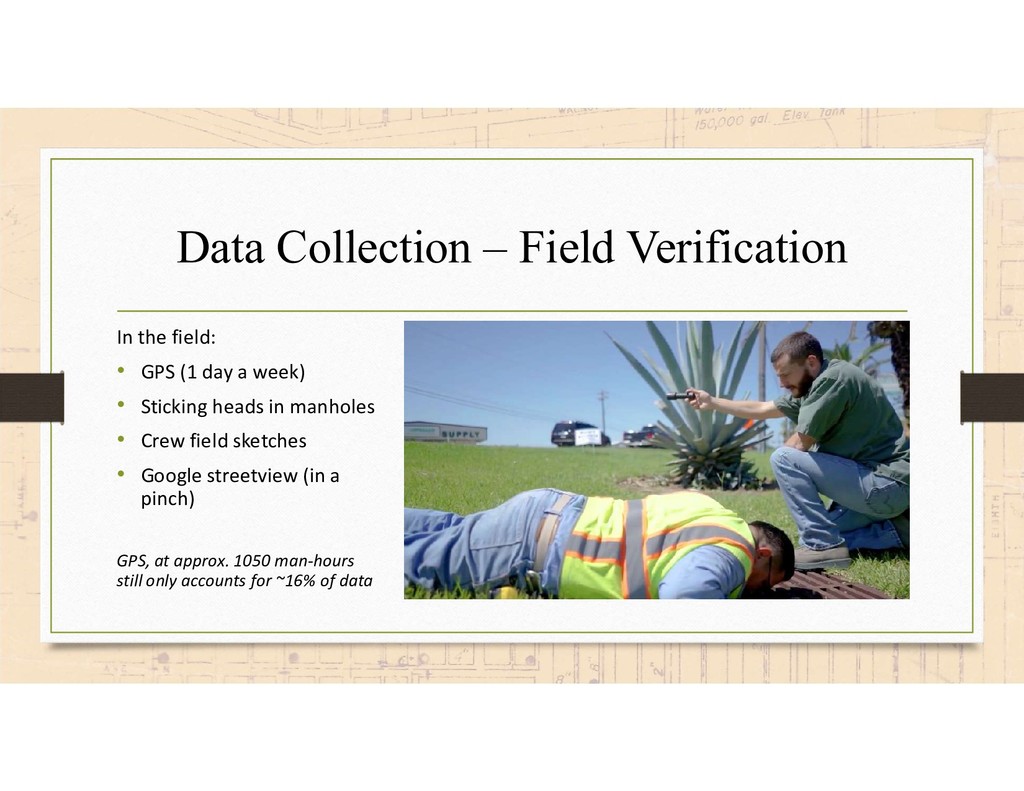
    (1 day a week) • Sticking heads in manholes • Crew field sketches • Google streetview (in a pinch) GPS, at approx. 1050 man-hours still only accounts for ~16% of data
  15. Results • 2 ½ Years to complete all 3 systems

    • 257 mi Water Mains • 213 mi Sanitary Sewer Mains • 160 mi Storm Sewer Mains • 32,000+ Point Features – Valves, Manholes, Inlets, etc… • Field Crew Buy-In when less than half done
  16. Results Cont’d • 678 Sets of Eng. Plans • 11

    City-Wide System Maps (historical) • 32 Field-Sketches • And Counting…
  17. Lessons Learned & Take Aways • Lesson Learned. Provided stakeholders

    with detail at the get-go. • Lesson Learned. GPS & field verification is extremely time consuming. • Lesson Learned. Not all GPS is equal. Know your actual accuracy. • Lesson Learned. Use of higher-level software functionality (ie domains, topology, and attribute assistant) is vital to minimizing human error. • Take away. Surprising acceptance by field crews of “GIS Map” • Lesson Learned. Know your subject, and compare sources like a researcher. • Take away. Explain the purpose of data you are recording to staff recording it (example, valve pictures)
  18. City of Rosenberg GIS Presenter: Cory Vardaman – GIS Specialist

    Email: [email protected] Community Development 2220 4th St Rosenberg TX, 77471