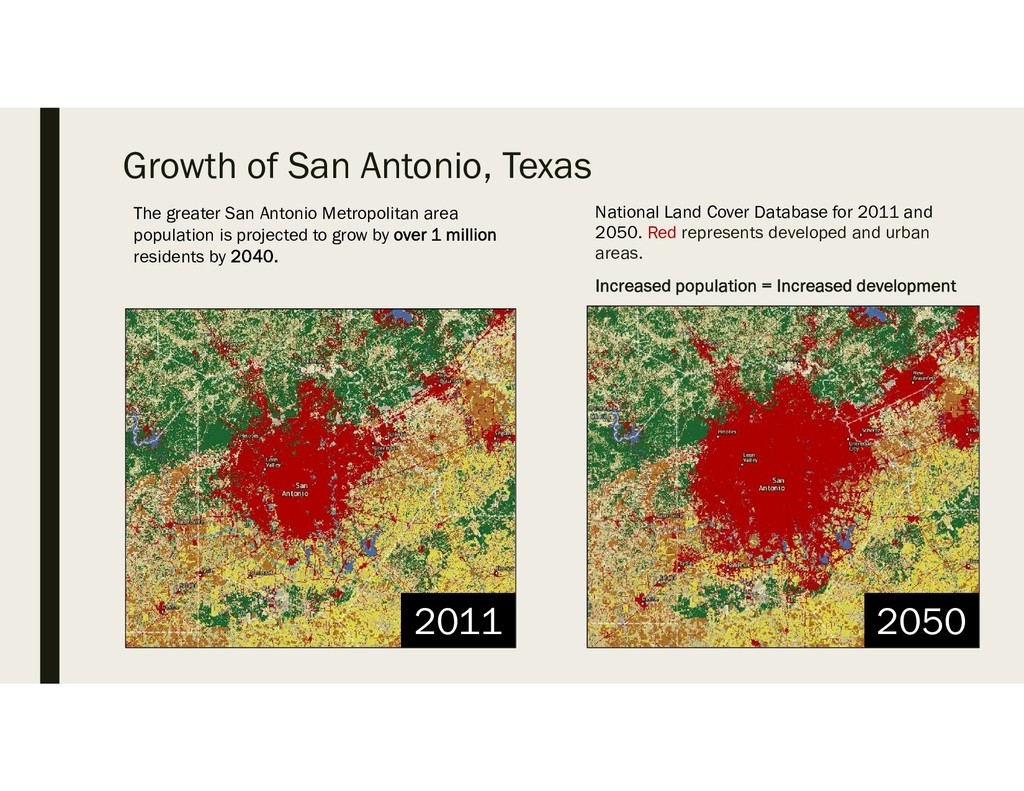
2011 and 2050. Red represents developed and urban areas. Increased population = Increased development The greater San Antonio Metropolitan area population is projected to grow by over 1 million residents by 2040. 2011 2050
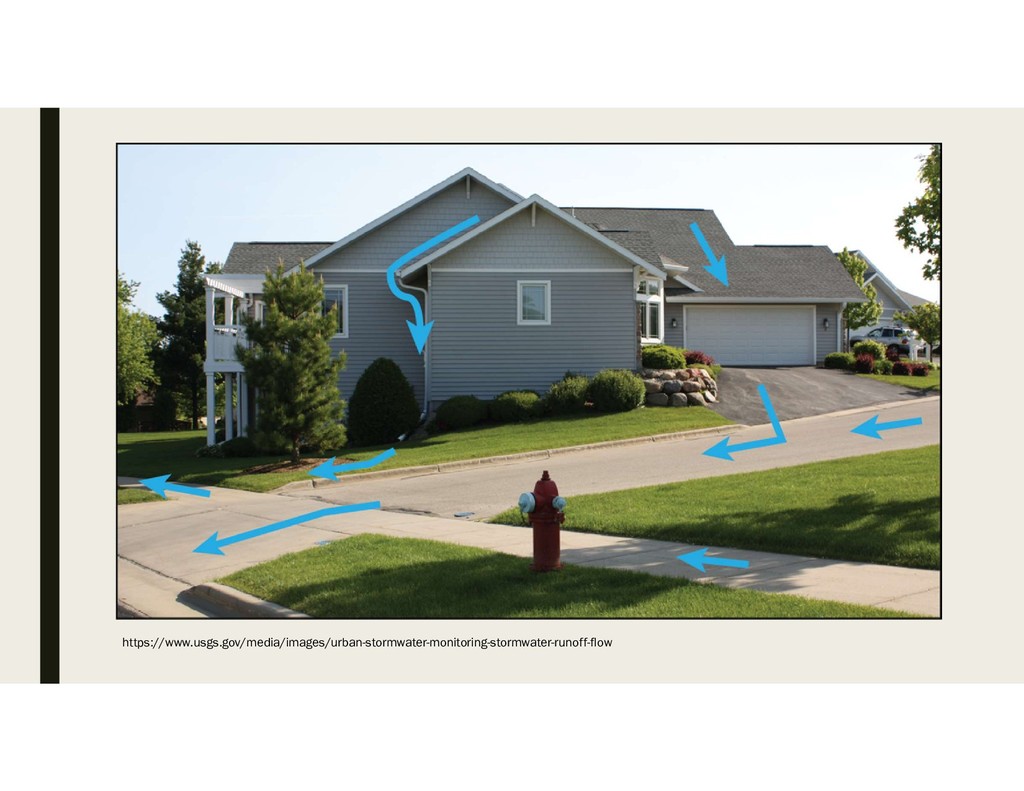
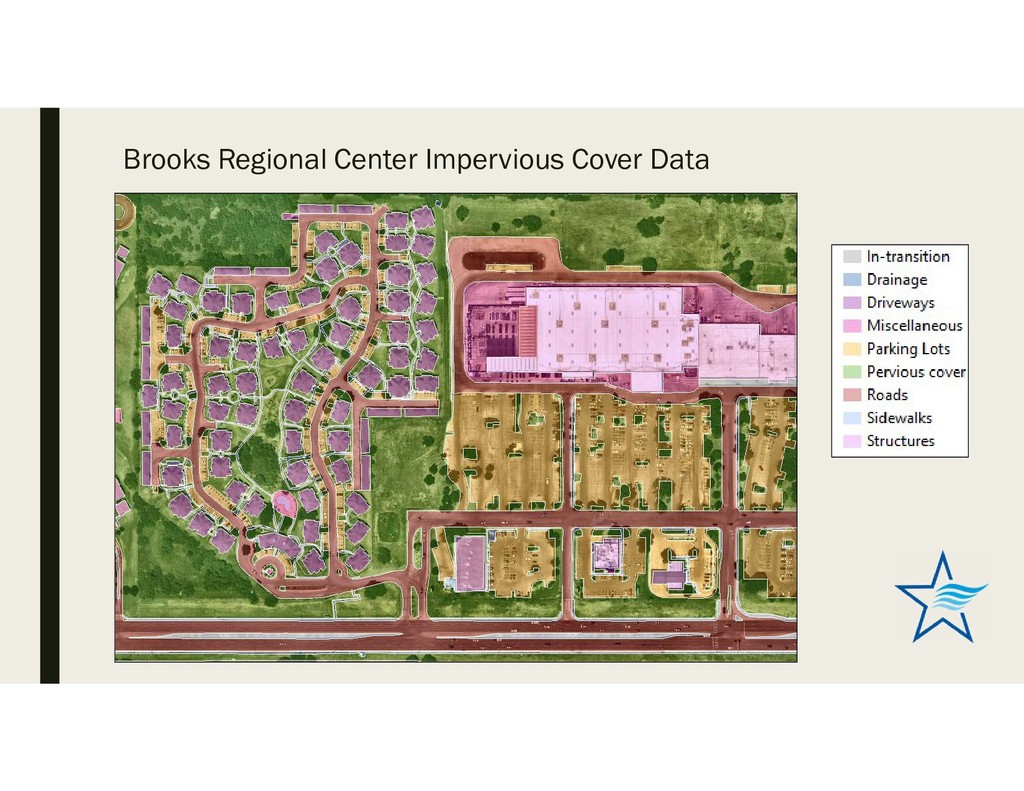
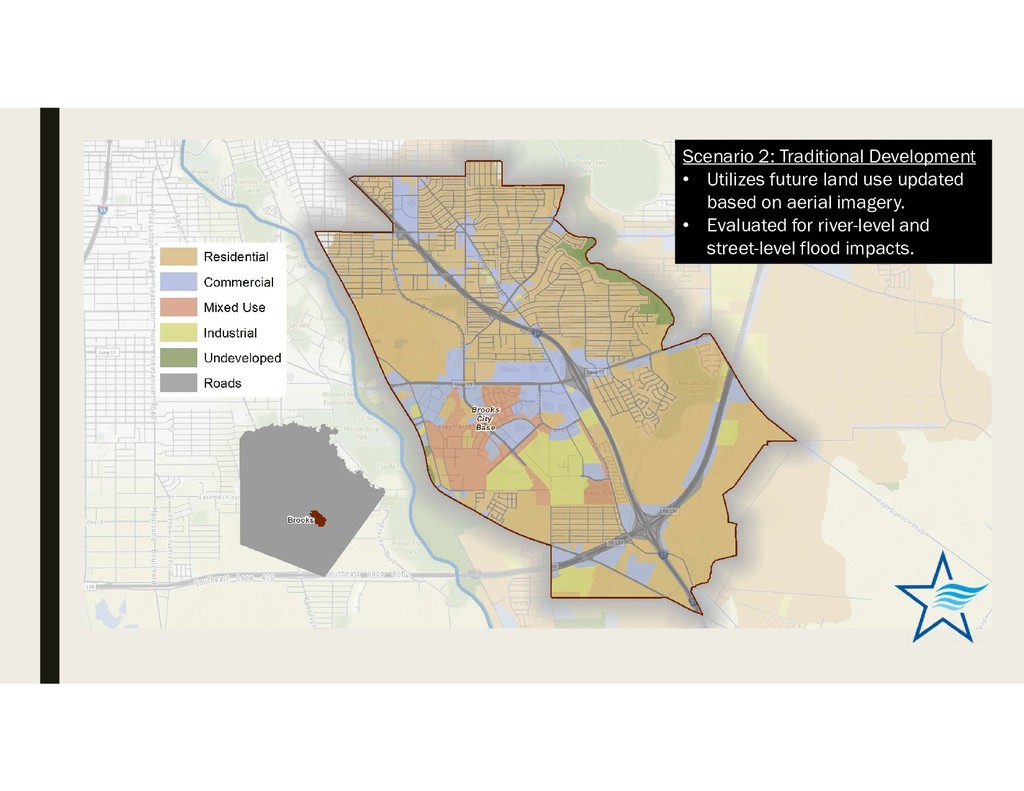
cover: Increased flooding for streams and at street level. Degradation in water quality and stream health. Increased stormwater runoff and cost for stormwater infrastructure. Brooks Regional Center
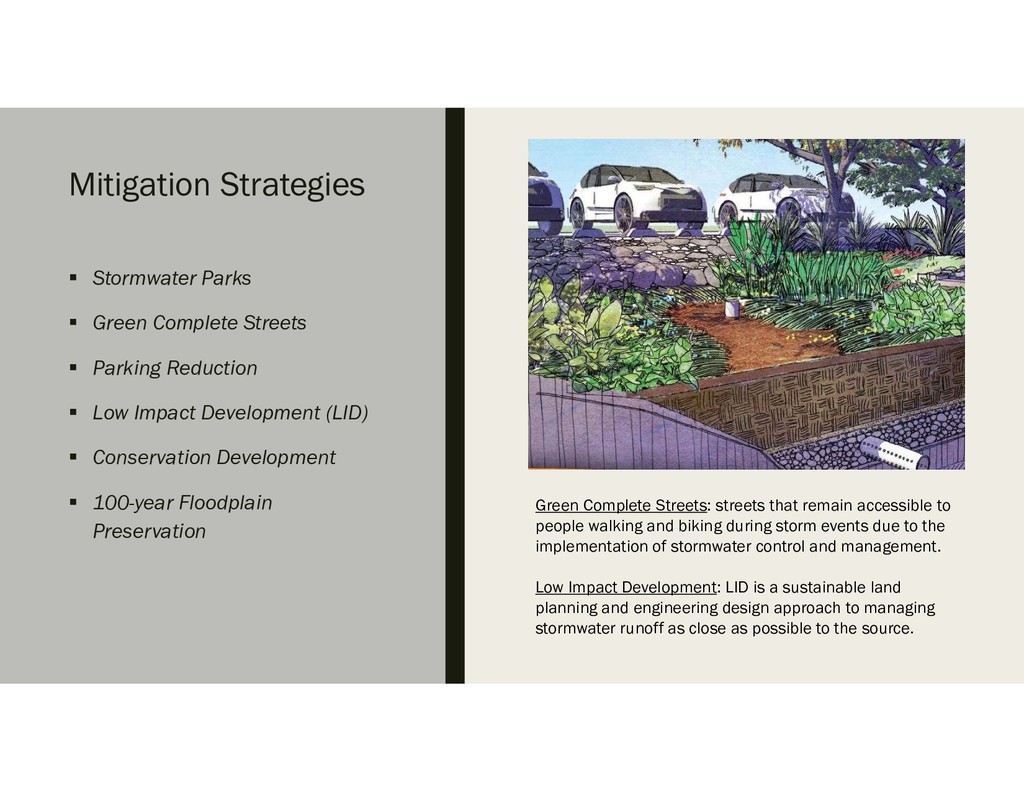
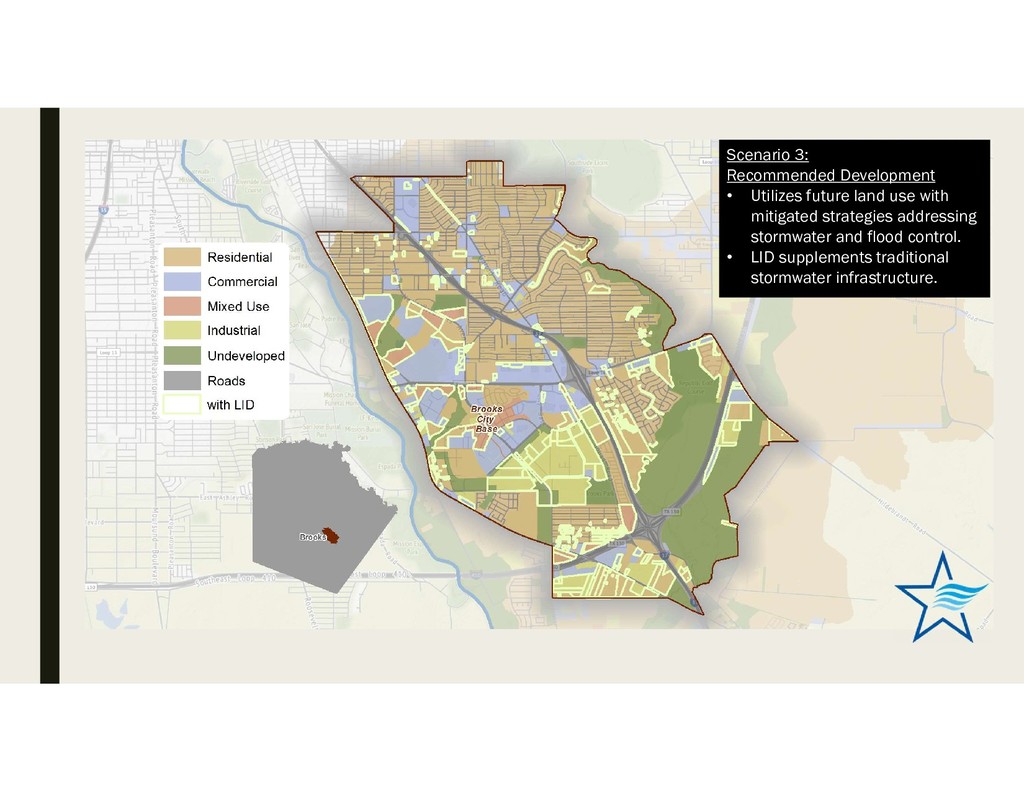
Parking Reduction Low Impact Development (LID) Conservation Development 100-year Floodplain Preservation Green Complete Streets: streets that remain accessible to people walking and biking during storm events due to the implementation of stormwater control and management. Low Impact Development: LID is a sustainable land planning and engineering design approach to managing stormwater runoff as close as possible to the source.
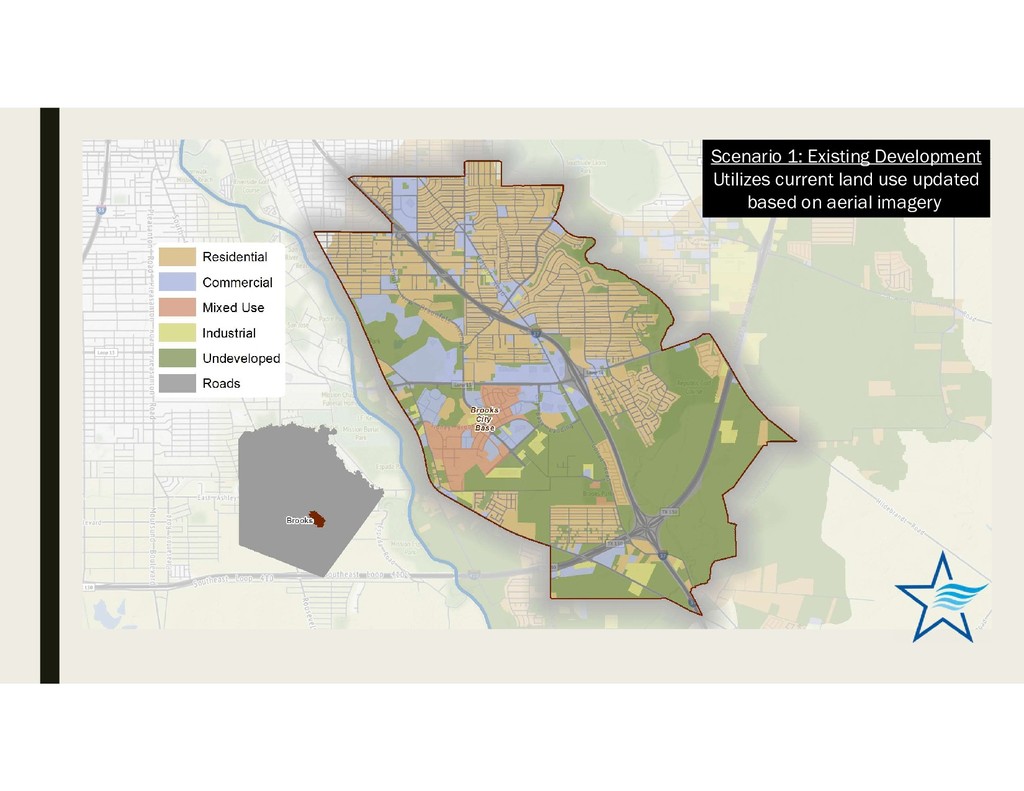
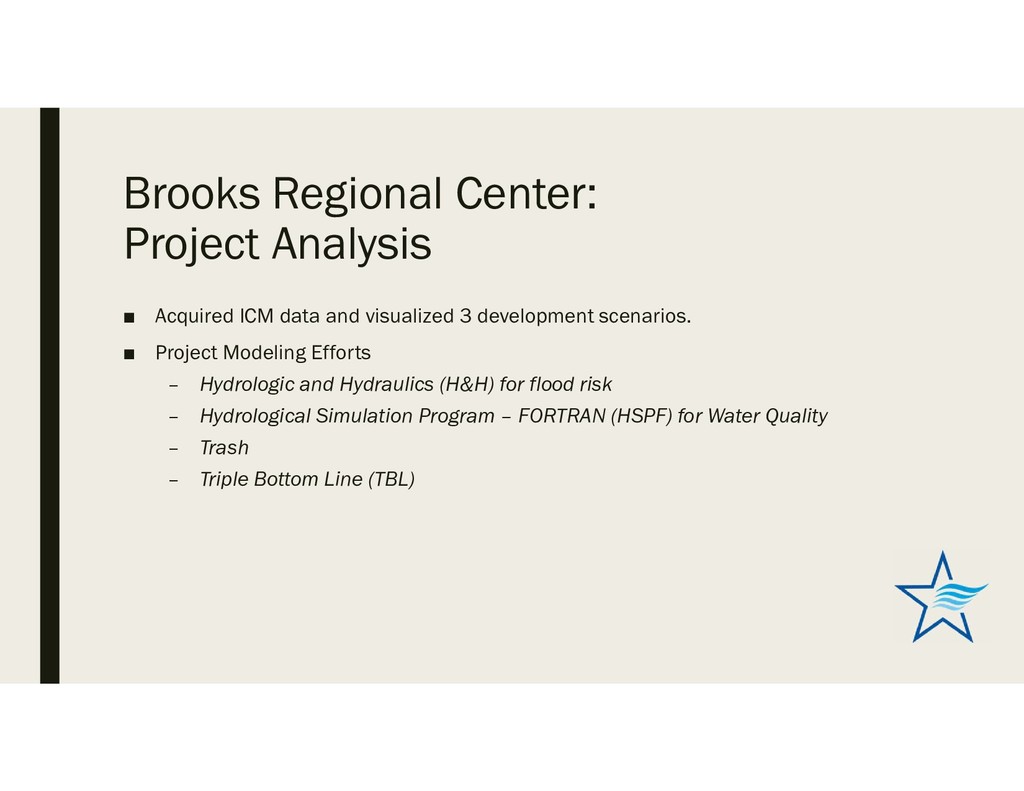
visualized 3 development scenarios. ▪ Project Modeling Efforts – Hydrologic and Hydraulics (H&H) for flood risk – Hydrological Simulation Program – FORTRAN (HSPF) for Water Quality – Trash – Triple Bottom Line (TBL)
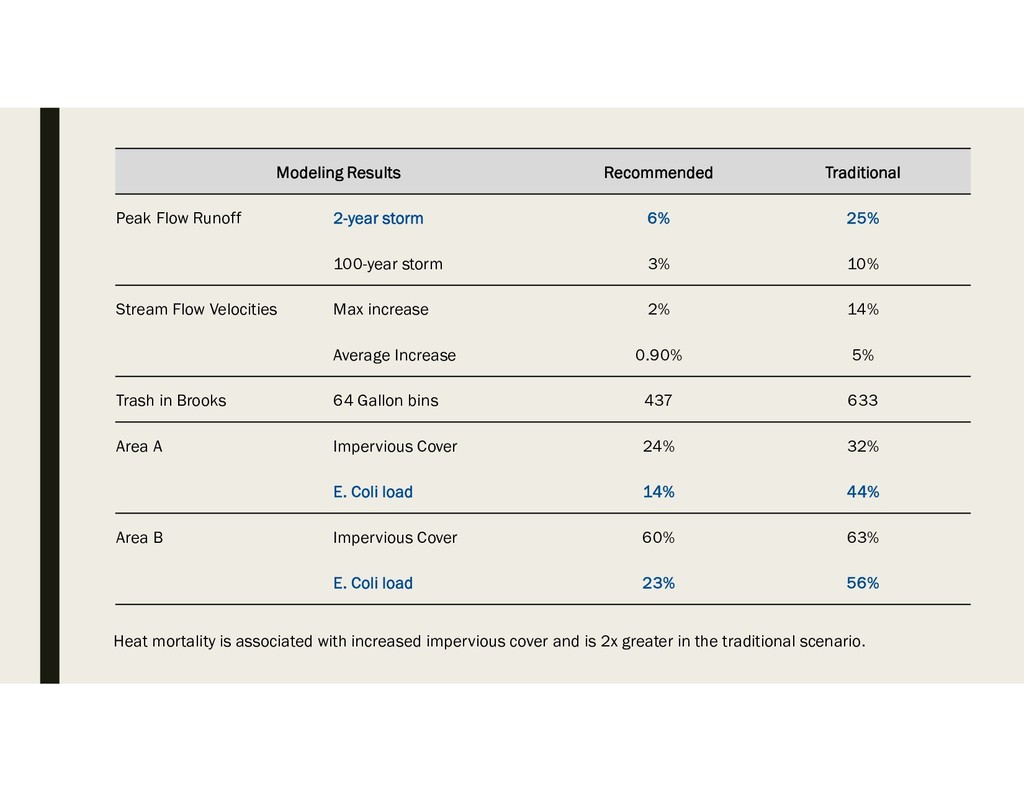
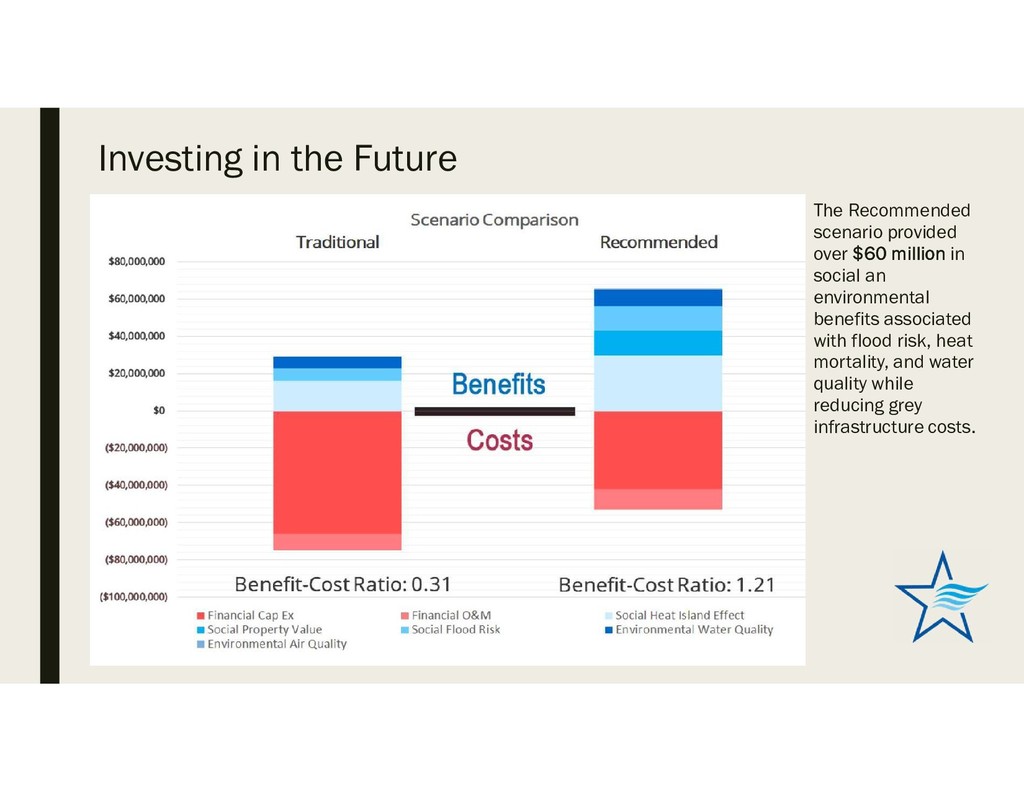
25% 100-year storm 3% 10% Stream Flow Velocities Max increase 2% 14% Average Increase 0.90% 5% Trash in Brooks 64 Gallon bins 437 633 Area A Impervious Cover 24% 32% E. Coli load 14% 44% Area B Impervious Cover 60% 63% E. Coli load 23% 56% Heat mortality is associated with increased impervious cover and is 2x greater in the traditional scenario.
LID and to serve as a model of higher quality development, in part through LID, for the rest of the City. ▪ BDA has applied for a Great Urban Park grant to enhance an existing park by incorporating a stormwater park. ▪ Brooks submitted numerous applications on different projects incorporating LID for SARA’s 2018/19 LID rebate funding.
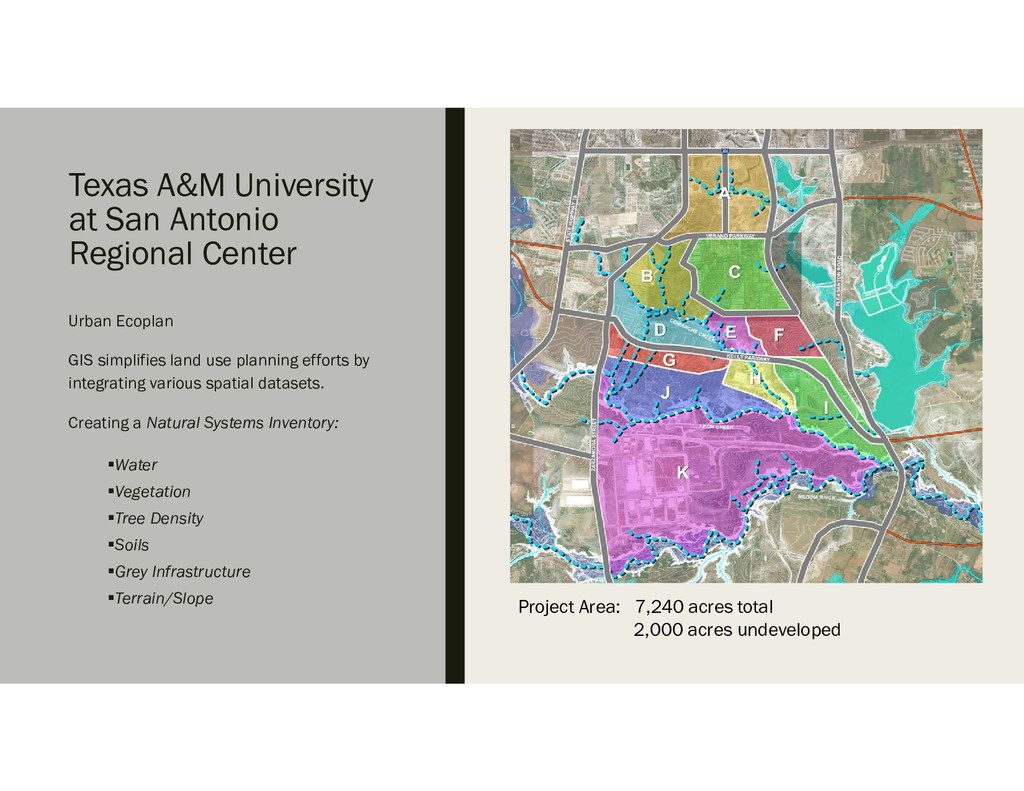
GIS simplifies land use planning efforts by integrating various spatial datasets. Creating a Natural Systems Inventory: Water Vegetation Tree Density Soils Grey Infrastructure Terrain/Slope Project Area: 7,240 acres total 2,000 acres undeveloped
Master Plans: ▪ Increased enrollment of 5,500 students to 12,500 students over the next several years. ▪ a complete build-out of campus to accommodate more than 50,000 students. ▪ Increased academic and administrative facilities, on-campus student housing, recreation and student-life function and identifying critical infrastructure projects and parking needs.
![SARA MENDIOLA SAN ANTONIO RIVER AUTHORITY [email protected] 210-302-3299](https://files.speakerdeck.com/presentations/a8500ceeb2dd470e91ec995e05d03d5f/slide_18.jpg)