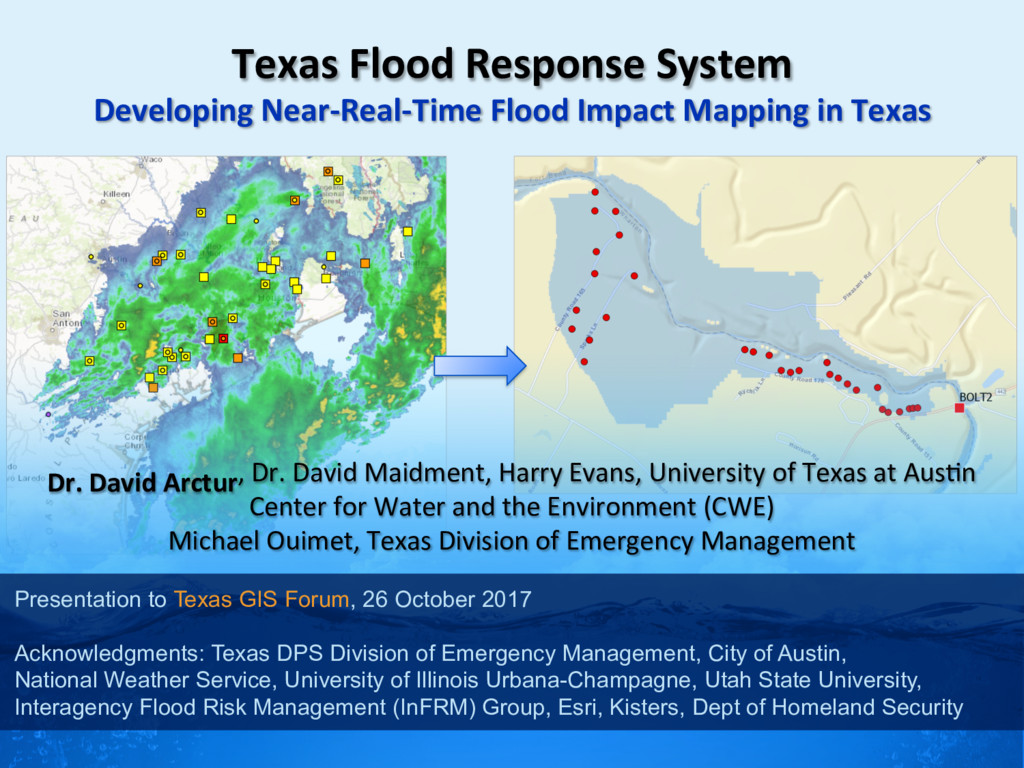
Texas at Aus:n Center for Water and the Environment (CWE) Michael Ouimet, Texas Division of Emergency Management Presentation to Texas GIS Forum, 26 October 2017 Acknowledgments: Texas DPS Division of Emergency Management, City of Austin, National Weather Service, University of Illinois Urbana-Champagne, Utah State University, Interagency Flood Risk Management (InFRM) Group, Esri, Kisters, Dept of Homeland Security Texas Flood Response System Developing Near-Real-Time Flood Impact Mapping in Texas
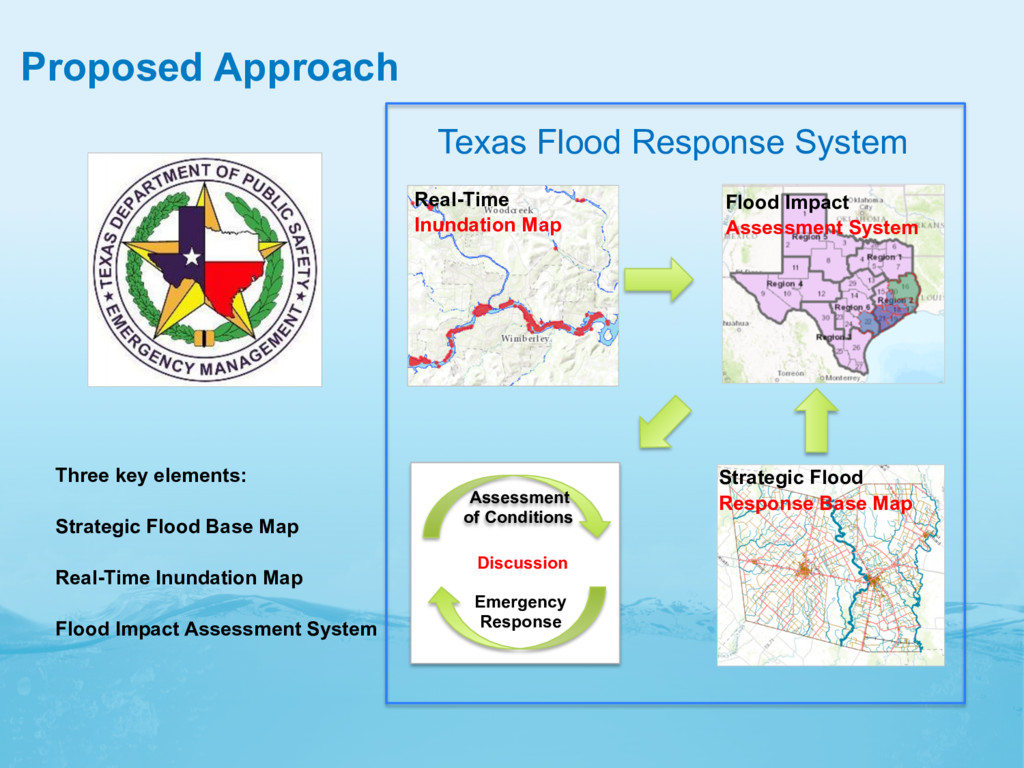
2016 to March 2018 Led by Dr. David Maidment & Harry Evans, UT Austin and Michael Ouimet, TDEM Critical Information Systems • Develop local prototype flood planning template • Conduct tabletop exercises on local prototype • Conduct stakeholder meetings at the local, regional, state and federal level • Produce flood response maps linked to NWS flood forecast to depict likely extent of flooding on a regional basis in Texas
• Capital Area Fire Chief Association • Travis County Emergency Management • Blanco County Emergency Management • Williamson County Emergency Management • Wharton County Emergency Management • Williamson County Fire Chiefs • Upper Brushy Creek Water Control District • San Marcos Emergency Management • Hays County Emergency Management State Partners • Texas Division of Emergency Management (TDEM) • Texas Natural Resource Information Systems (TNRIS) • Texas Water Development Board (TWDB) • Texas Commission on Environmental Quality (TCEQ) • Texas Department of Transportation (TxDOT) • Texas Floodplain Managers City Partners • City of Austin • Austin Fire Department • Austin Flood Early Warning System (FEWS) • Austin Homeland Security Emergency Management (HSEM) • Houston Office of Emergency Management Federal Partners • National Weather Service (NWS) • National Oceanic Atmospheric Administration (NOAA) • Federal Emergency Management Agency (FEMA) • US Geological Survey (USGS) • US Army Corps of Engineers (USACE)
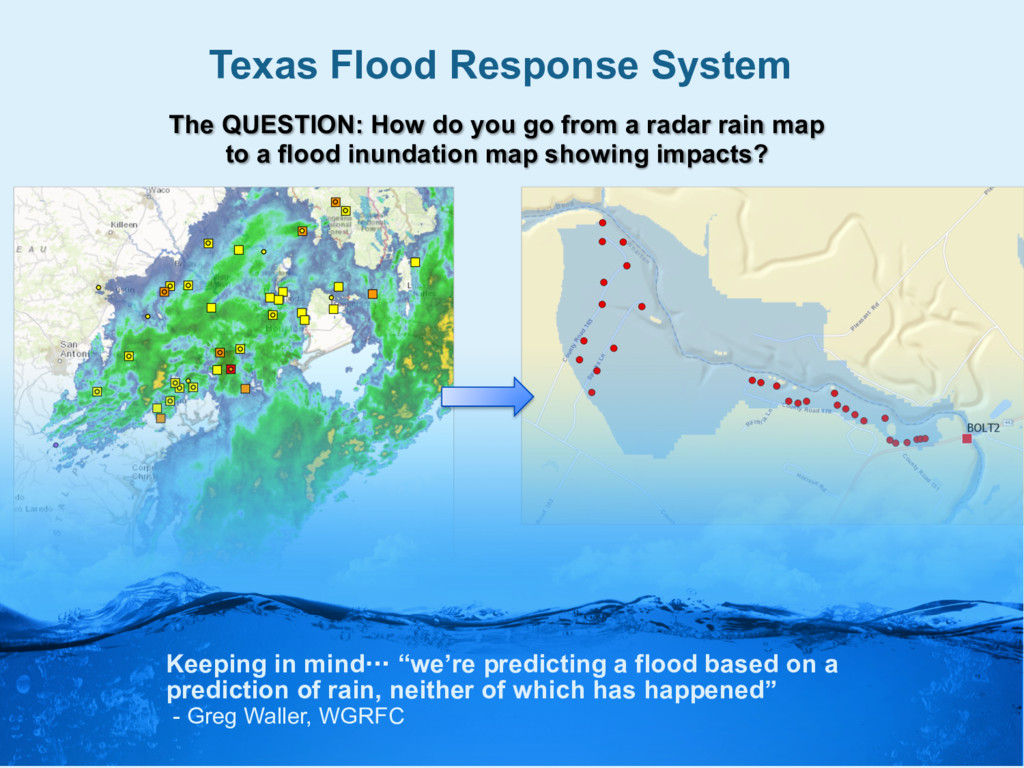
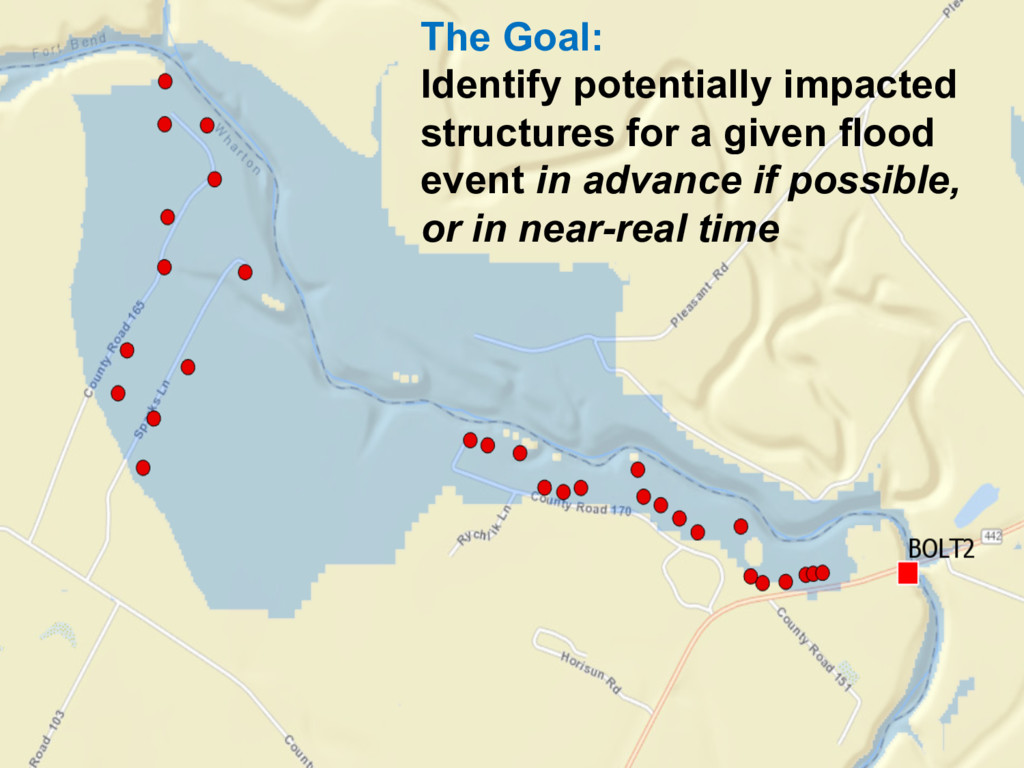
from a radar rain map to a flood inundation map showing impacts? Keeping in mind… “we’re predicting a flood based on a prediction of rain, neither of which has happened” - Greg Waller, WGRFC
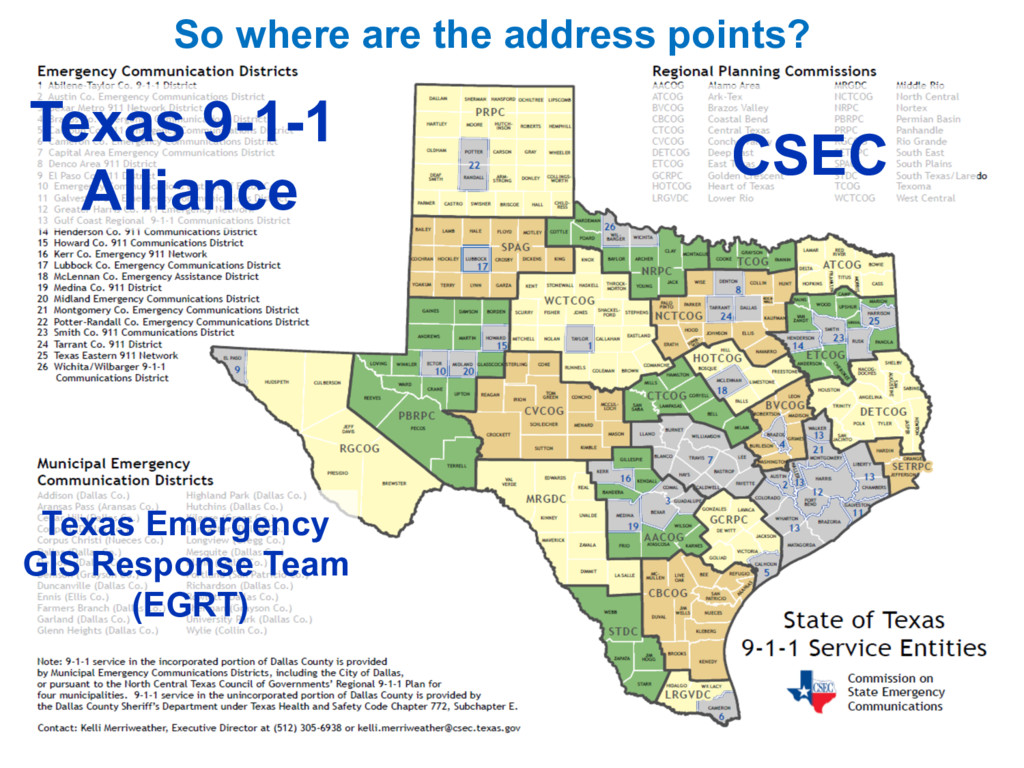
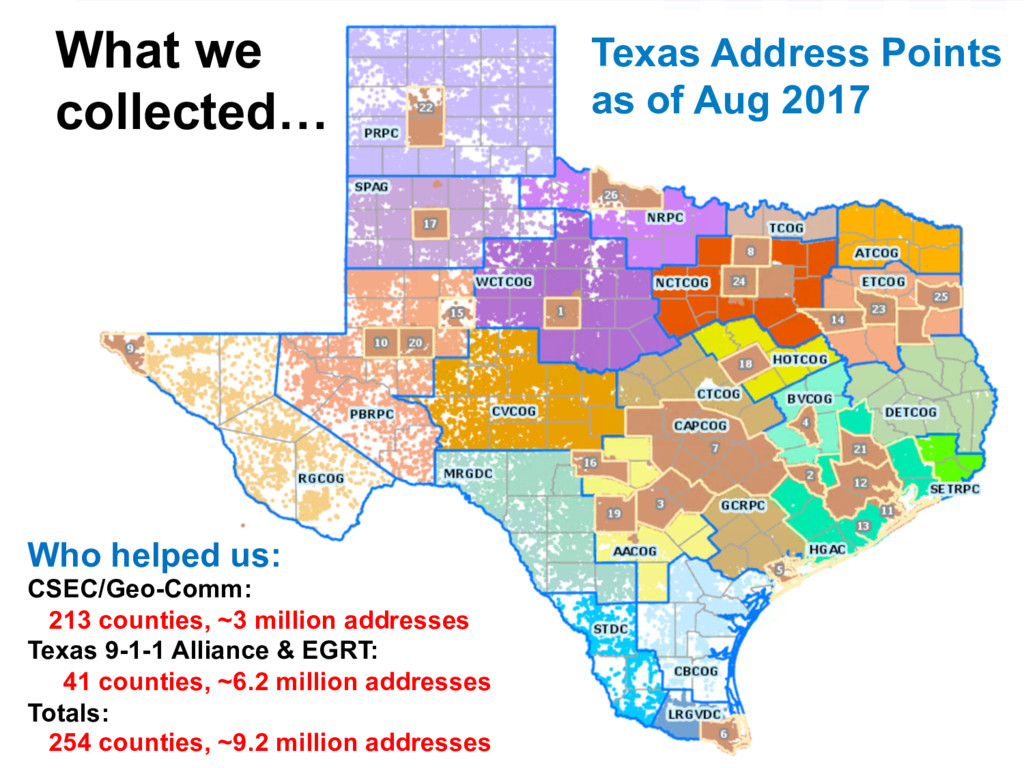
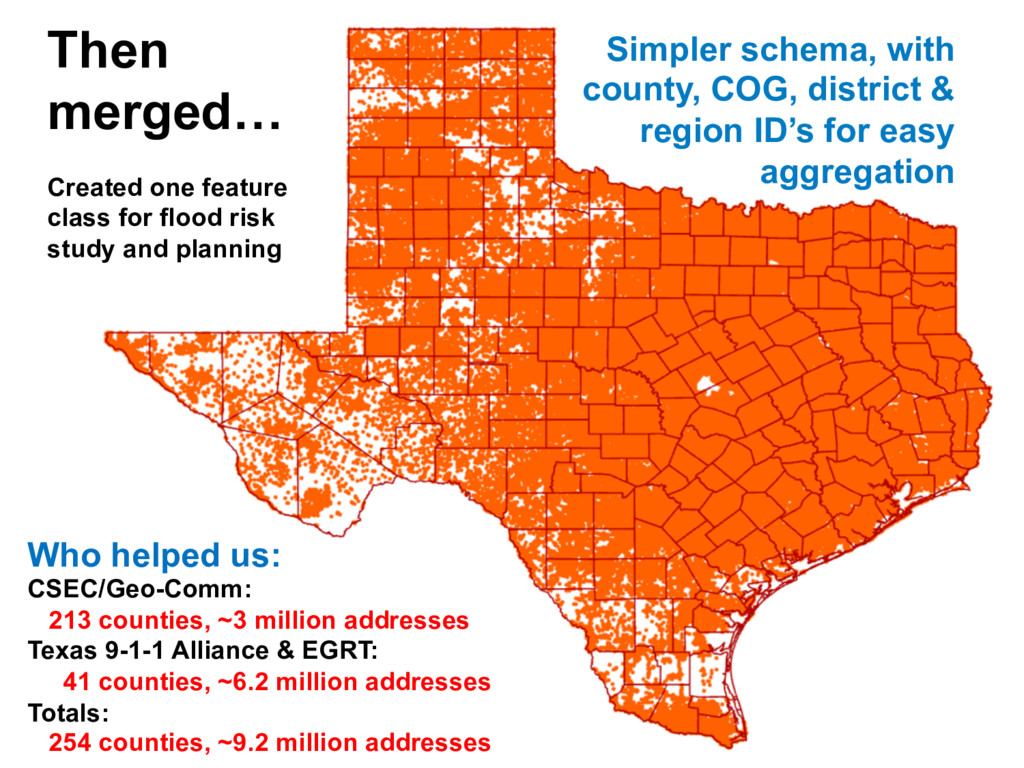
easy aggregation Then merged… Created one feature class for flood risk study and planning Who helped us: CSEC/Geo-Comm: 213 counties, ~3 million addresses Texas 9-1-1 Alliance & EGRT: 41 counties, ~6.2 million addresses Totals: 254 counties, ~9.2 million addresses
all on the same basis • road centerline address vs. physical structure location vs. parcel • Jurisdictional overlaps result in some addresses duplicated, with different locations, density and attributes • City vs. appraisal district vs. ECD • Errors of missing or incorrect data • Some cities’ addresses are not reported with their county or COG • County name, community name, address location • Numerous different county/region address schemas • Keeping pace with rapid growth of Texas population • 400,000 people moved here July 2015-July 2016 • 1.3 million people moved here since 2010 • San Antonio Current, Dec 20, 2016, sacurrent.com
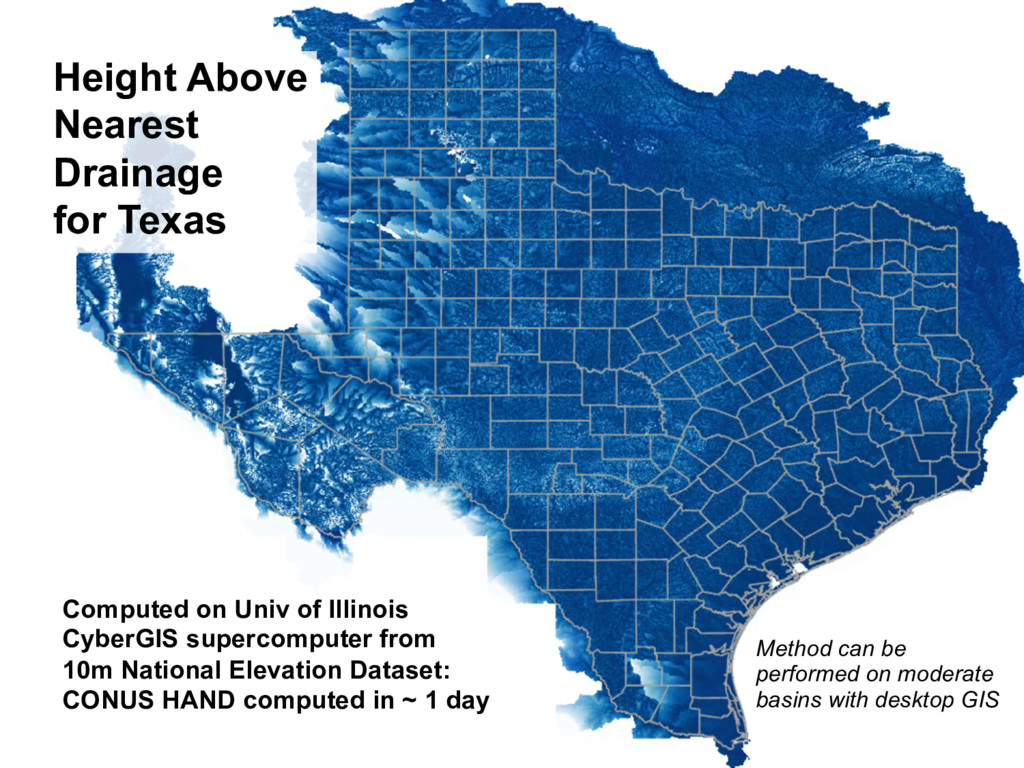
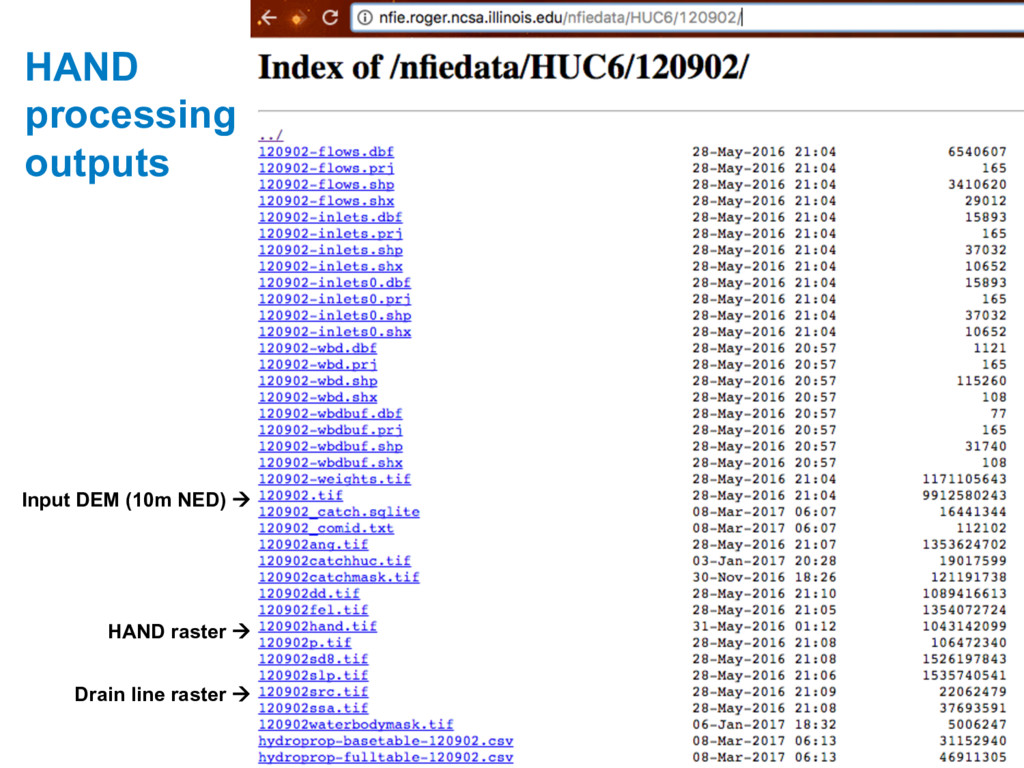
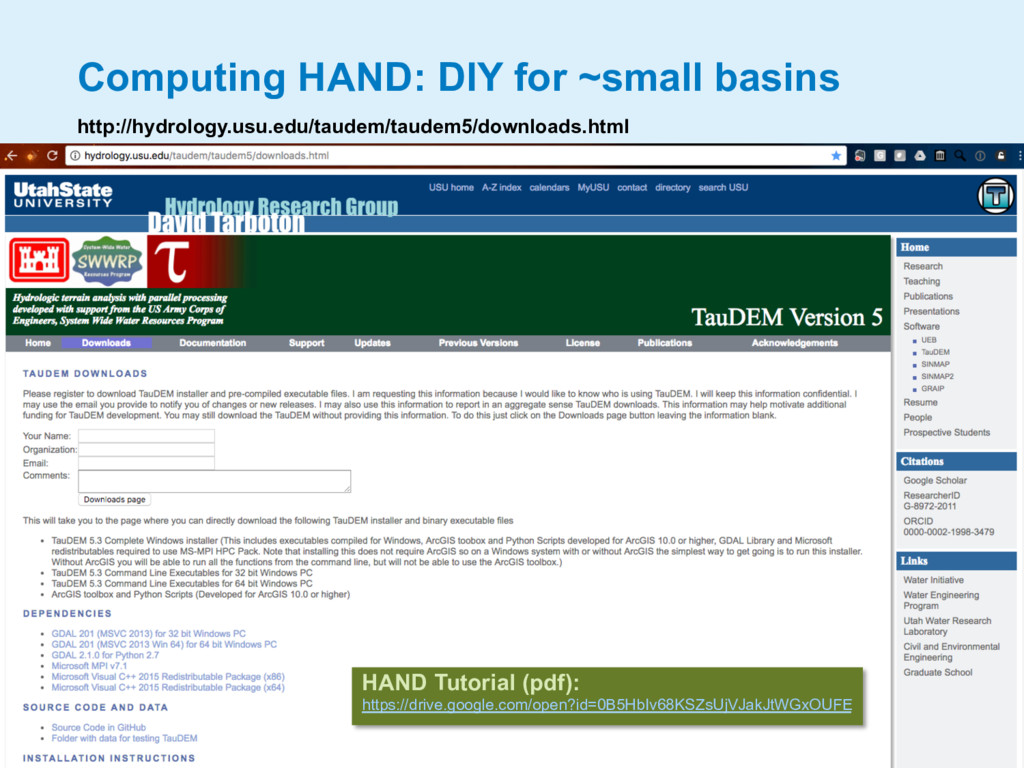
Illinois CyberGIS supercomputer from 10m National Elevation Dataset: CONUS HAND computed in ~ 1 day Method can be performed on moderate basins with desktop GIS
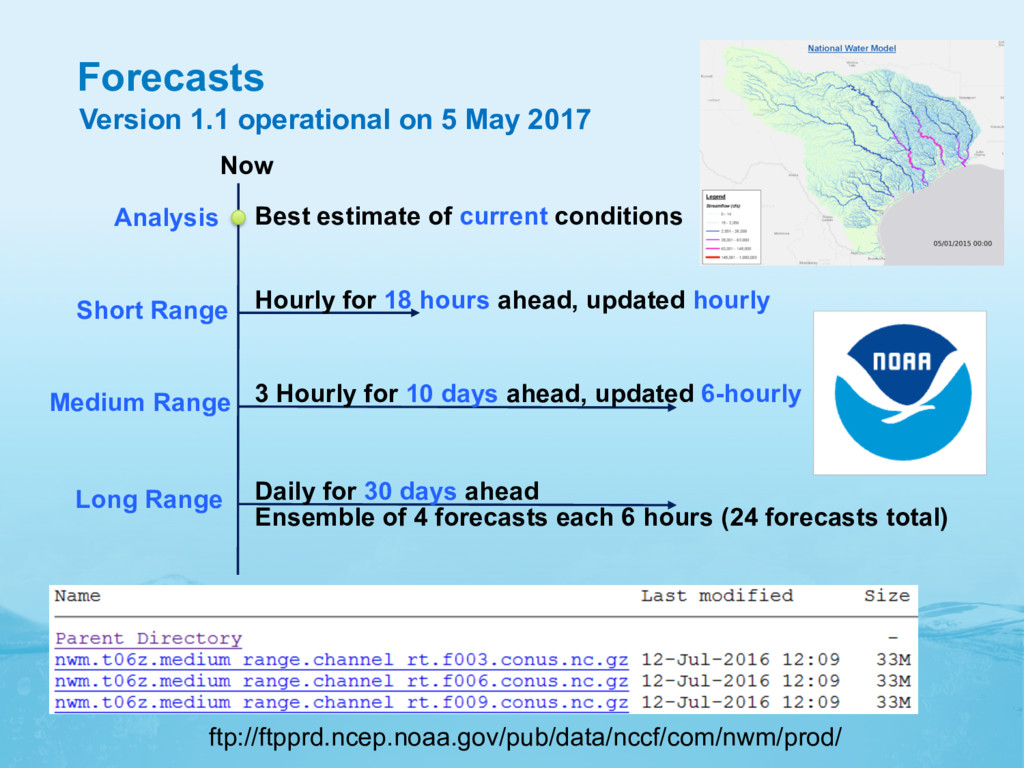
Hourly for 18 hours ahead, updated hourly Medium Range 3 Hourly for 10 days ahead, updated 6-hourly Long Range Daily for 30 days ahead Ensemble of 4 forecasts each 6 hours (24 forecasts total) ftp://ftpprd.ncep.noaa.gov/pub/data/nccf/com/nwm/prod/ Version 1.1 operational on 5 May 2017
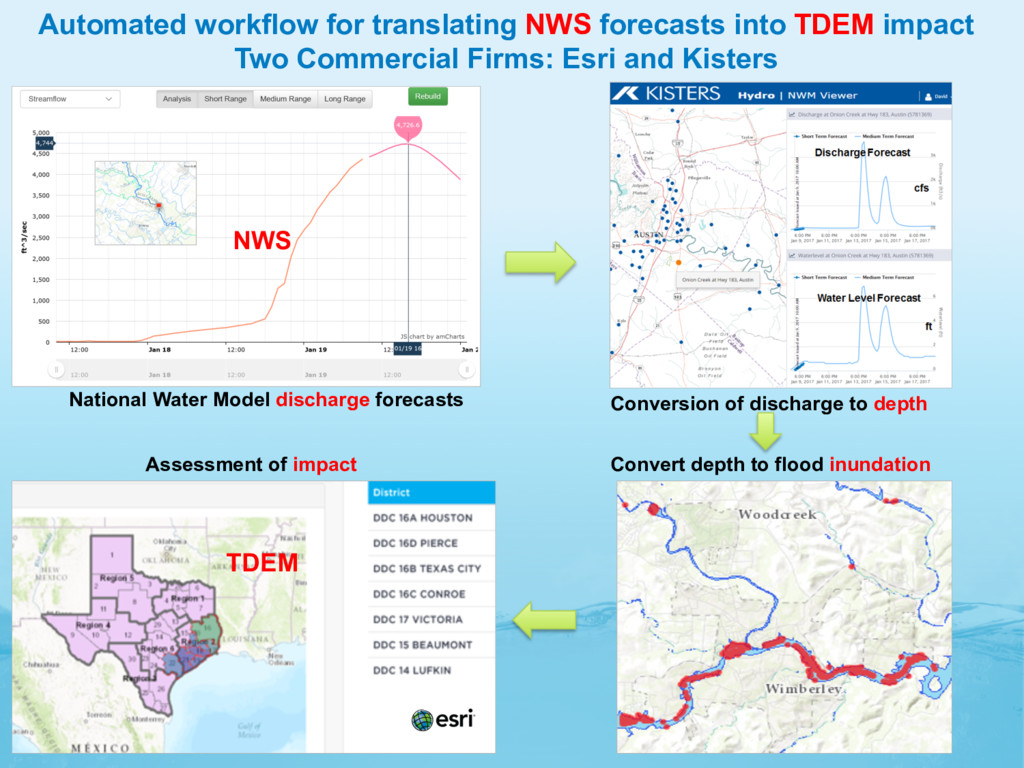
Commercial Firms: Esri and Kisters Assessment of impact Convert depth to flood inundation National Water Model discharge forecasts Conversion of discharge to depth NWS TDEM
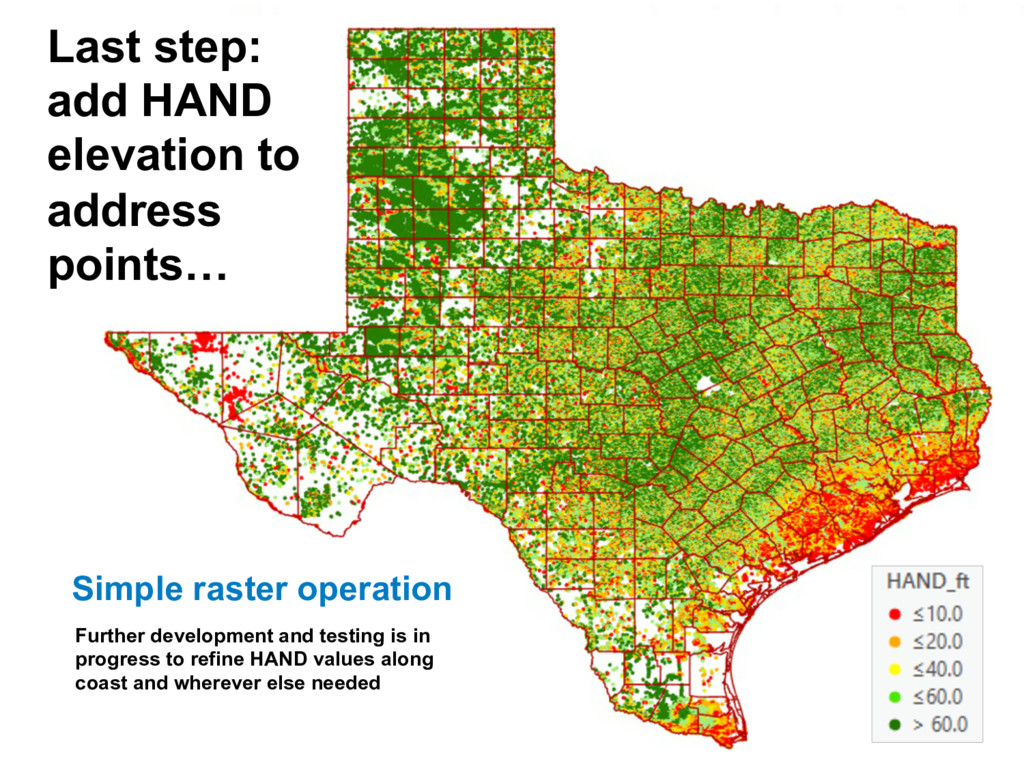
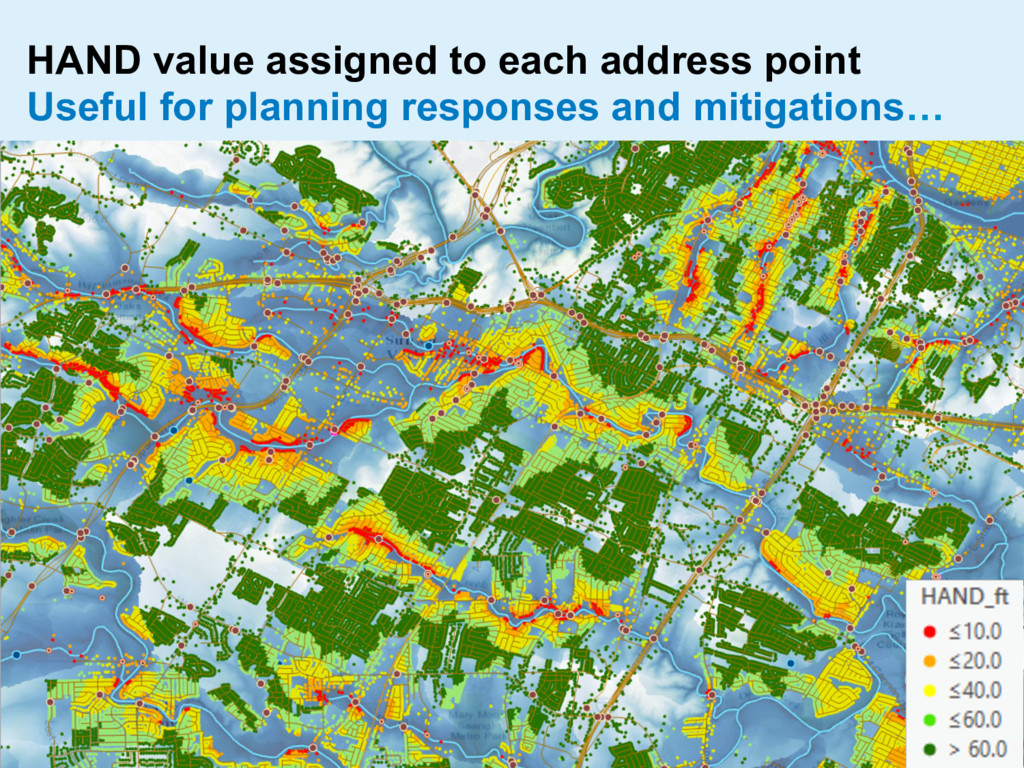
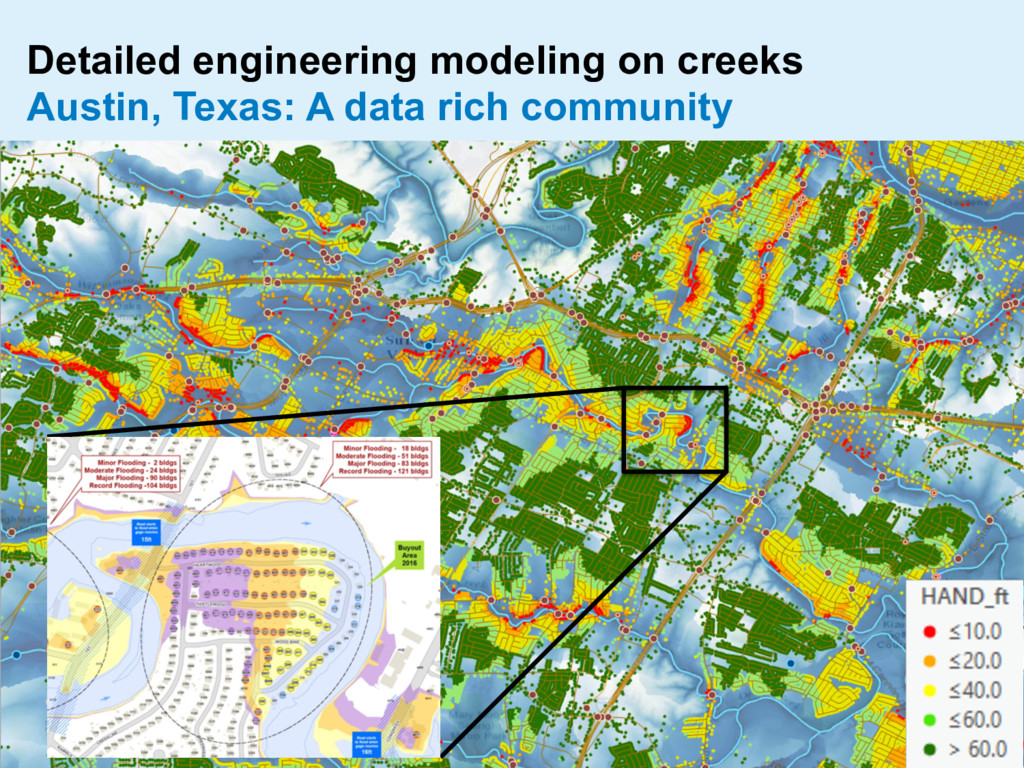
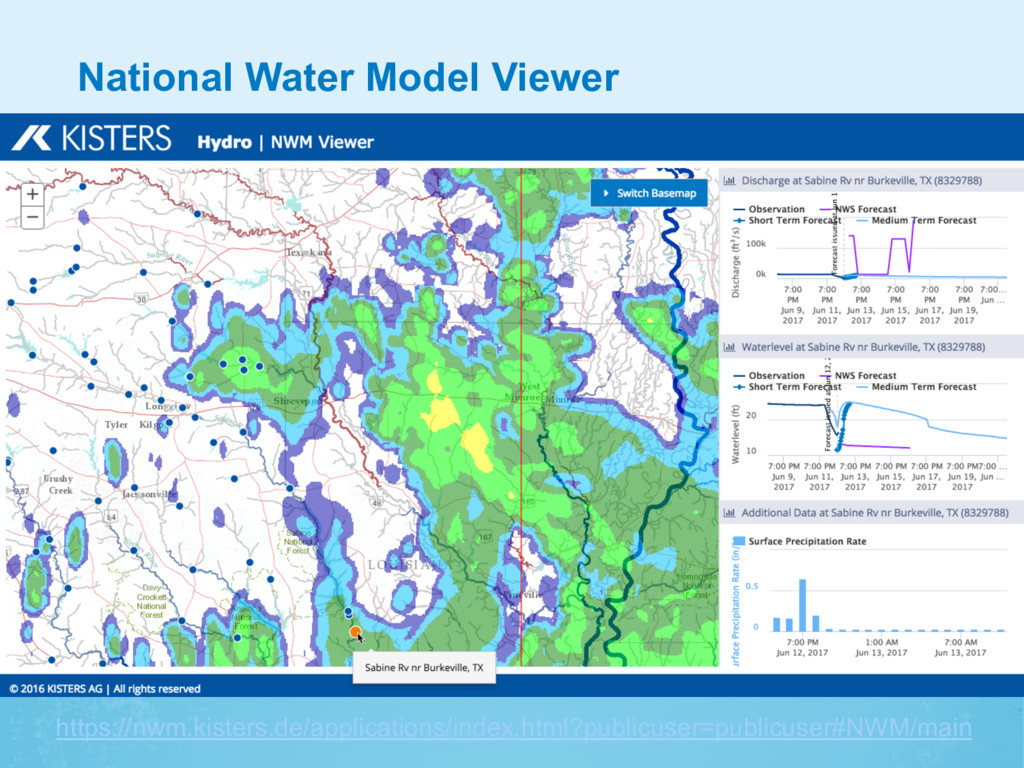
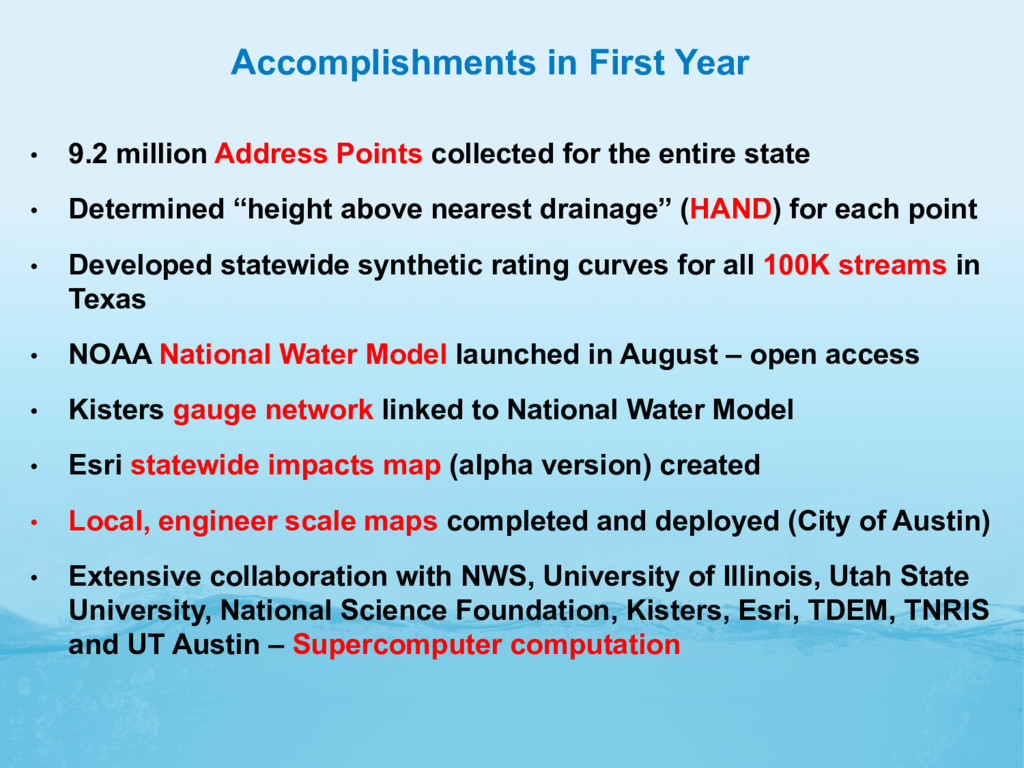
for the entire state • Determined “height above nearest drainage” (HAND) for each point • Developed statewide synthetic rating curves for all 100K streams in Texas • NOAA National Water Model launched in August – open access • Kisters gauge network linked to National Water Model • Esri statewide impacts map (alpha version) created • Local, engineer scale maps completed and deployed (City of Austin) • Extensive collaboration with NWS, University of Illinois, Utah State University, National Science Foundation, Kisters, Esri, TDEM, TNRIS and UT Austin – Supercomputer computation
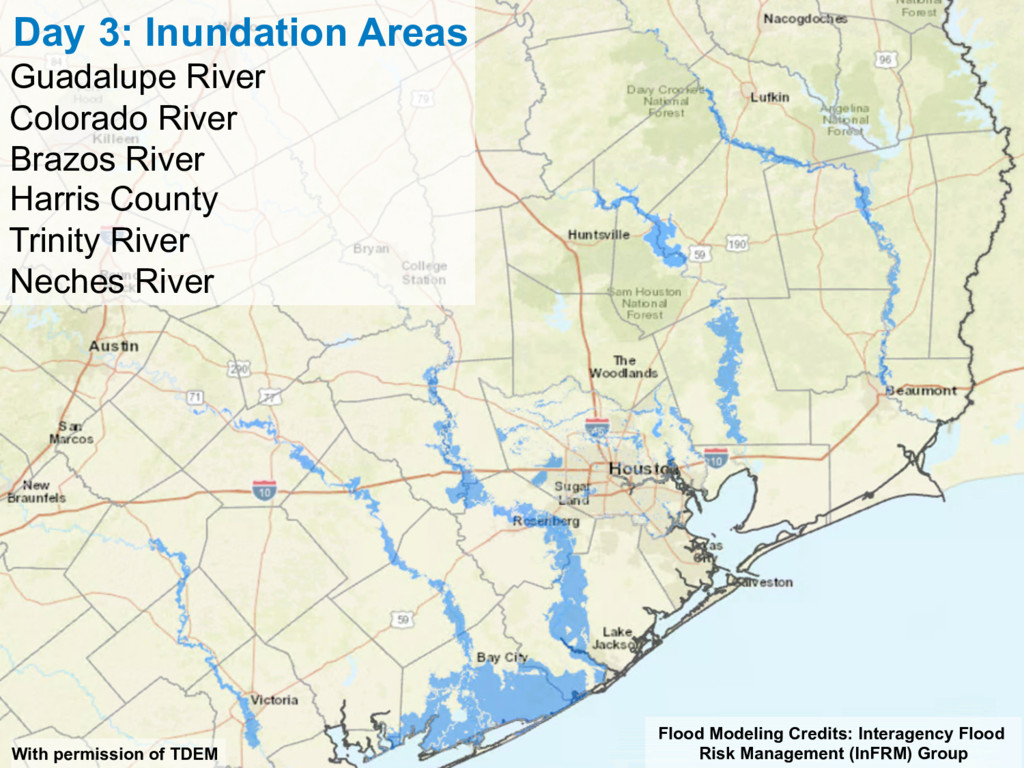
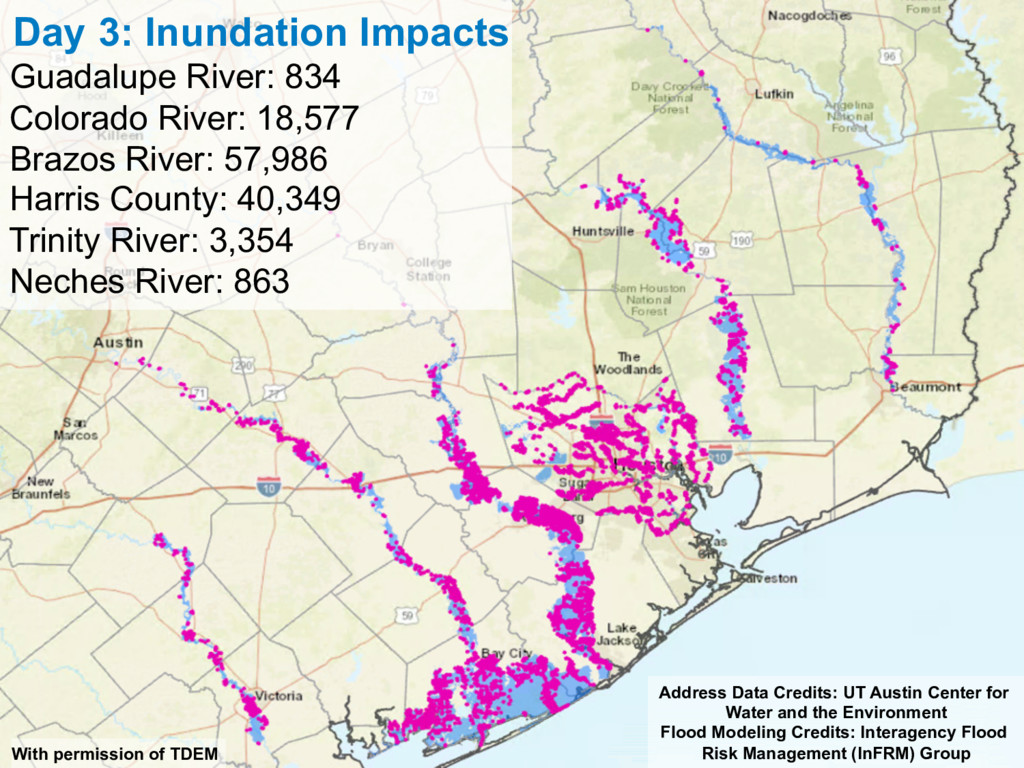
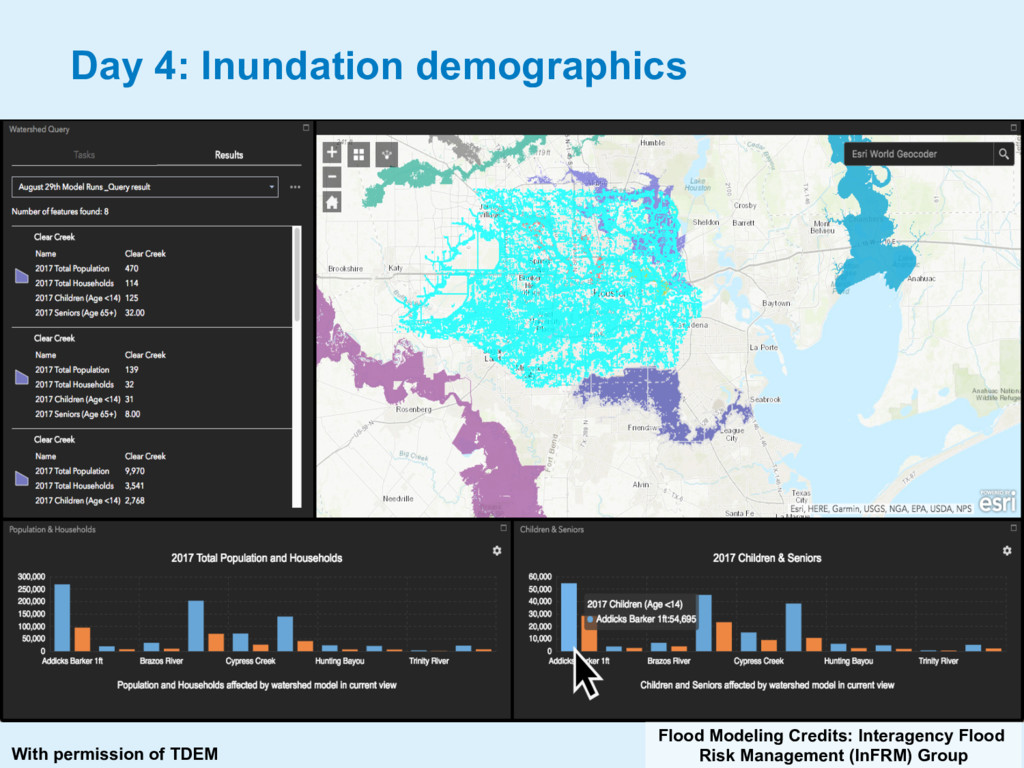
Brazos River: 57,986 Harris County: 40,349 Trinity River: 3,354 Neches River: 863 Address Data Credits: UT Austin Center for Water and the Environment Flood Modeling Credits: Interagency Flood Risk Management (InFRM) Group With permission of TDEM
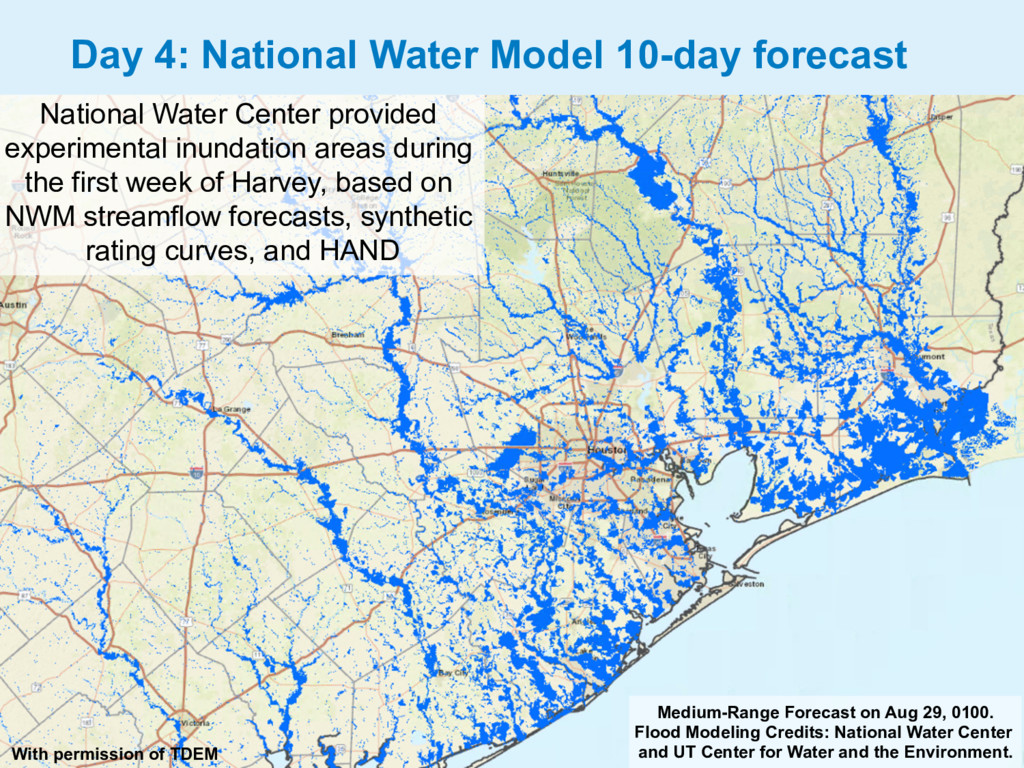
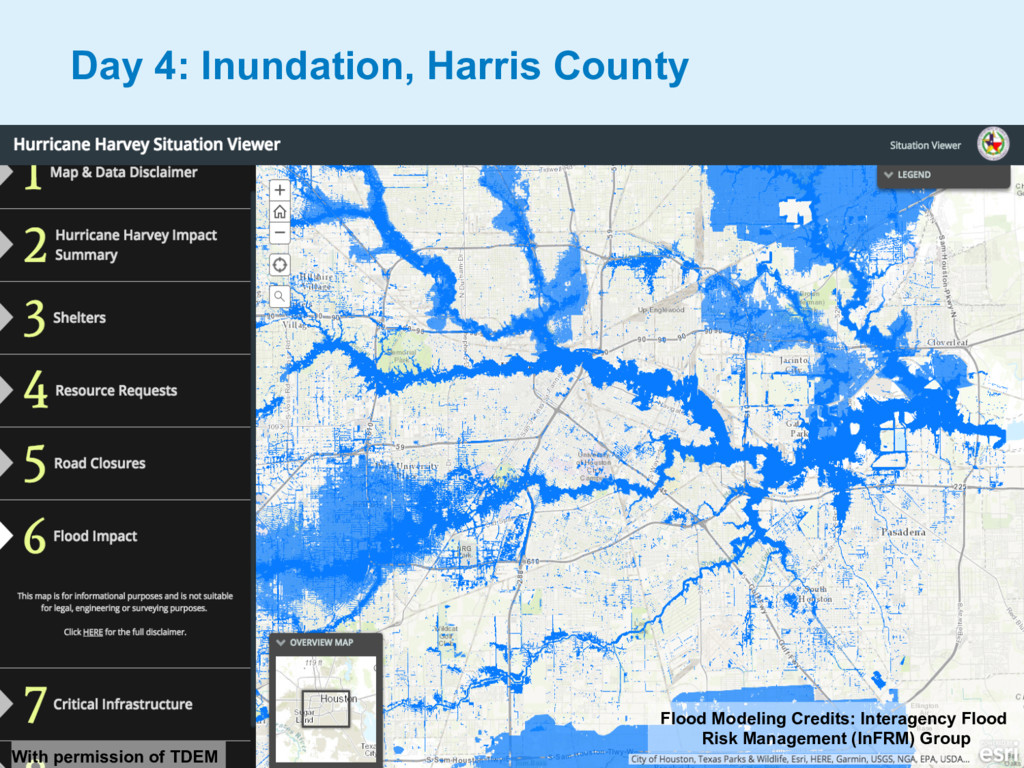
Water Center and UT Center for Water and the Environment. Day 4: National Water Model 10-day forecast With permission of TDEM National Water Center provided experimental inundation areas during the first week of Harvey, based on NWM streamflow forecasts, synthetic rating curves, and HAND
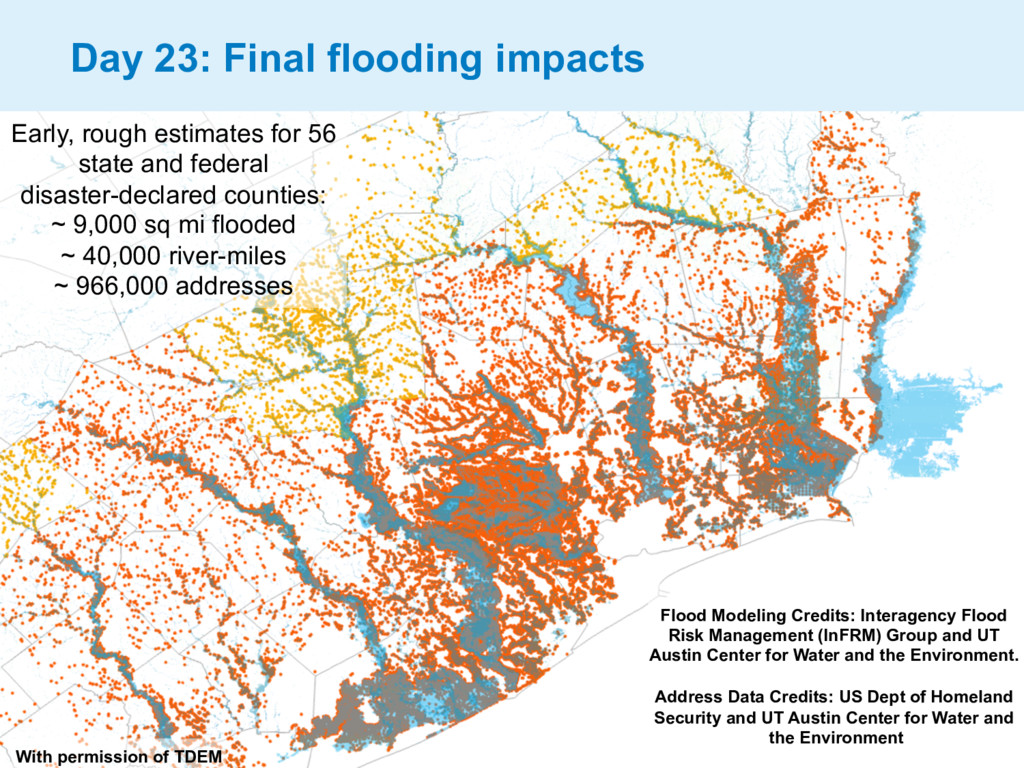
state and federal disaster-declared counties: ~ 9,000 sq mi flooded ~ 40,000 river-miles ~ 966,000 addresses Flood Modeling Credits: Interagency Flood Risk Management (InFRM) Group and UT Austin Center for Water and the Environment. Address Data Credits: US Dept of Homeland Security and UT Austin Center for Water and the Environment With permission of TDEM
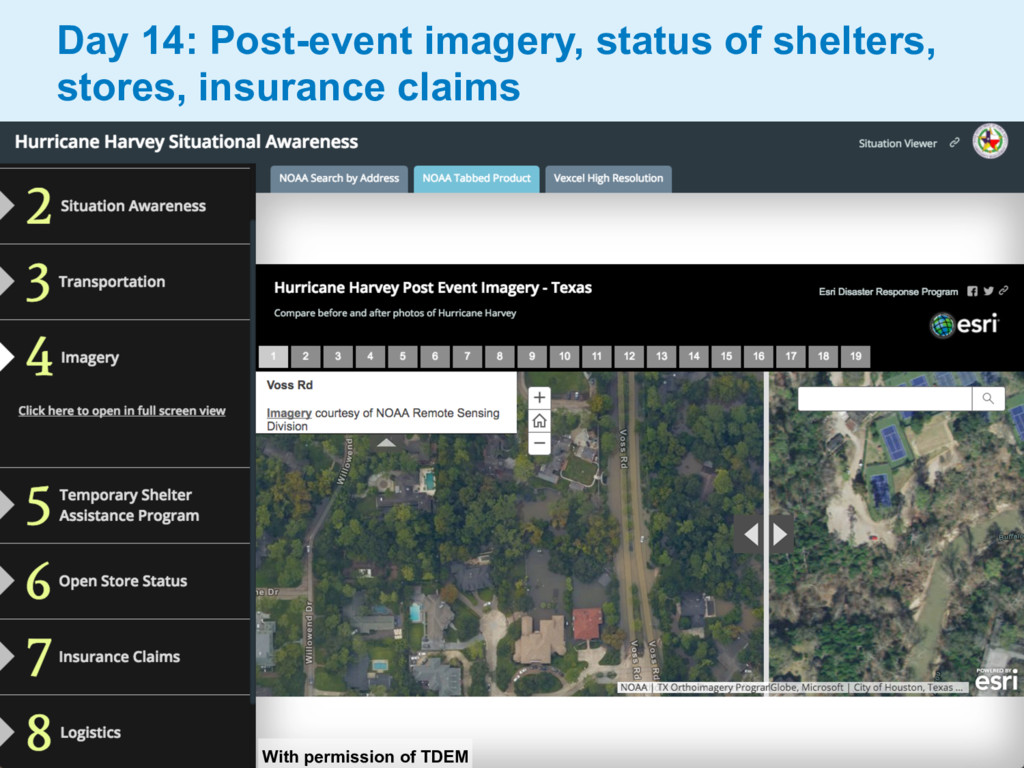
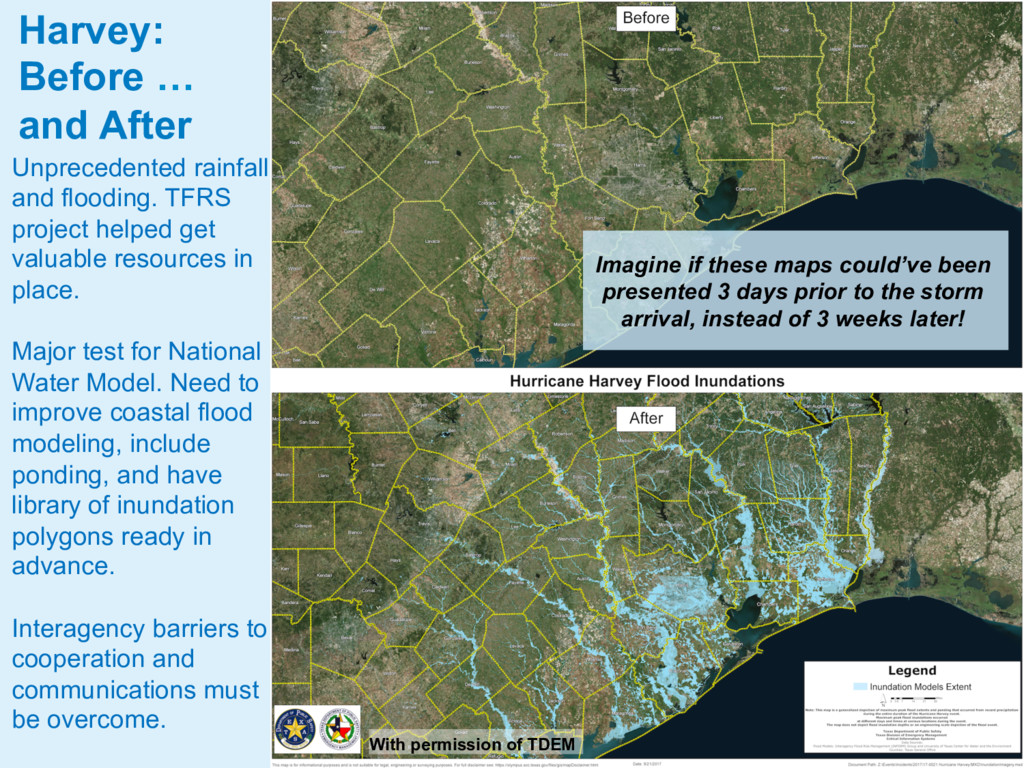
in place. Major test for National Water Model. Need to improve coastal flood modeling, include ponding, and have library of inundation polygons ready in advance. Interagency barriers to cooperation and communications must be overcome. Harvey: Before … and After With permission of TDEM Imagine if these maps could’ve been presented 3 days prior to the storm arrival, instead of 3 weeks later!
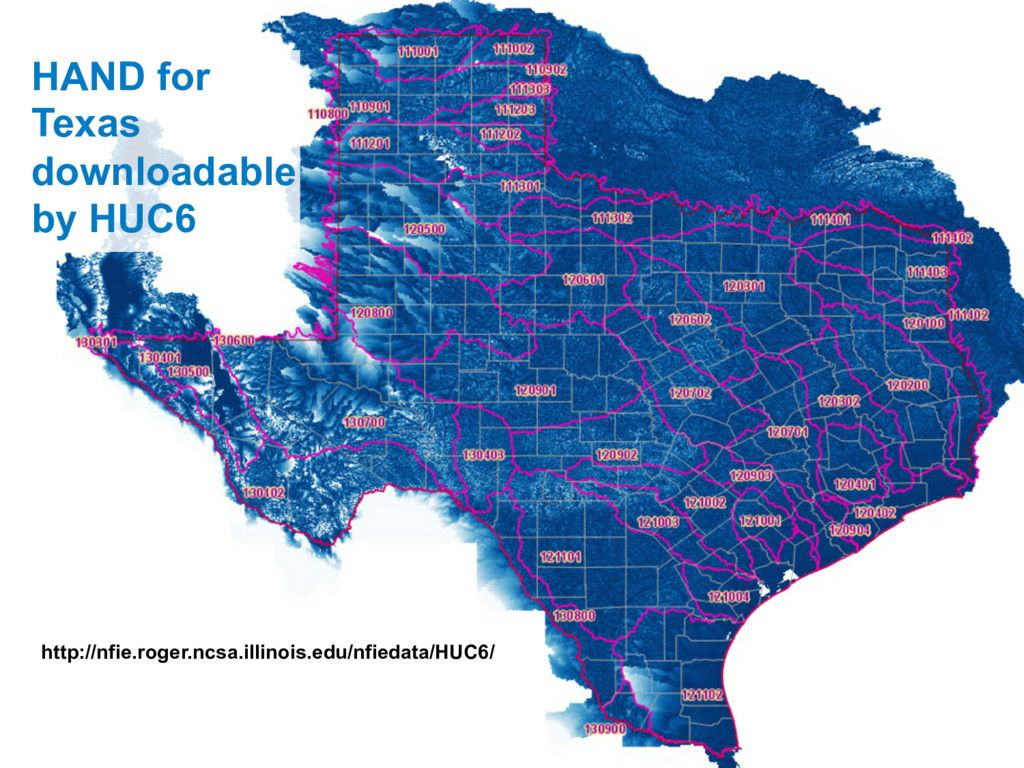
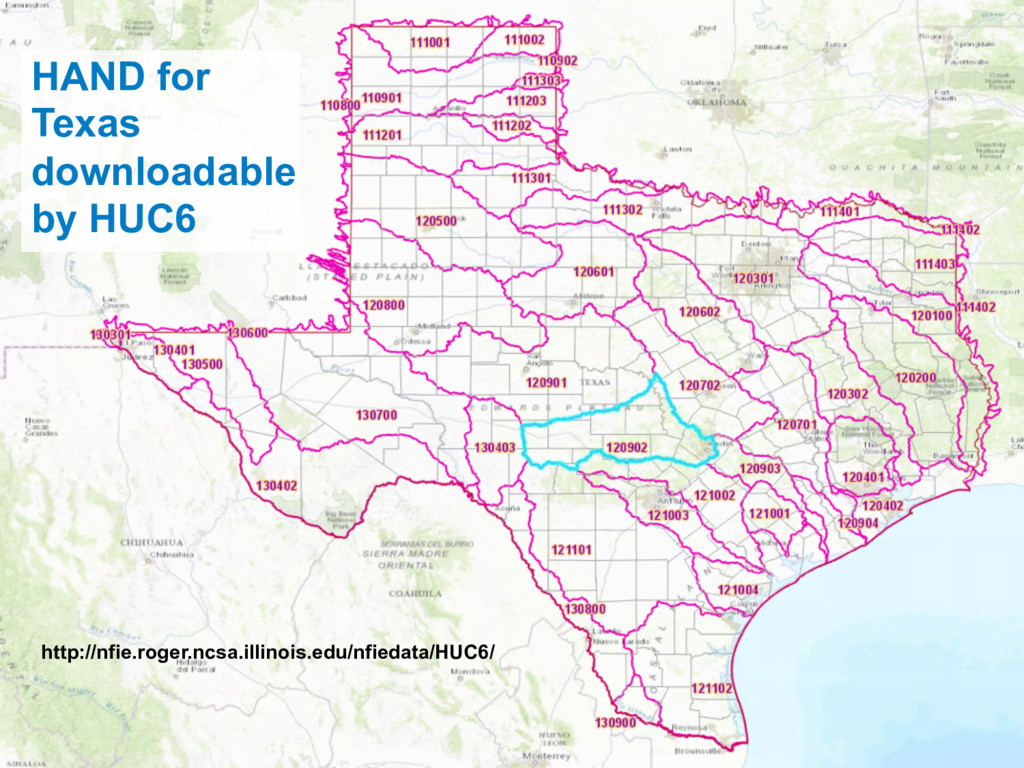
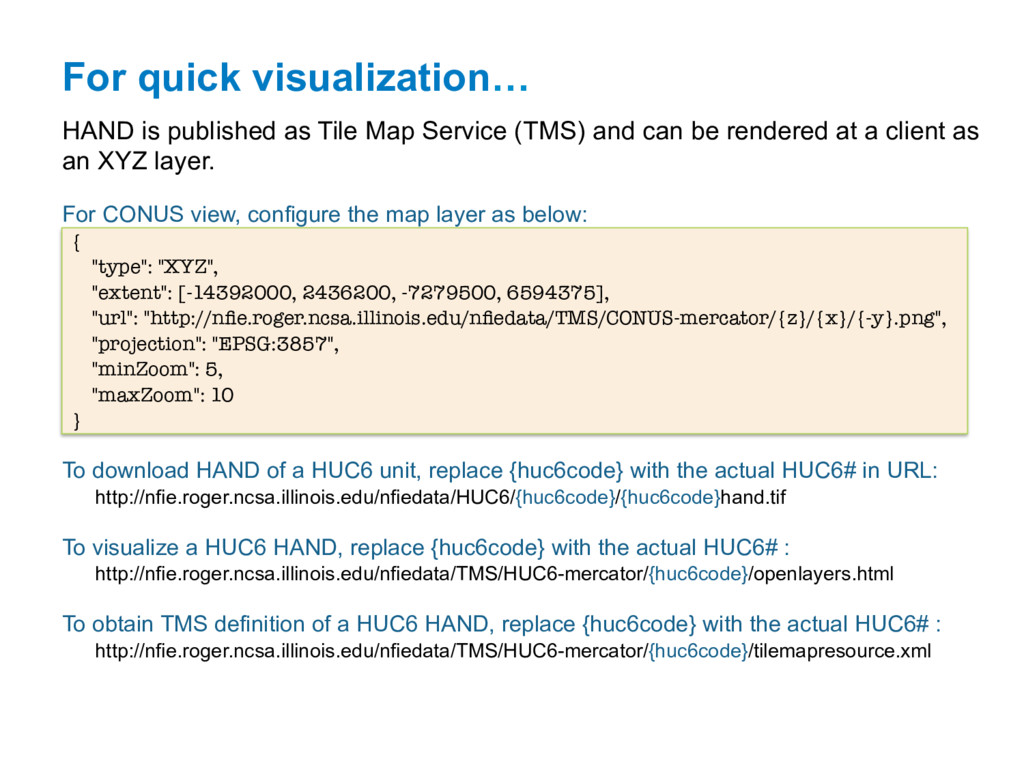
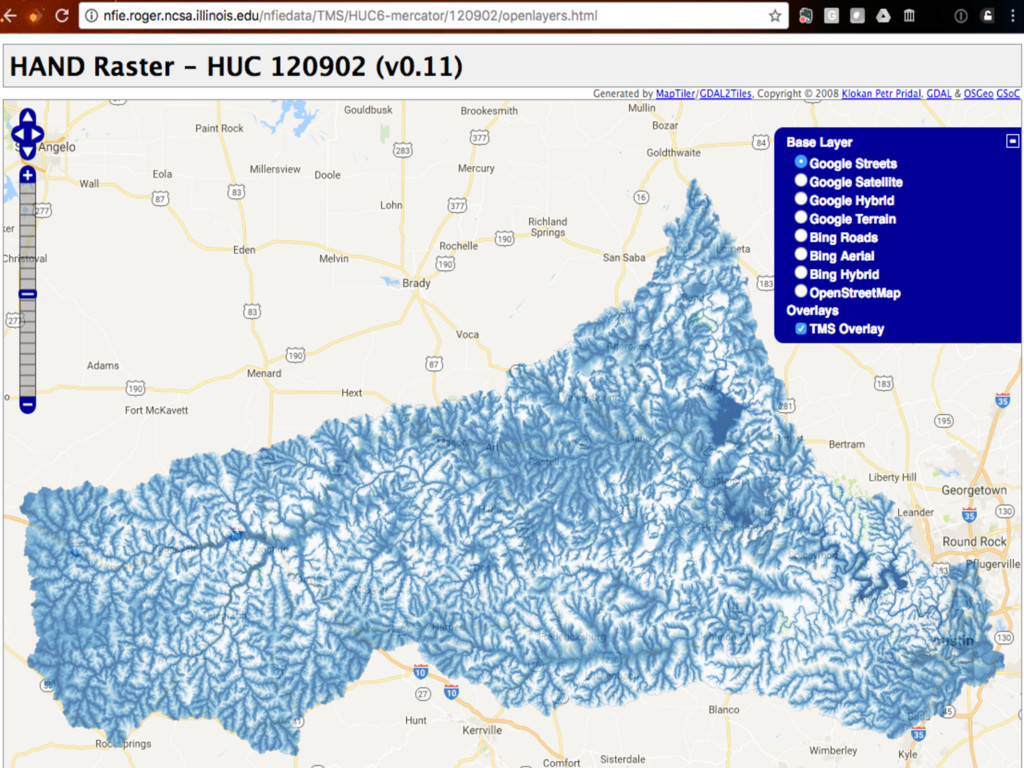
(TMS) and can be rendered at a client as an XYZ layer. For CONUS view, configure the map layer as below: { "type": "XYZ", "extent": [-14392000, 2436200, -7279500, 6594375], "url": "http://nfie.roger.ncsa.illinois.edu/nfiedata/TMS/CONUS-mercator/{z}/{x}/{-y}.png", "projection": "EPSG:3857", "minZoom": 5, "maxZoom": 10 } To download HAND of a HUC6 unit, replace {huc6code} with the actual HUC6# in URL: http://nfie.roger.ncsa.illinois.edu/nfiedata/HUC6/{huc6code}/{huc6code}hand.tif To visualize a HUC6 HAND, replace {huc6code} with the actual HUC6# : http://nfie.roger.ncsa.illinois.edu/nfiedata/TMS/HUC6-mercator/{huc6code}/openlayers.html To obtain TMS definition of a HUC6 HAND, replace {huc6code} with the actual HUC6# : http://nfie.roger.ncsa.illinois.edu/nfiedata/TMS/HUC6-mercator/{huc6code}/tilemapresource.xml
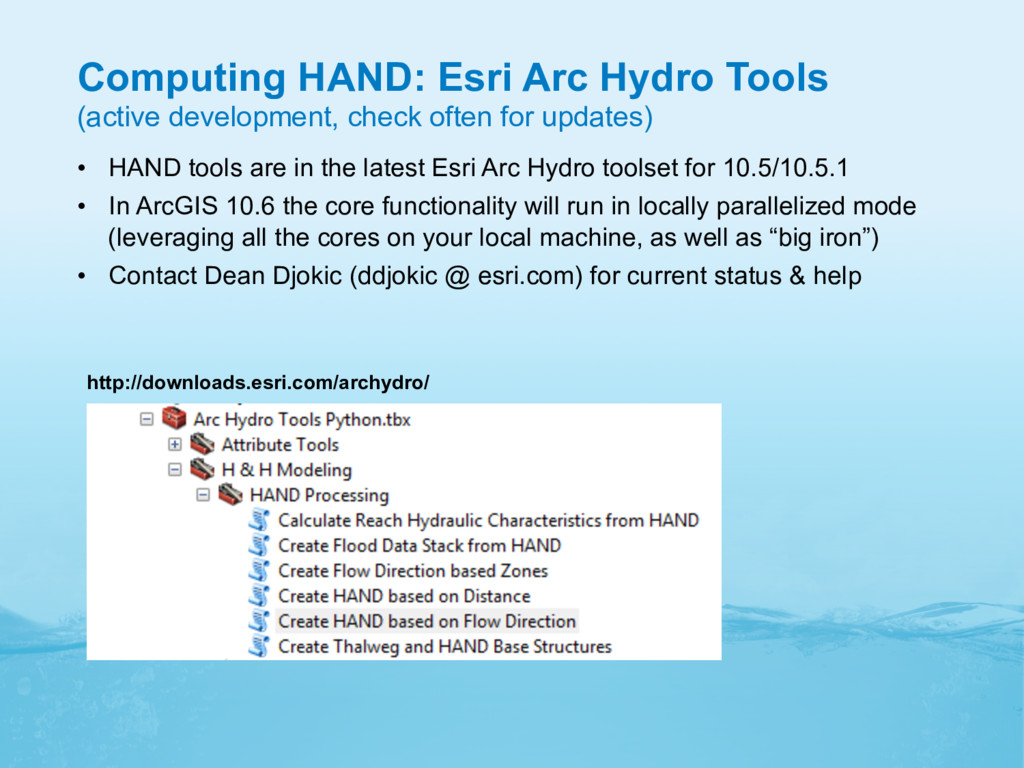
for updates) http://downloads.esri.com/archydro/ • HAND tools are in the latest Esri Arc Hydro toolset for 10.5/10.5.1 • In ArcGIS 10.6 the core functionality will run in locally parallelized mode (leveraging all the cores on your local machine, as well as “big iron”) • Contact Dean Djokic (ddjokic @ esri.com) for current status & help