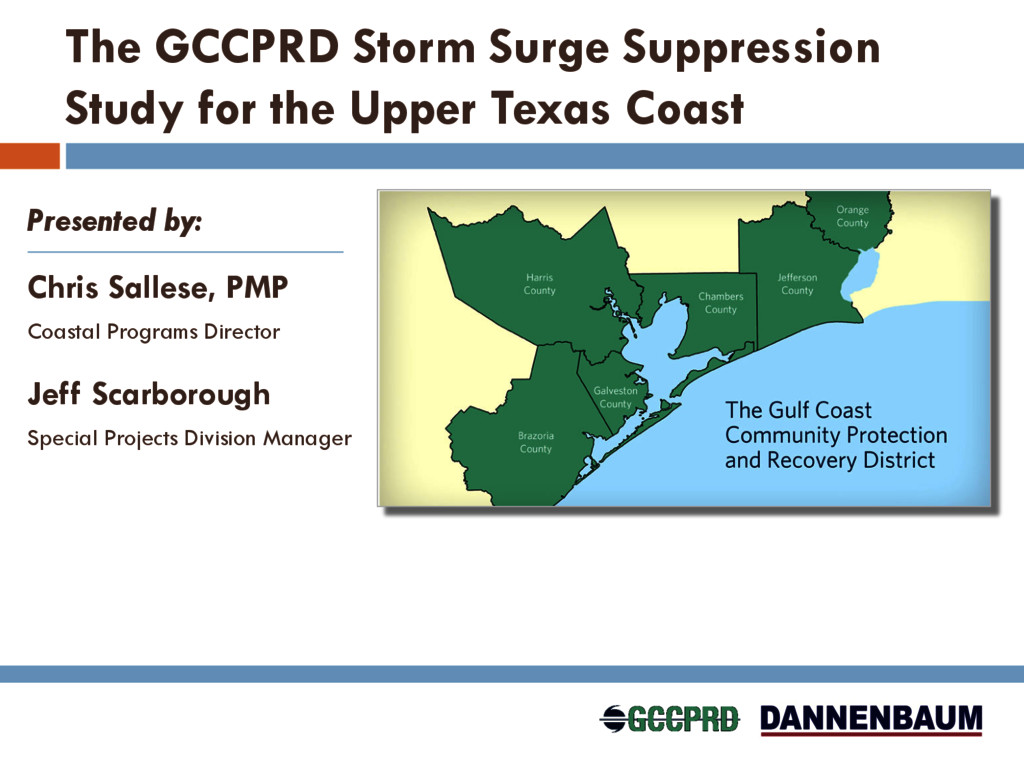
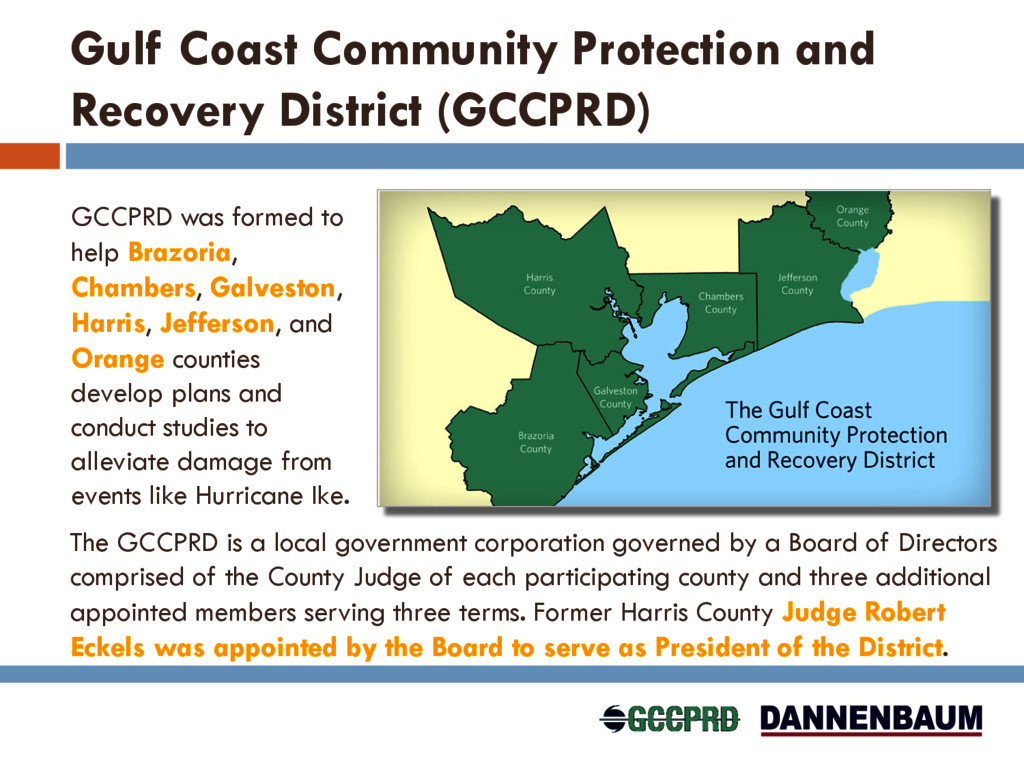
formed to help Brazoria, Chambers, Galveston, Harris, Jefferson, and Orange counties develop plans and conduct studies to alleviate damage from events like Hurricane Ike. The GCCPRD is a local government corporation governed by a Board of Directors comprised of the County Judge of each participating county and three additional appointed members serving three terms. Former Harris County Judge Robert Eckels was appointed by the Board to serve as President of the District.
within the region through a technical analysis of potential alternatives. ¨ What is the threat? ¨ What needs to be protected? ¨ How will protect? ¨ How do we finance the final project?
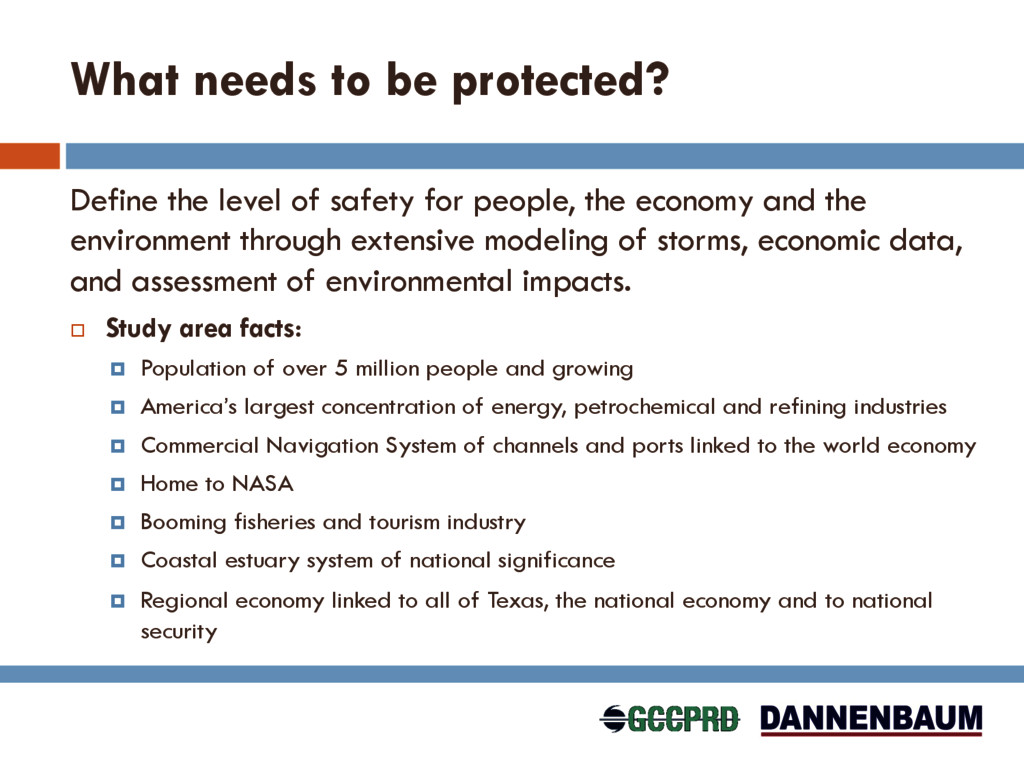
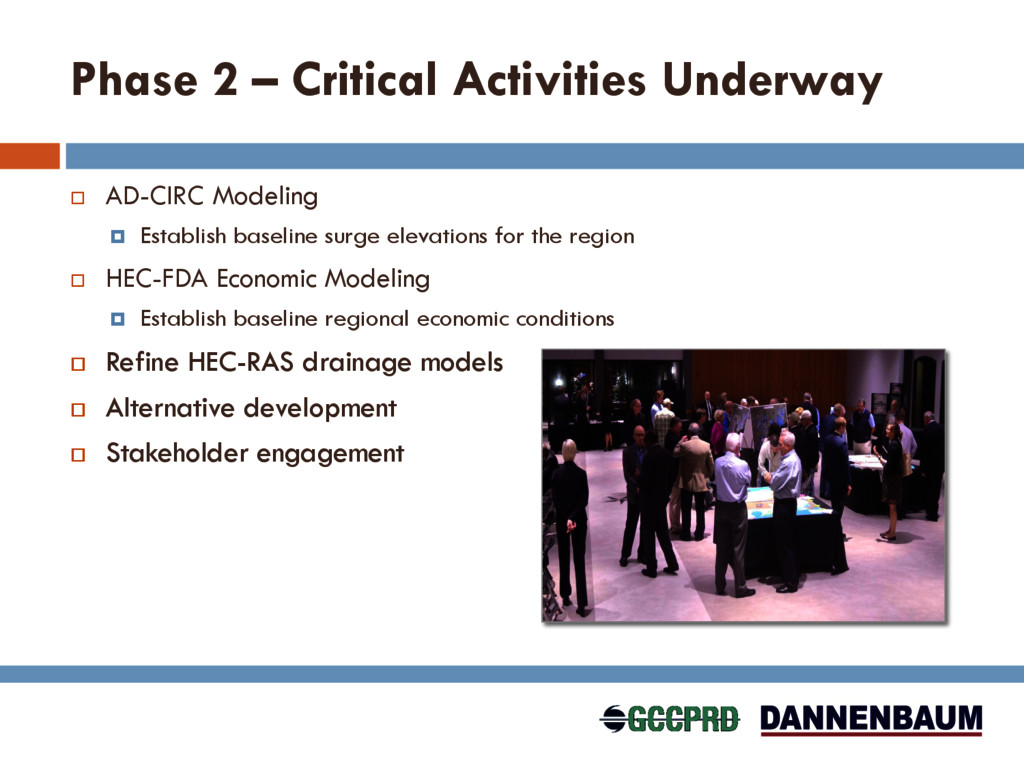
for people, the economy and the environment through extensive modeling of storms, economic data, and assessment of environmental impacts. ¨ Study area facts: ¤ Population of over 5 million people and growing ¤ America’s largest concentration of energy, petrochemical and refining industries ¤ Commercial Navigation System of channels and ports linked to the world economy ¤ Home to NASA ¤ Booming fisheries and tourism industry ¤ Coastal estuary system of national significance ¤ Regional economy linked to all of Texas, the national economy and to national security
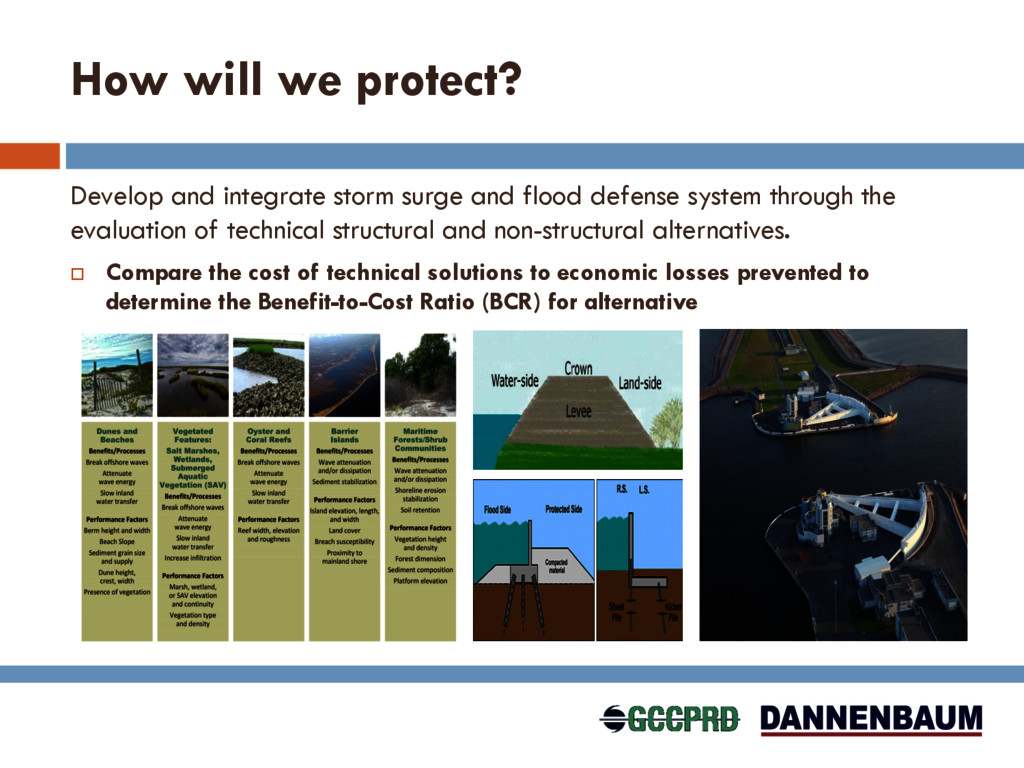
flood defense system through the evaluation of technical structural and non-structural alternatives. ¨ Compare the cost of technical solutions to economic losses prevented to determine the Benefit-to-Cost Ratio (BCR) for alternative
Traditional path to project authorization and appropriation (costs share 65-35) ¨ Seek special legislation… New Orleans State Funds: ¨ General revenue ¨ Special taxing districts ¨ Revenue bonds ¨ Private investment ¨ Public-Private Partnership
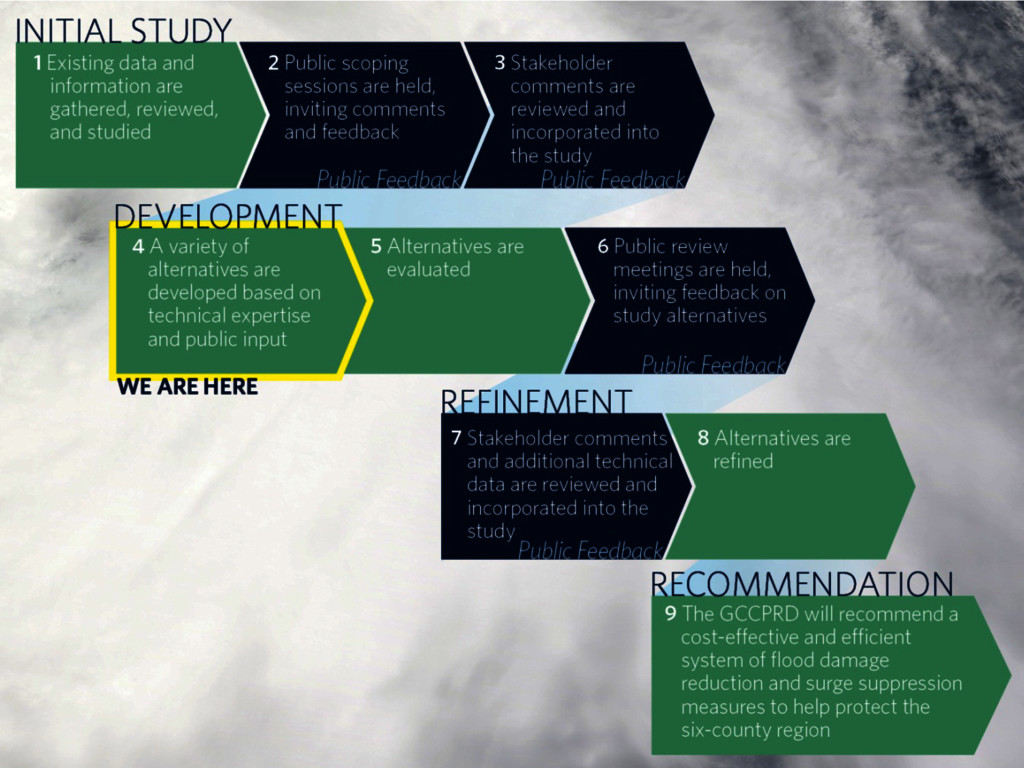
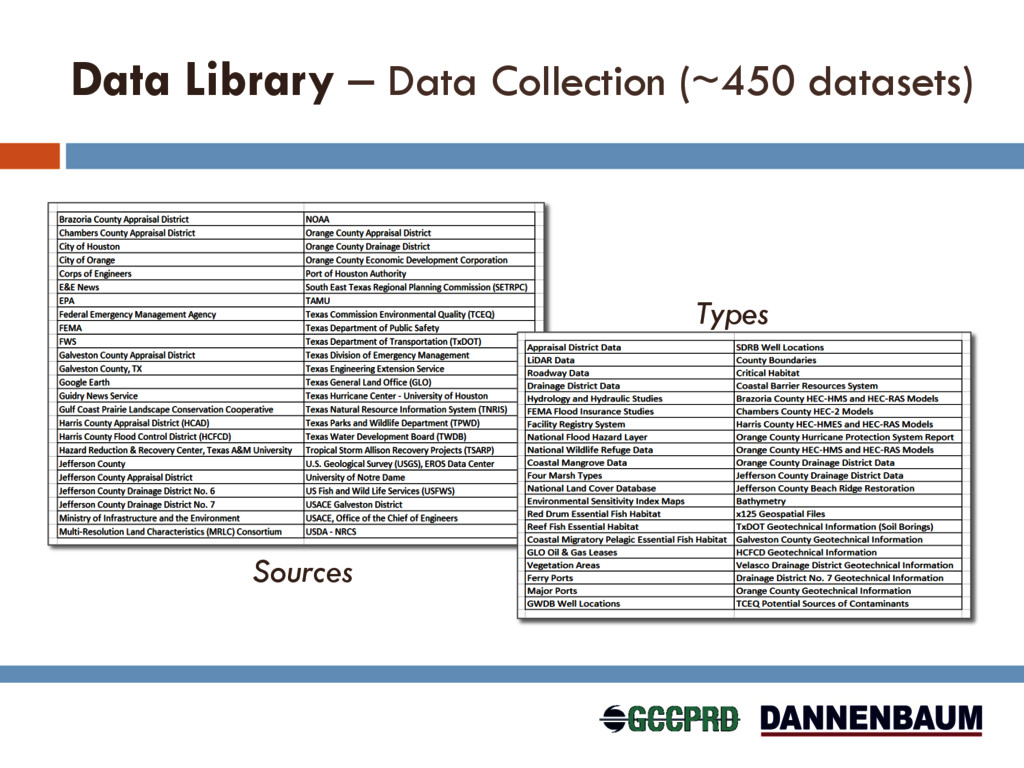
and Need for the surge protection ¨ Reviewed existing data and technical alternatives ¨ Assembled the Data Library… Readied to pass to GLO ¨ Reviewed similar international projects and structures ¨ Developed alternative screening criteria ¤ Alternatives must reduce risk and impacts associated with surge and coastal flooding to: n People n Infrastructure n Environment n Regional and National Economy ¤ Alternatives must be in compliance with Local, State and Federal regulations
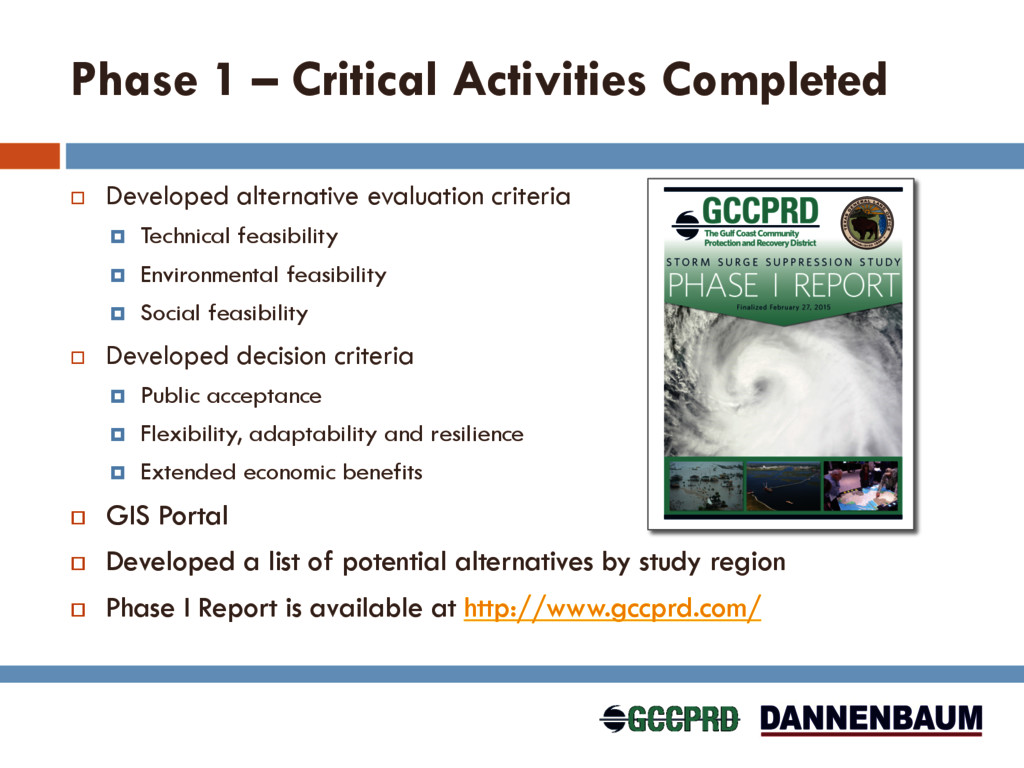
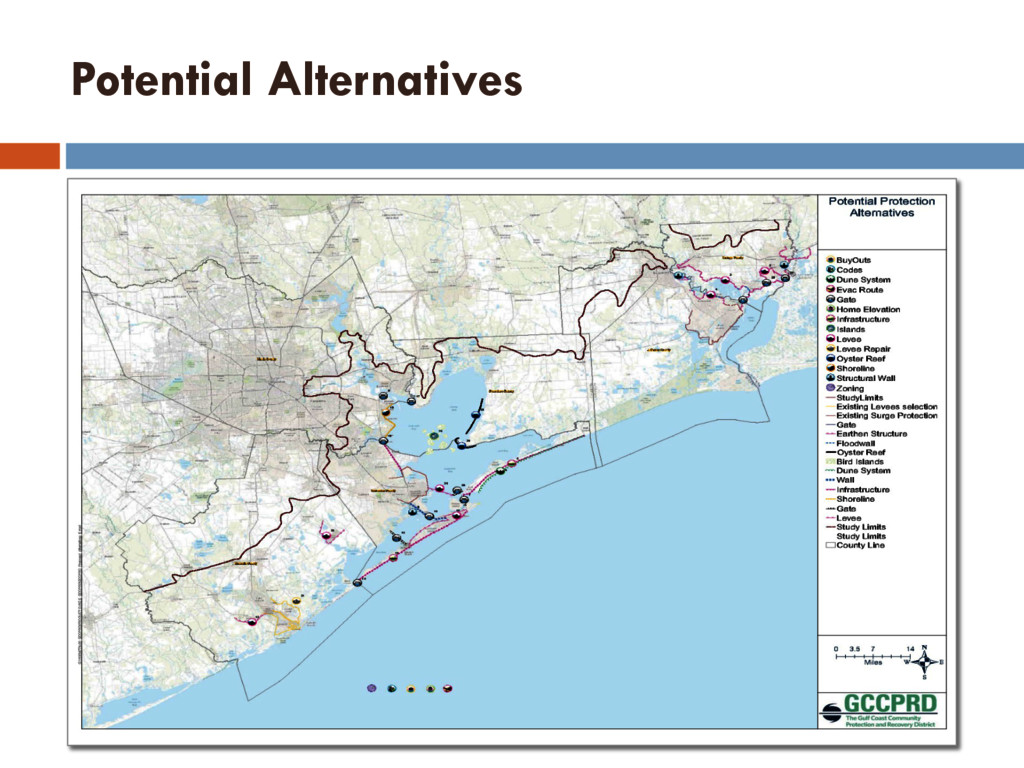
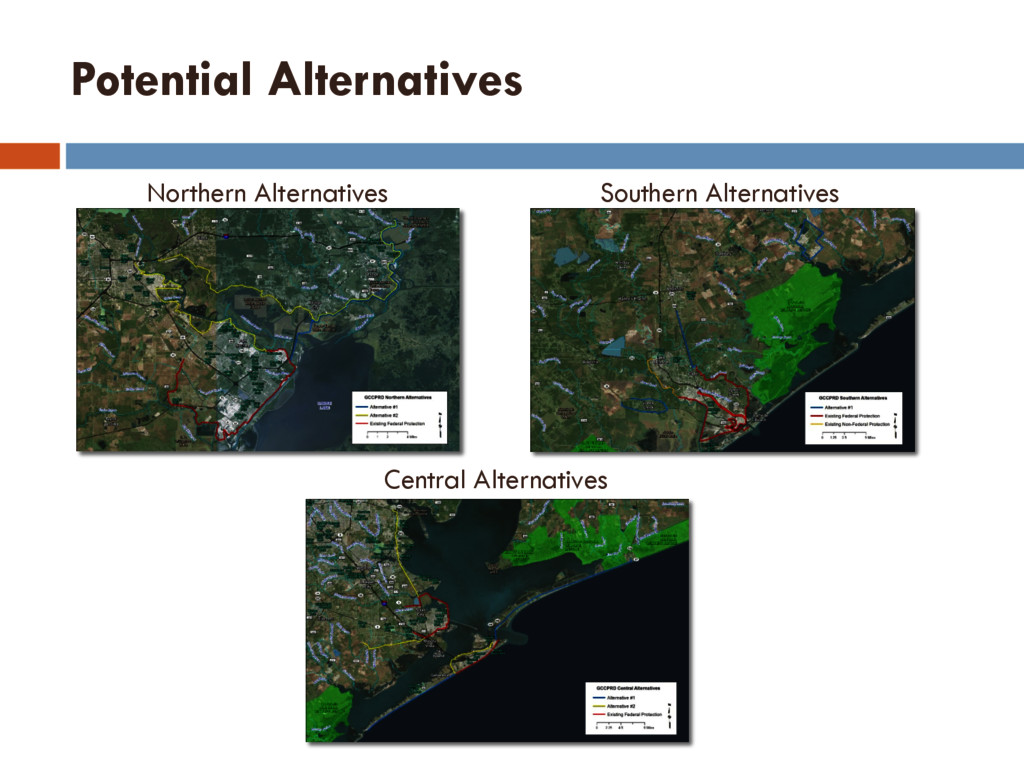
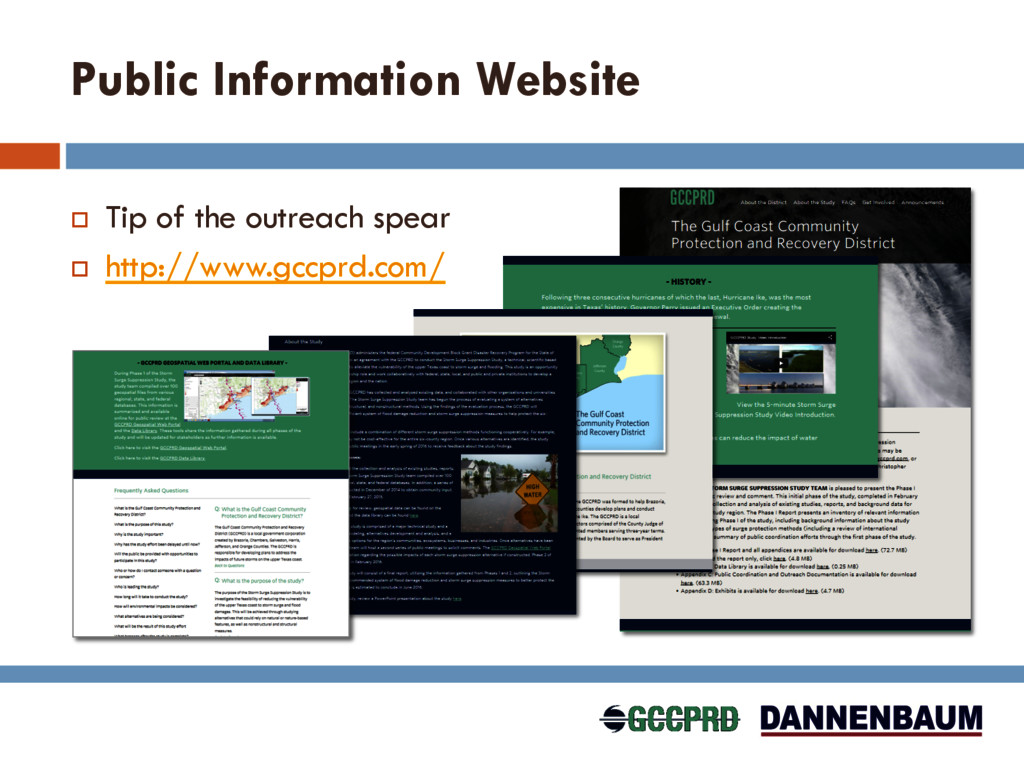
criteria ¤ Technical feasibility ¤ Environmental feasibility ¤ Social feasibility ¨ Developed decision criteria ¤ Public acceptance ¤ Flexibility, adaptability and resilience ¤ Extended economic benefits ¨ GIS Portal ¨ Developed a list of potential alternatives by study region ¨ Phase I Report is available at http://www.gccprd.com/
sound technical and economic analysis that creates an integrated protection system that reduces risk to the public, the economy and the environment within the six-county study region.
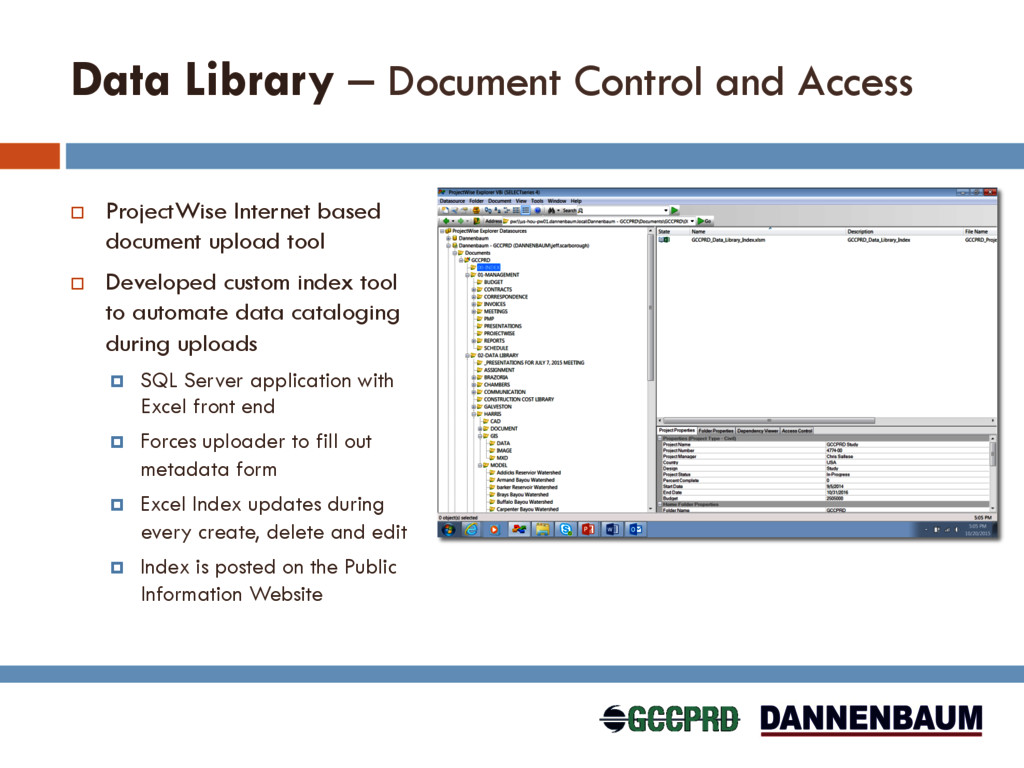
based document upload tool ¨ Developed custom index tool to automate data cataloging during uploads ¤ SQL Server application with Excel front end ¤ Forces uploader to fill out metadata form ¤ Excel Index updates during every create, delete and edit ¤ Index is posted on the Public Information Website
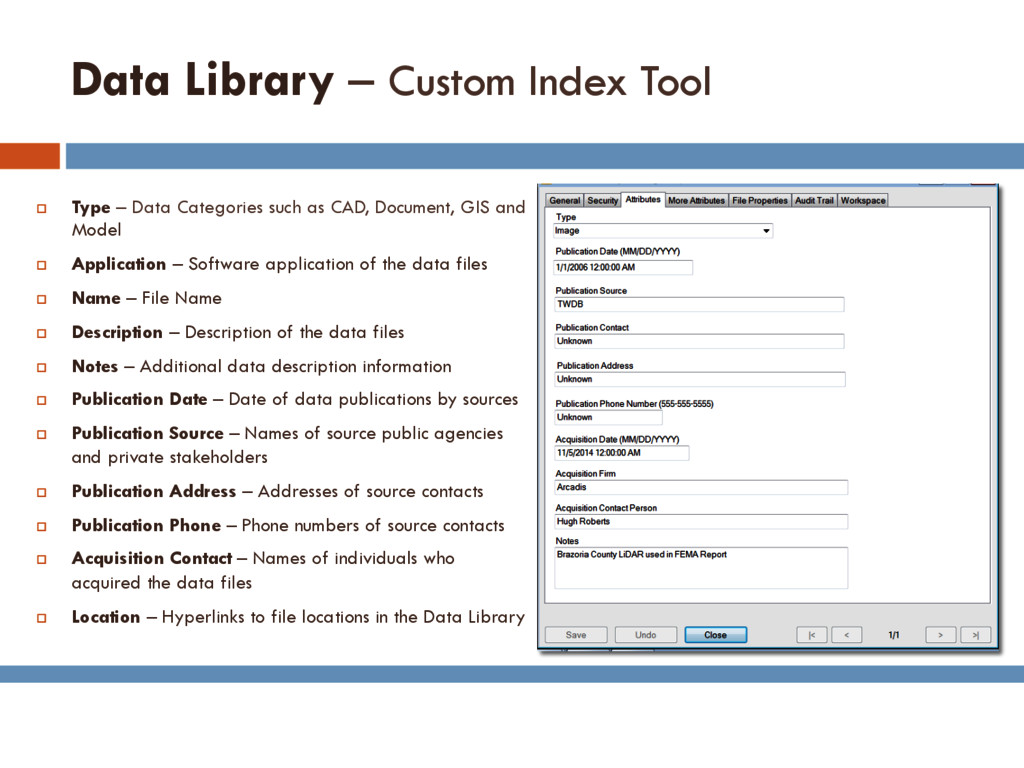
Categories such as CAD, Document, GIS and Model ¨ Application – Software application of the data files ¨ Name – File Name ¨ Description – Description of the data files ¨ Notes – Additional data description information ¨ Publication Date – Date of data publications by sources ¨ Publication Source – Names of source public agencies and private stakeholders ¨ Publication Address – Addresses of source contacts ¨ Publication Phone – Phone numbers of source contacts ¨ Acquisition Contact – Names of individuals who acquired the data files ¨ Location – Hyperlinks to file locations in the Data Library
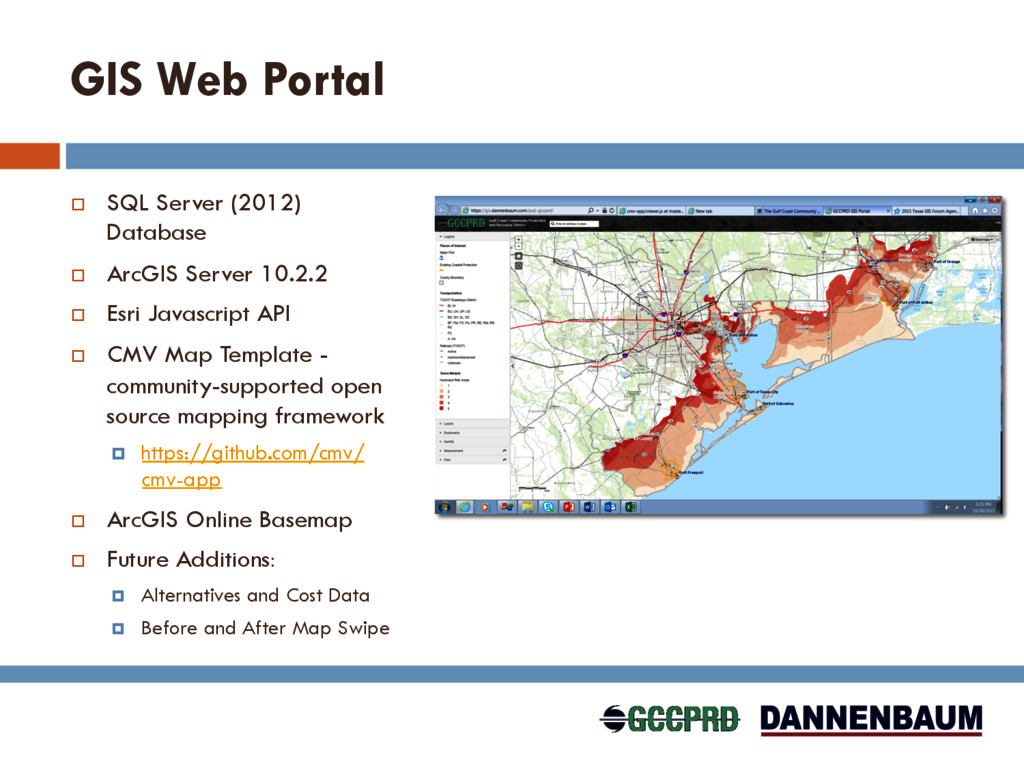
Server 10.2.2 ¨ Esri Javascript API ¨ CMV Map Template - community-supported open source mapping framework ¤ https://github.com/cmv/ cmv-app ¨ ArcGIS Online Basemap ¨ Future Additions: ¤ Alternatives and Cost Data ¤ Before and After Map Swipe
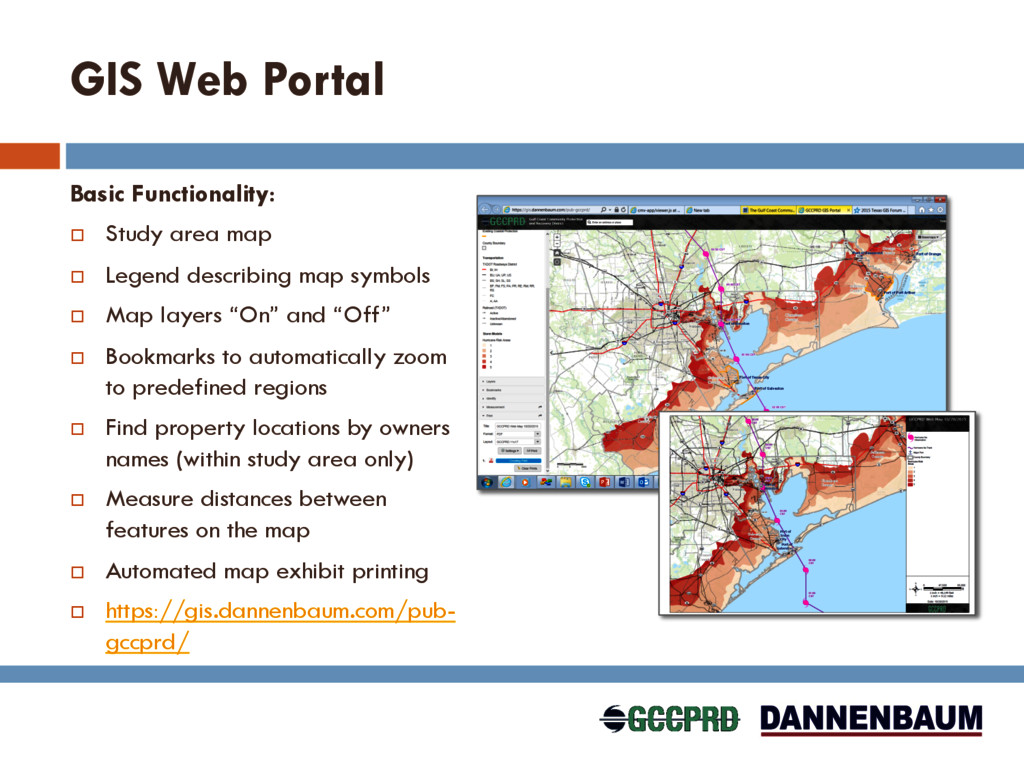
Legend describing map symbols ¨ Map layers “On” and “Off” ¨ Bookmarks to automatically zoom to predefined regions ¨ Find property locations by owners names (within study area only) ¨ Measure distances between features on the map ¨ Automated map exhibit printing ¨ https://gis.dannenbaum.com/pub- gccprd/
![Q&A Presented by: Chris Sallese, PMP Coastal Programs Director [email protected]](https://files.speakerdeck.com/presentations/91f381d3e87f43a487eedf9dad83237b/slide_27.jpg)