Dallas/Fort Worth Metroplex 1 John A. McEnery, University of Texas at Arlington Gregory P. Shelton, Na>onal Weather Service Kulsawasd Jitkajornwanich, University of Texas at Arlington
– University of Texas at Arlington – Na*onal Weather Service -‐ West Gulf River Forecast Center (NWS – Fort Worth, TX) • Funded through… – University Corpora*on for Atmospheric Research (UCAR) COMET Partners Program with support from the Na*onal Science Founda*on
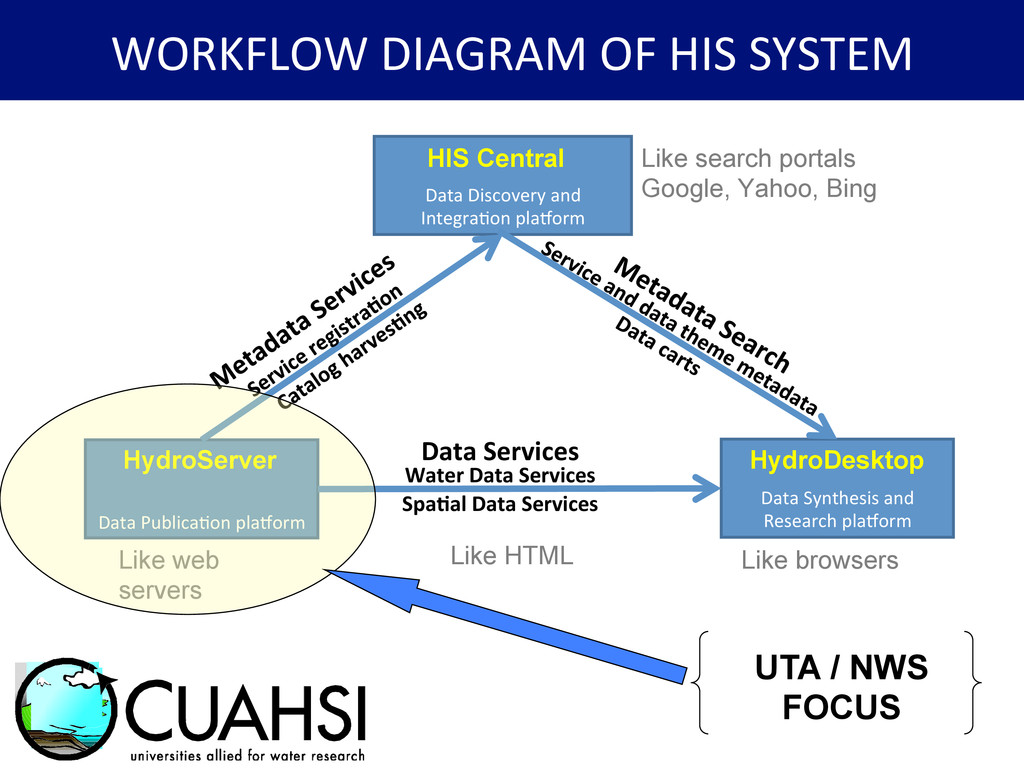
Data Synthesis and Research plaQorm Data Services HIS Central HydroDesktop HydroServer Water Data Services Spa>al Data Services Like search portals Google, Yahoo, Bing Like browsers Like web servers Like HTML UTA / NWS FOCUS WORKFLOW DIAGRAM OF HIS SYSTEM
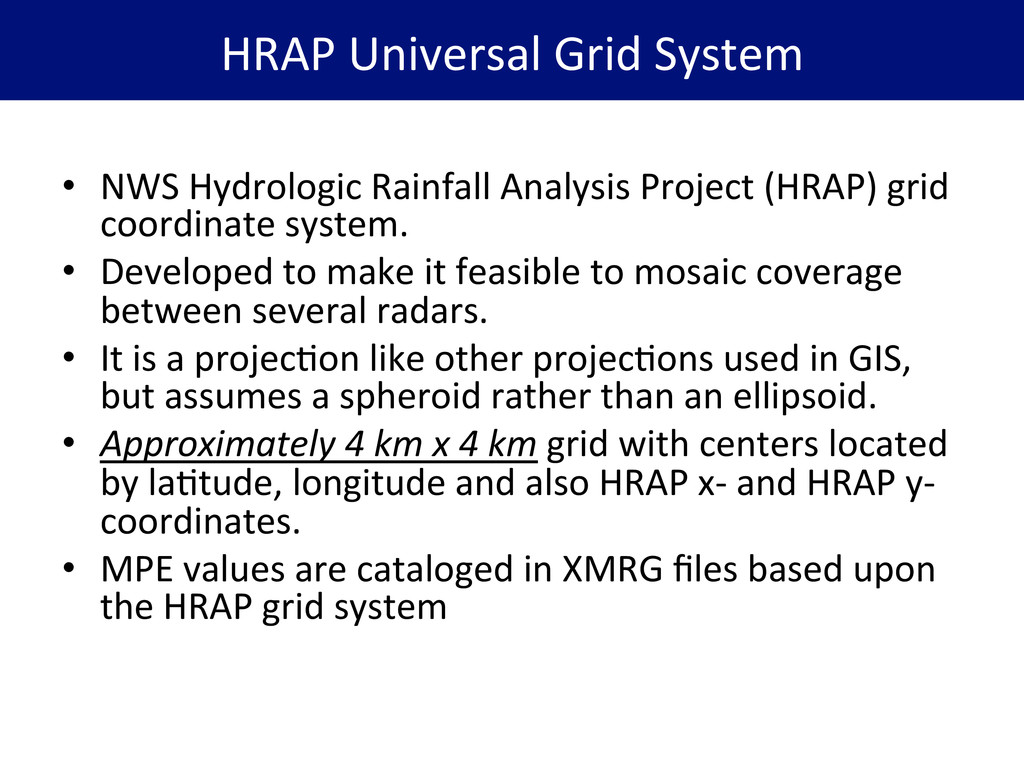
system. • Developed to make it feasible to mosaic coverage between several radars. • It is a projec*on like other projec*ons used in GIS, but assumes a spheroid rather than an ellipsoid. • Approximately 4 km x 4 km grid with centers located by la*tude, longitude and also HRAP x-‐ and HRAP y-‐ coordinates. • MPE values are cataloged in XMRG files based upon the HRAP grid system HRAP Universal Grid System
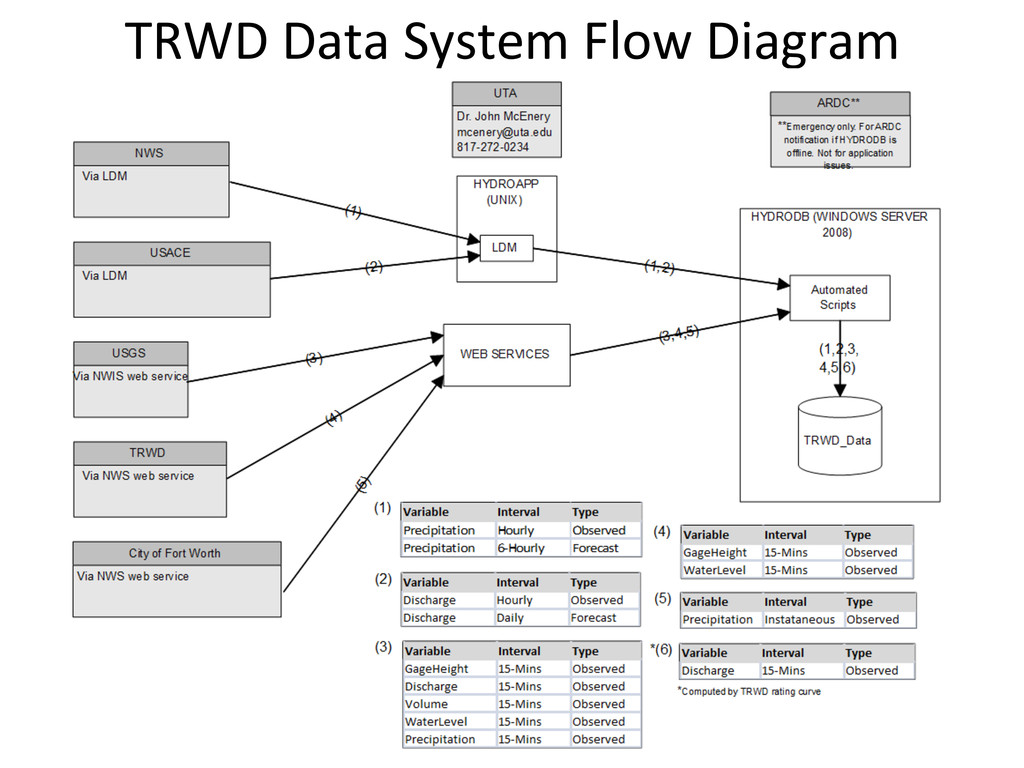
Manager (LDM) • LDM Connec*on became ac*ve November 22nd, 2010. – Routed from WGRFC through NWS Southern Region Headquarters and then to UTA. – Extremely dedicated effort by Mike Thompson of NWS to coordinate the configura*on for LDM.
System opera*ng as a regional center. • Tier III facility available to provide fail proof capabili*es for mission cri*cal opera*ons. • State-‐of-‐the-‐art data and high performance compu*ng center. • 24/7 sysop / uninterruptable power / security. Arlington Regional Data Center (ARDC)
3.5 GHz HT processing cores • 96 Gb memory • 2TB disk system for OS and log files in separate RAID 1 and RAID 10 arrays • 18 TB integrated storage for fast IO func*ons in RAID 5 array • MS Server 2008, SQL Server 2008 & ArcGIS Server ARDC System
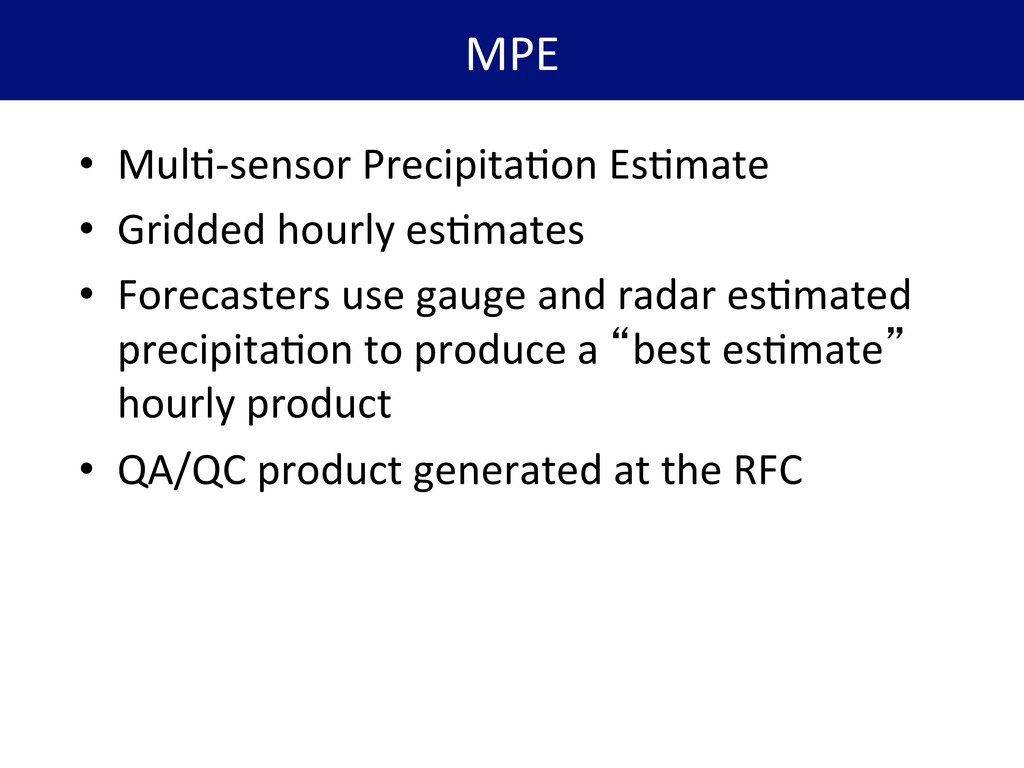
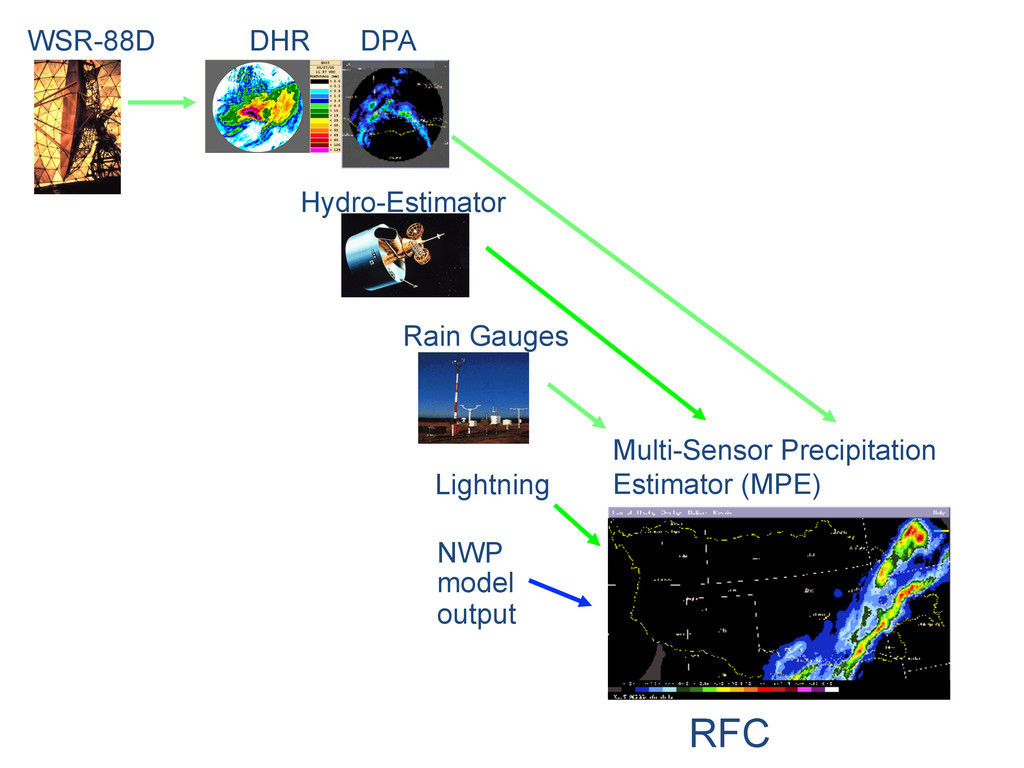
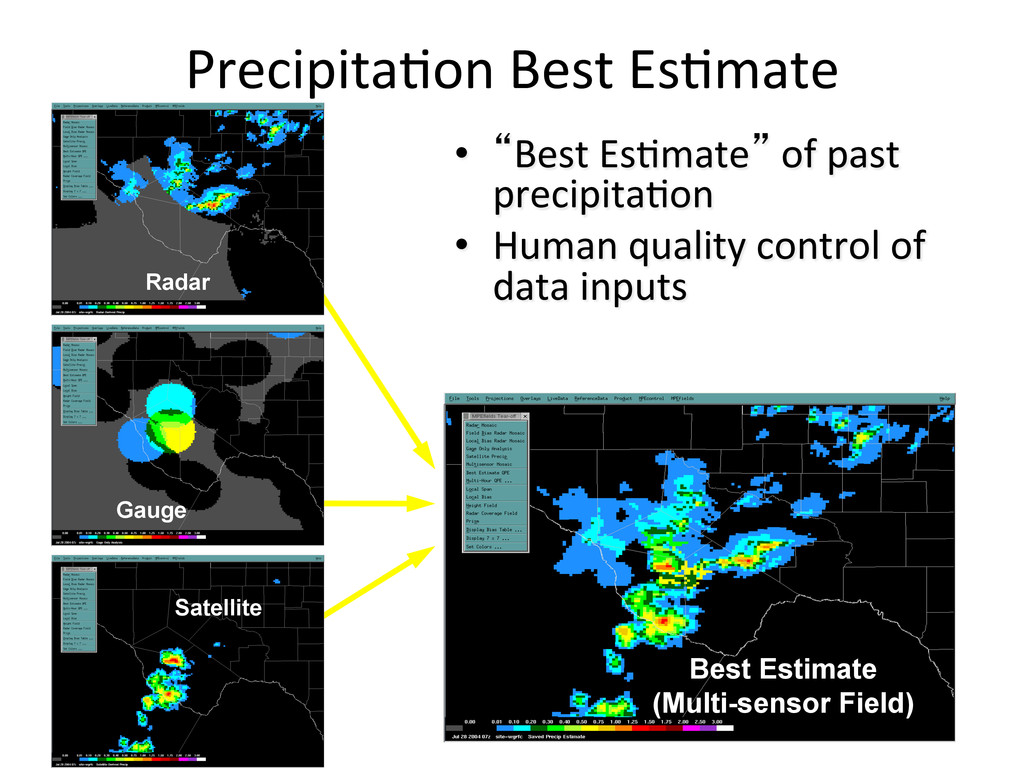
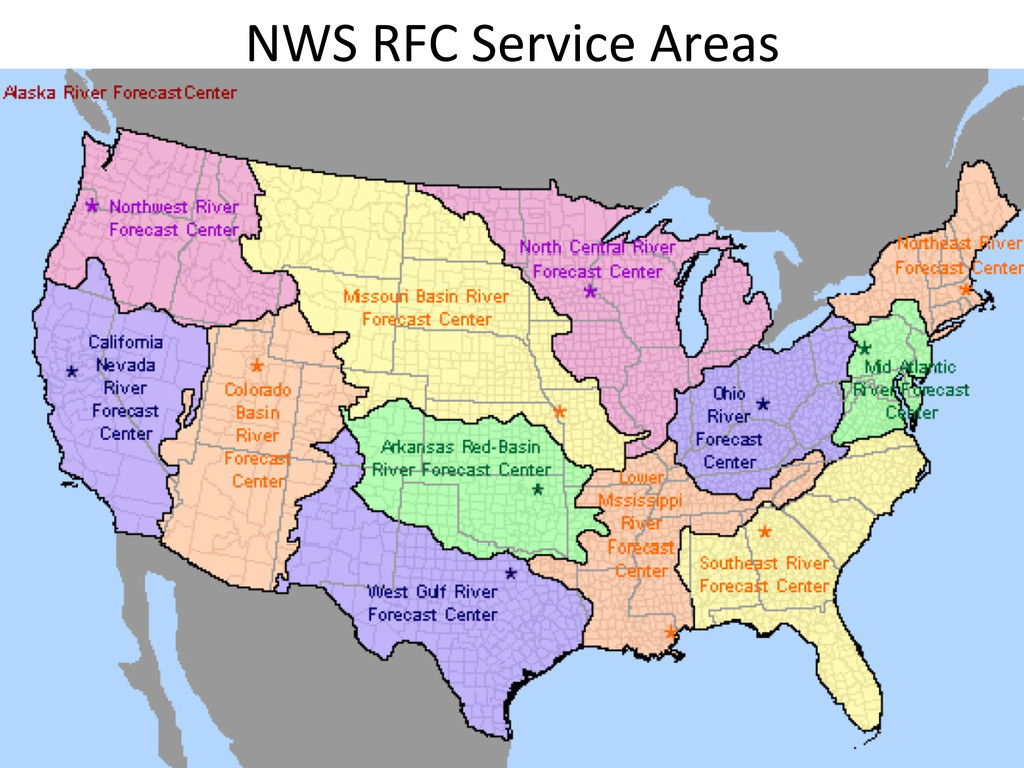
MPE (1995-‐ Present) available for en*re RFC service area. • Archived & Current Hourly MPE (1997-‐ Present) available for en*re RFC service area. • Project has created a mesh of “virtual rain gages” stretched over the landscape WGRFC Project Status
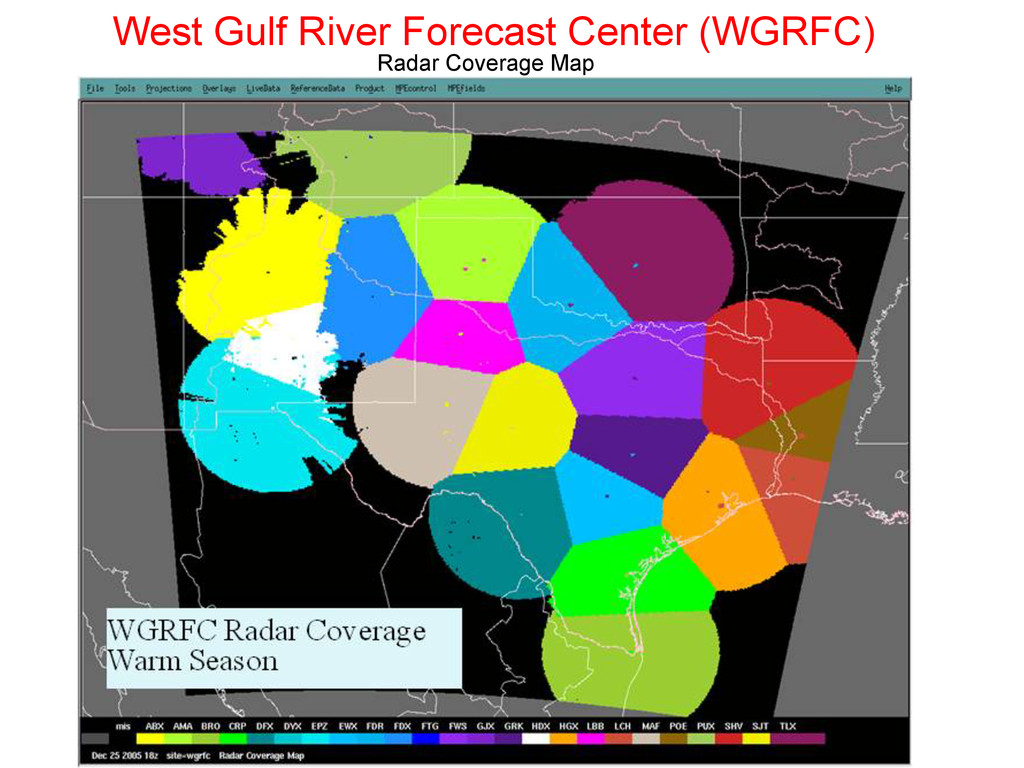
• 9 par*al U.S. States and parts of Mexico • 136,166 HRAP cell centers at 4 km x 4km • Approximately 840,000 square miles of coverage • Updated Hourly MPE System Coverage
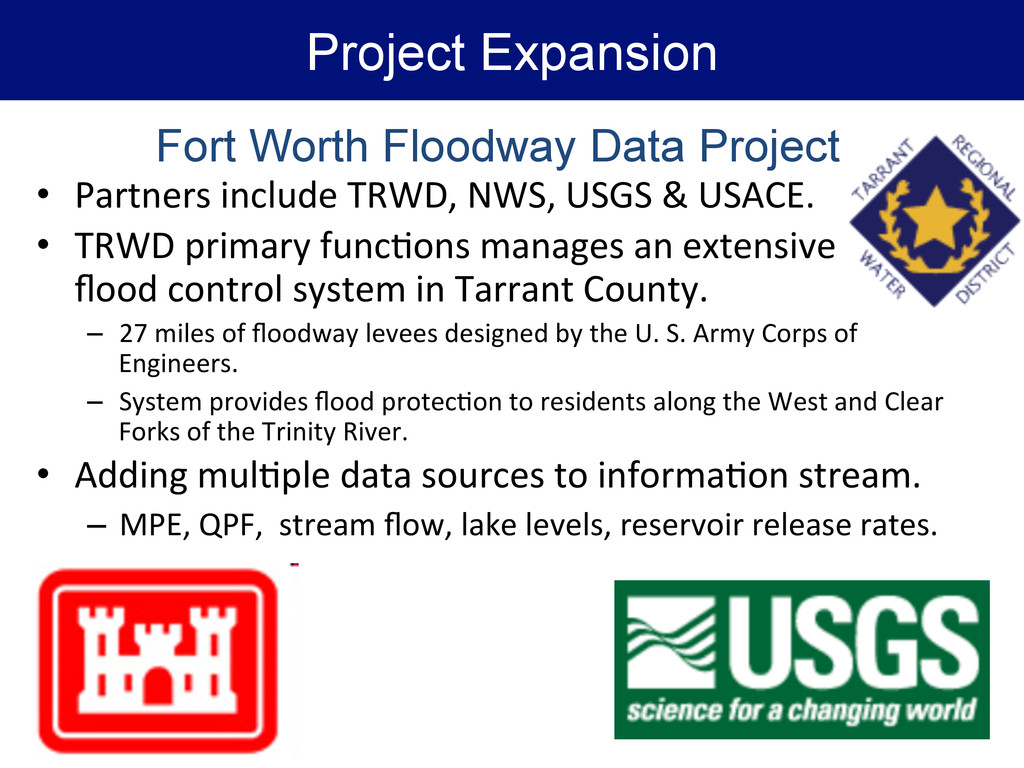
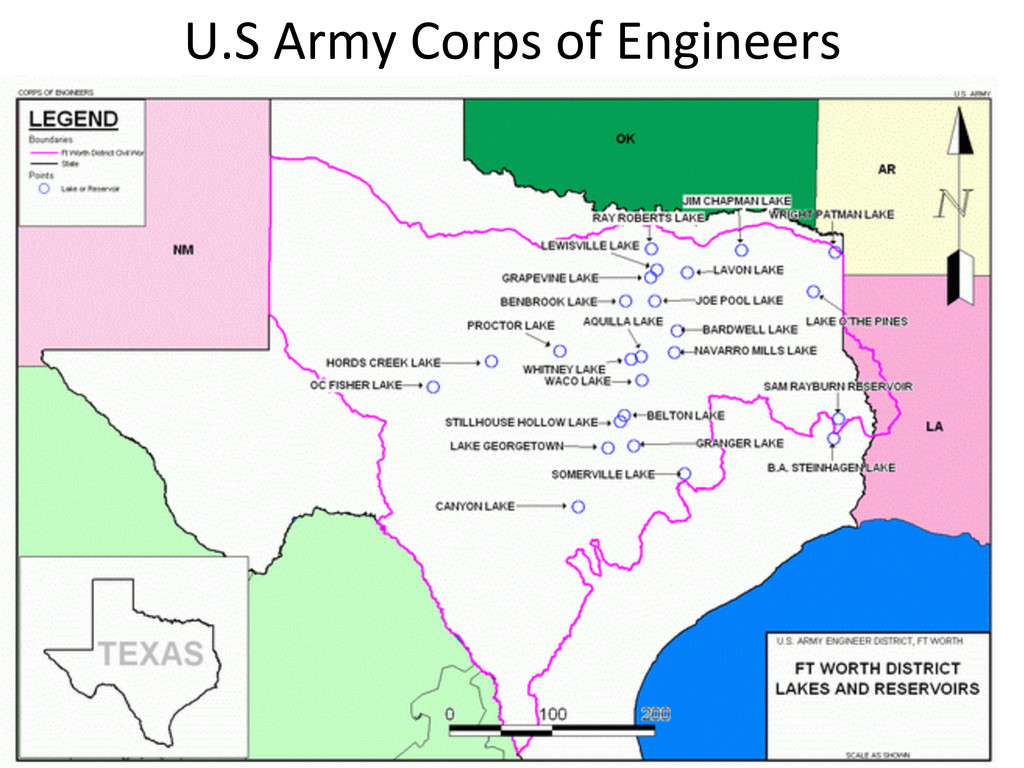
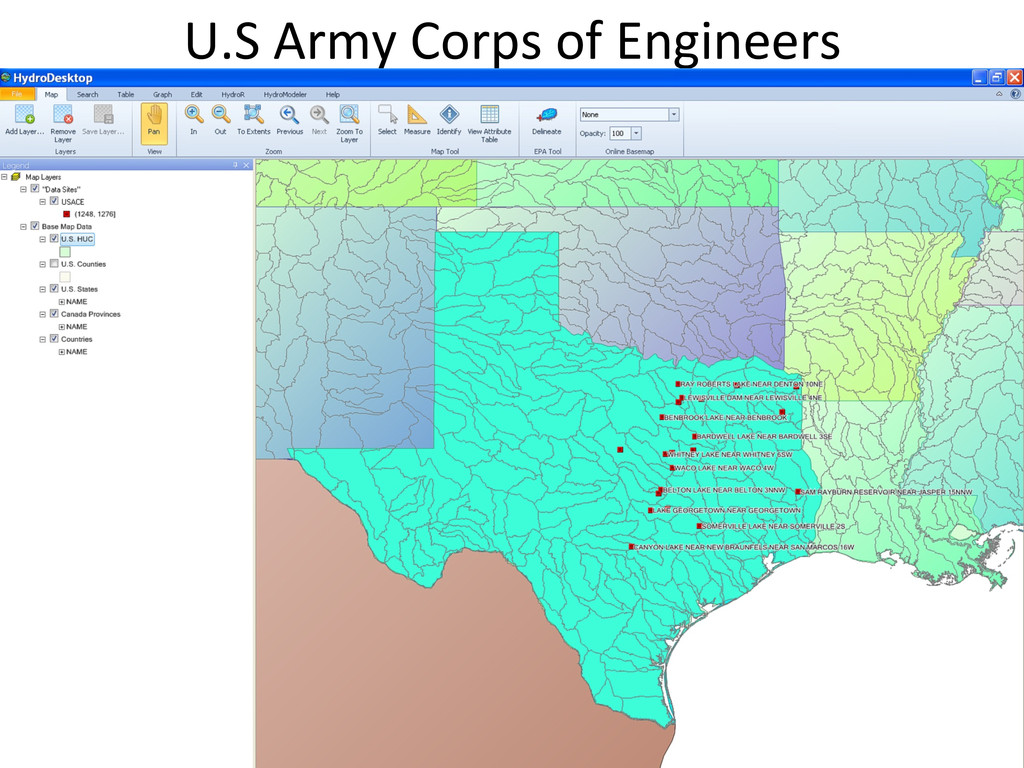
TRWD primary func*ons manages an extensive flood control system in Tarrant County. – 27 miles of floodway levees designed by the U. S. Army Corps of Engineers. – System provides flood protec*on to residents along the West and Clear Forks of the Trinity River. • Adding mul*ple data sources to informa*on stream. – MPE, QPF, stream flow, lake levels, reservoir release rates. Project Expansion Fort Worth Floodway Data Project
Regional Data Center. • UTA to manage ALERT data for City of Arlington. • Mee*ng with mul*ple municipali*es to coordinate one local regional repository for exchange of ALERT data so that all surrounding communi*es can share informa*on. UTA as custodian hos*ng the data at ARDC server. City of Arlington ALERT System
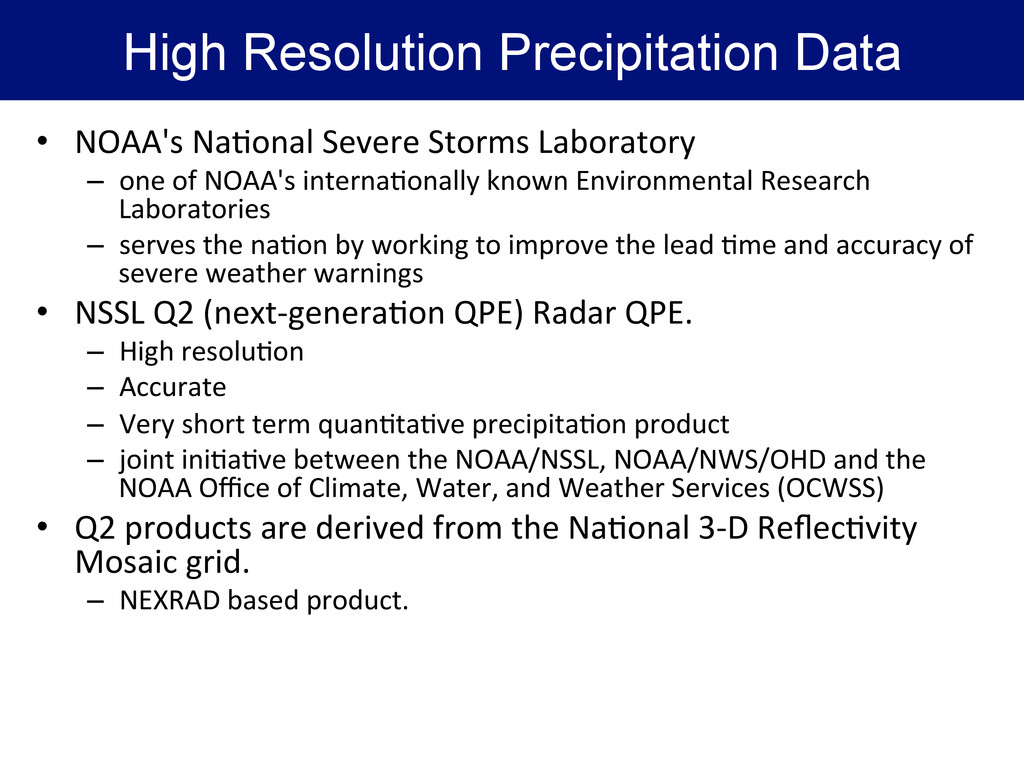
NOAA's interna*onally known Environmental Research Laboratories – serves the na*on by working to improve the lead *me and accuracy of severe weather warnings • NSSL Q2 (next-‐genera*on QPE) Radar QPE. – High resolu*on – Accurate – Very short term quan*ta*ve precipita*on product – joint ini*a*ve between the NOAA/NSSL, NOAA/NWS/OHD and the NOAA Office of Climate, Water, and Weather Services (OCWSS) • Q2 products are derived from the Na*onal 3-‐D Reflec*vity Mosaic grid. – NEXRAD based product. High Resolution Precipitation Data
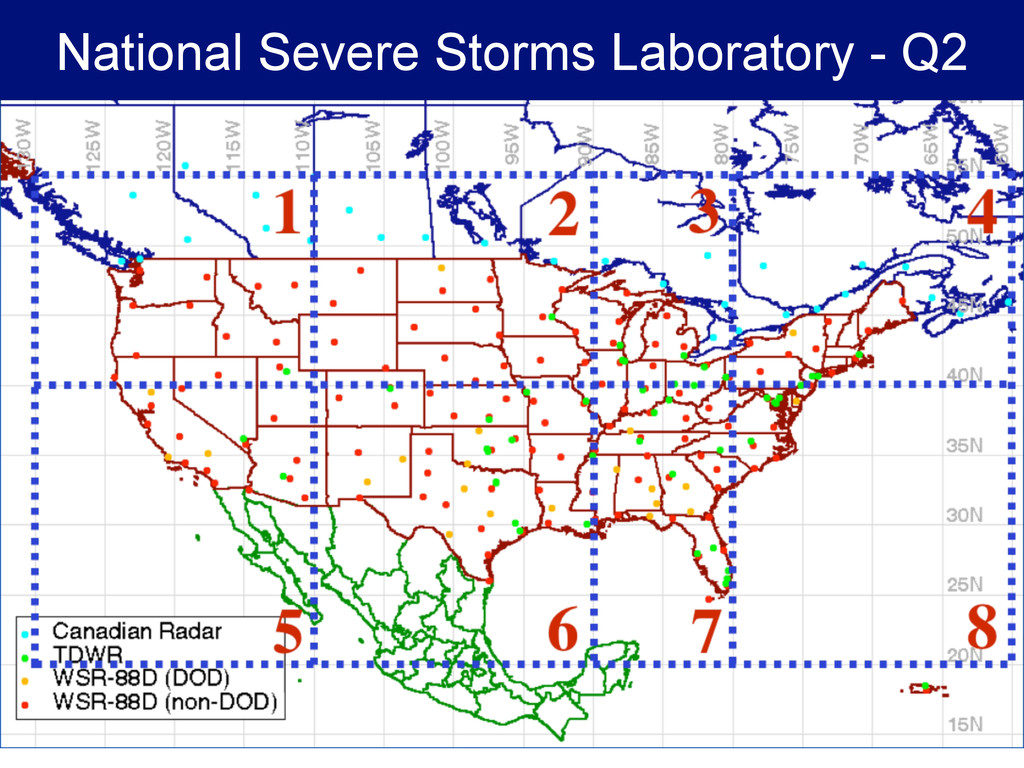
Product – Precipita*on rate at 5 minute frequency – Spa*al resolu*on: approximately 1km x 1km • This radar-‐derived product using – the Q2 precipita*on classifica*on process and – adap*ve Z–R rela*onships – for applica*ons in flash flood monitoring and predic*on. • LDM is used at UTA to receive Q2 products in real-‐ *me. • Coverage received at UTA is the Q2 Tile 6. High Resolution Precipitation Data
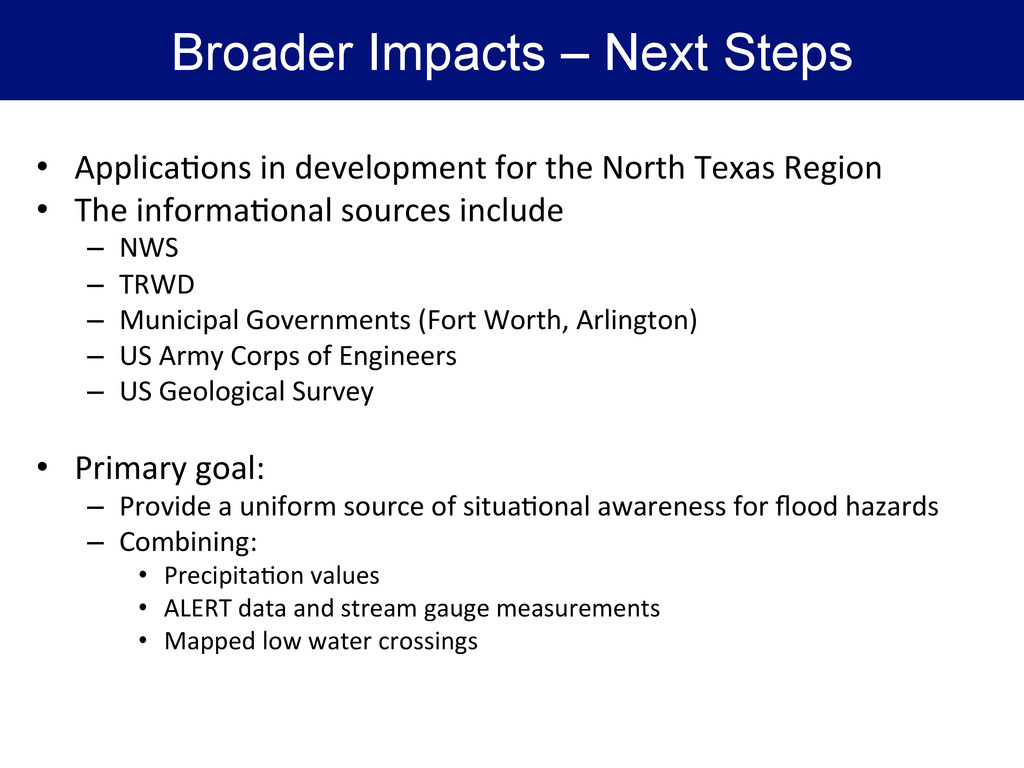
• The informa*onal sources include – NWS – TRWD – Municipal Governments (Fort Worth, Arlington) – US Army Corps of Engineers – US Geological Survey • Primary goal: – Provide a uniform source of situa*onal awareness for flood hazards – Combining: • Precipita*on values • ALERT data and stream gauge measurements • Mapped low water crossings Broader Impacts – Next Steps
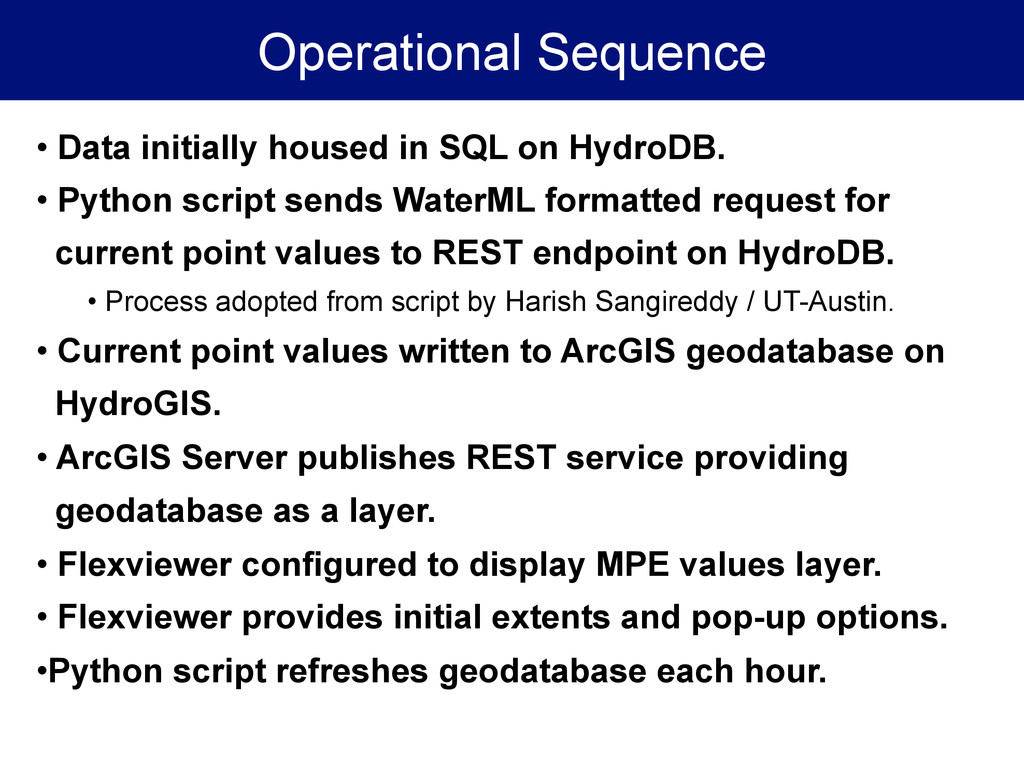
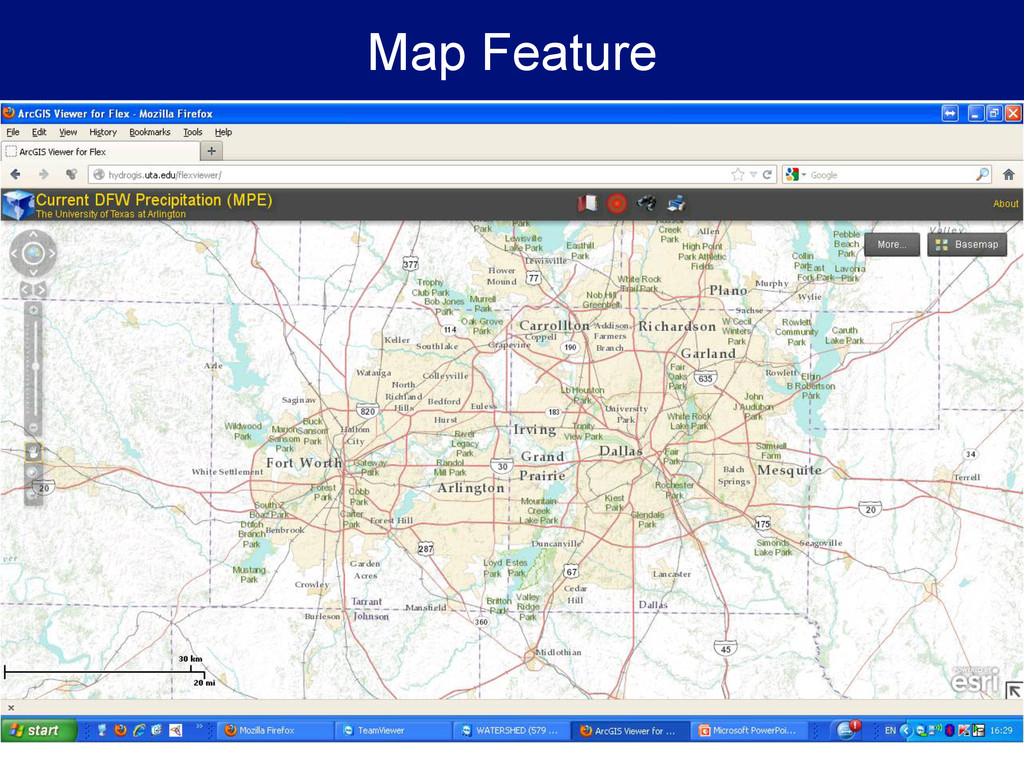
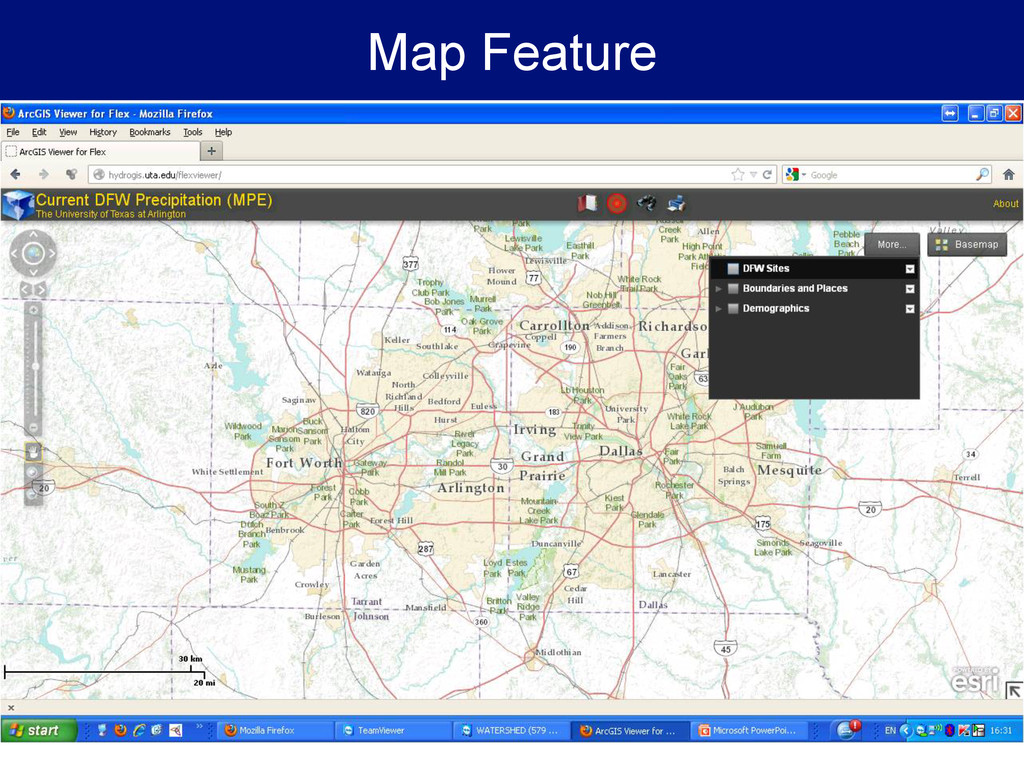
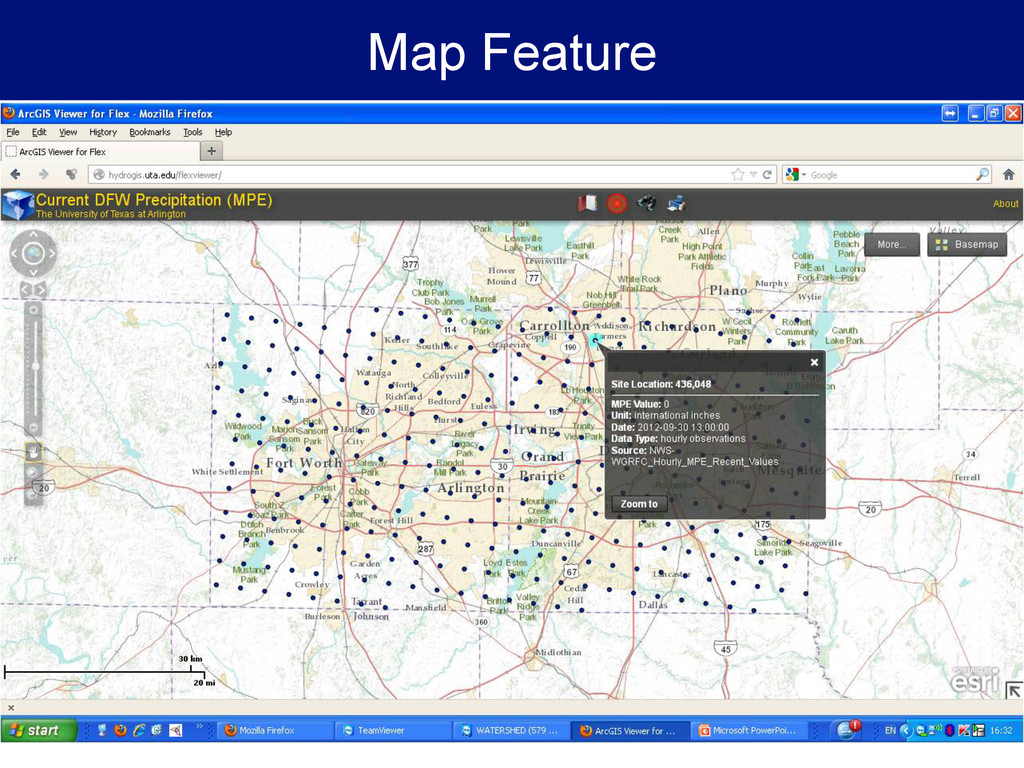
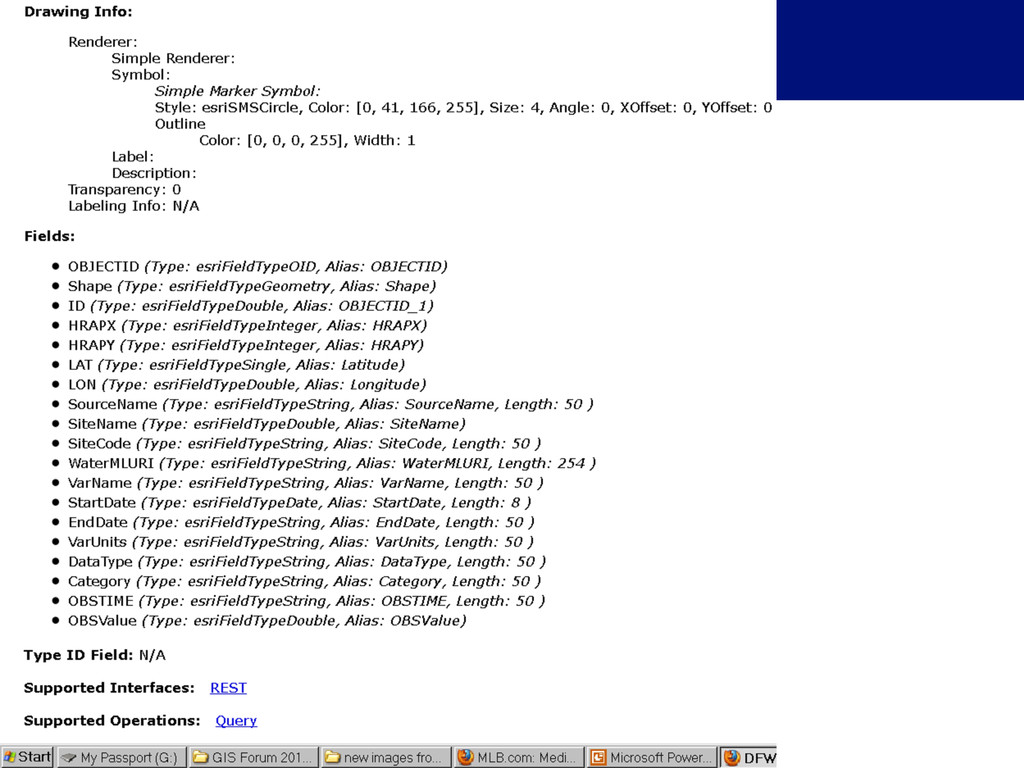
• Python script sends WaterML formatted request for current point values to REST endpoint on HydroDB. • Process adopted from script by Harish Sangireddy / UT-Austin. • Current point values written to ArcGIS geodatabase on HydroGIS. • ArcGIS Server publishes REST service providing geodatabase as a layer. • Flexviewer configured to display MPE values layer. • Flexviewer provides initial extents and pop-up options. • Python script refreshes geodatabase each hour.
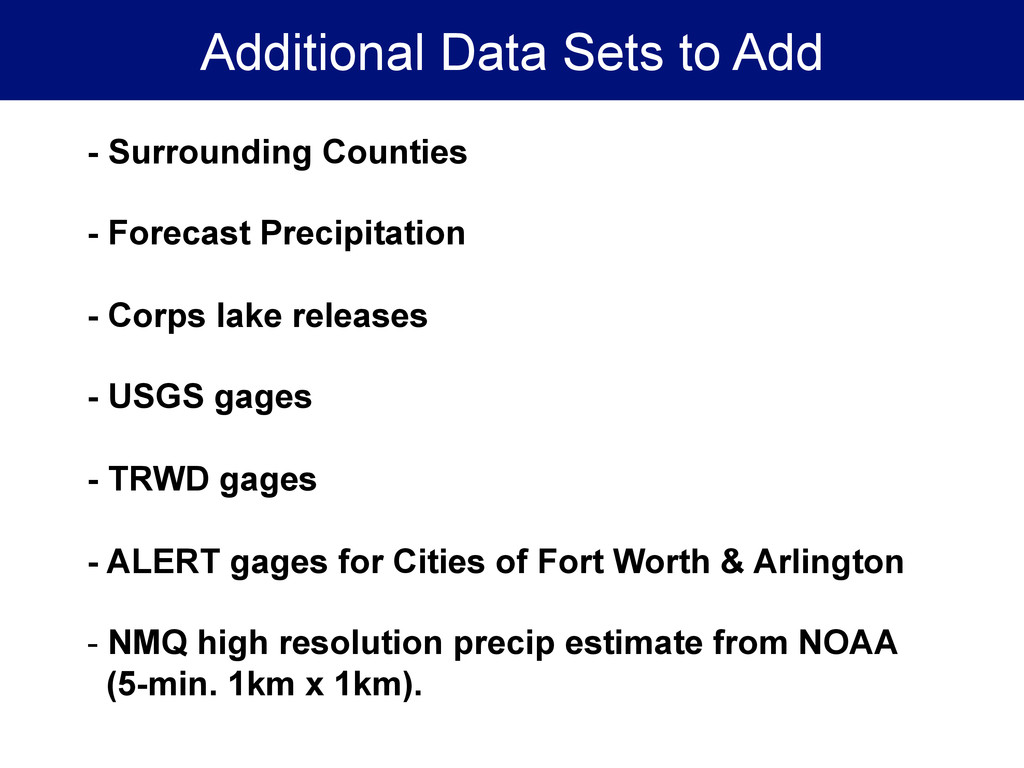
Precipitation - Corps lake releases - USGS gages - TRWD gages - ALERT gages for Cities of Fort Worth & Arlington - NMQ high resolution precip estimate from NOAA (5-min. 1km x 1km).
code the displayed points corresponding to rainfall amounts. - Overlay watershed boundaries and low water crossings - A slider bar to move through time and display the movement of an event over the area step-by- step - More robust pop-up dialog box (download function). - Additional choices under the More…. button for selection of the various data sets listed above. - Additional choices under the More…. button for selection of derivative values like past 15, 30, 45 minute, 3 hour, 6 hour or 12 hour precip accumulations. - Migrate to ArcGIS Online.
![Internet Address Or Contact by E-mail: [email protected] http://hydrogis.uta.edu/flexviewer/](https://files.speakerdeck.com/presentations/509054007536e500020178ce/slide_48.jpg)