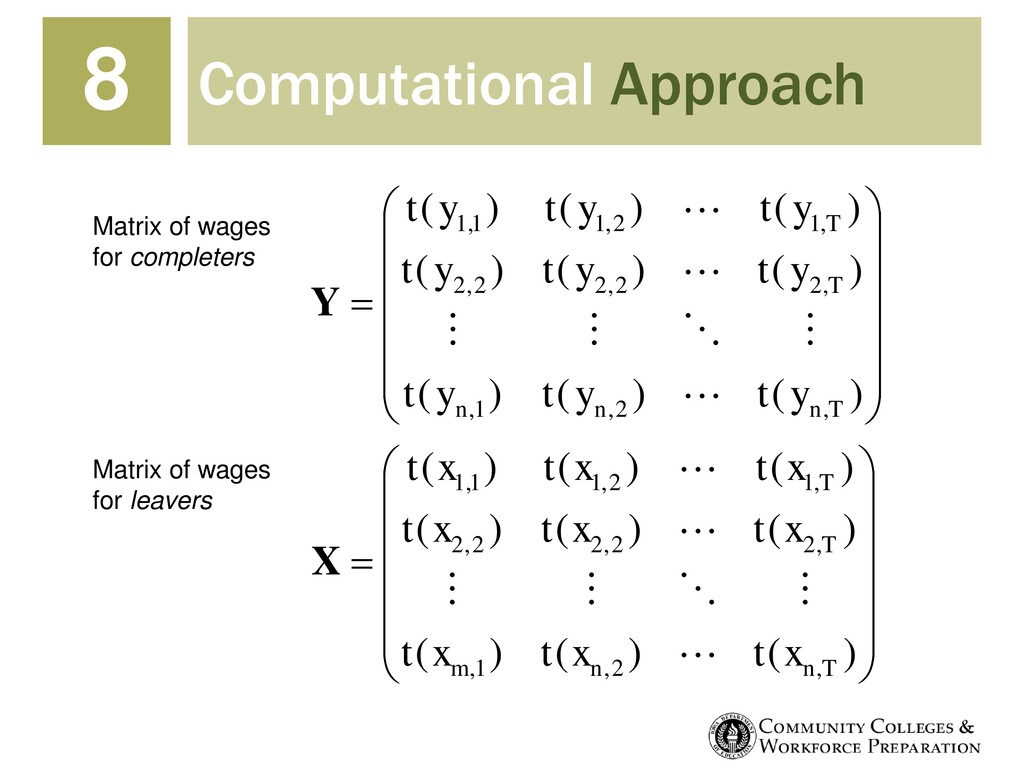
) ( ) ( ) ( ) ( ) ( ) ( ) ( ) ( ) ( ) ( ) ( ) ( ) ( ) ( ) ( ) ( ) ( ) ( , 2 , 1 , , 2 2 , 2 2 , 2 , 1 2 , 1 1 1 , 2 , 1 , , 2 2 , 2 2 , 2 , 1 2 , 1 1 1 T n n m T T , T n n n T T , x t x t x t x t x t x t x t x t x t y t y t y t y t y t y t y t y t y t X Y Matrix of wages for completers Matrix of wages for leavers
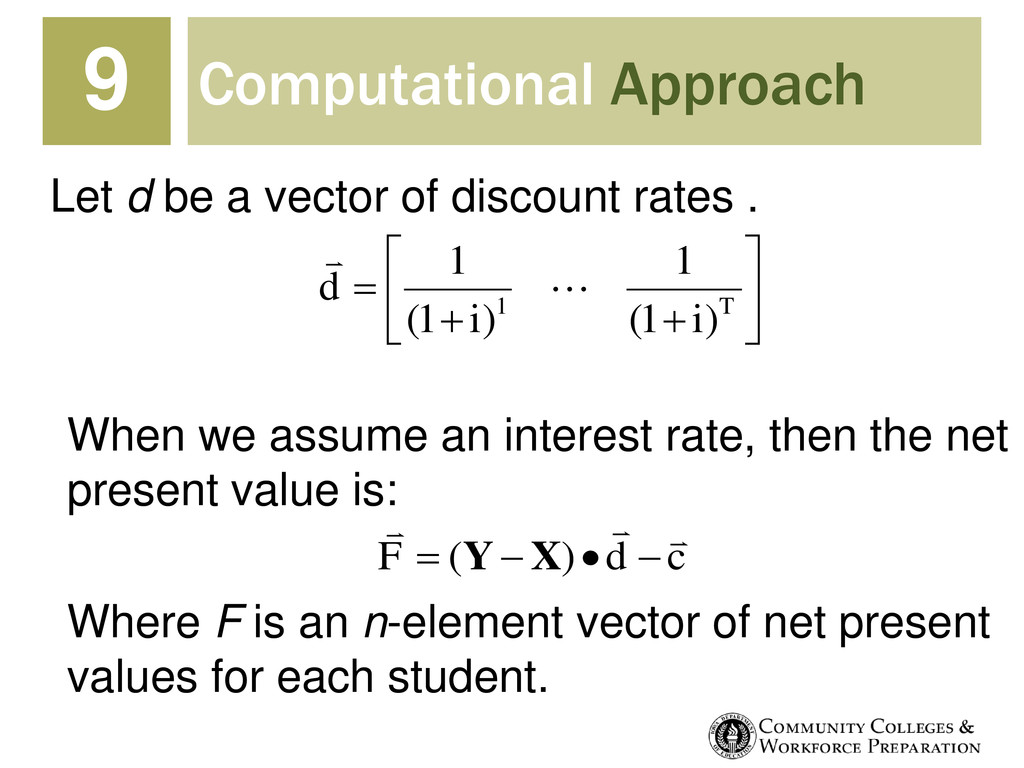
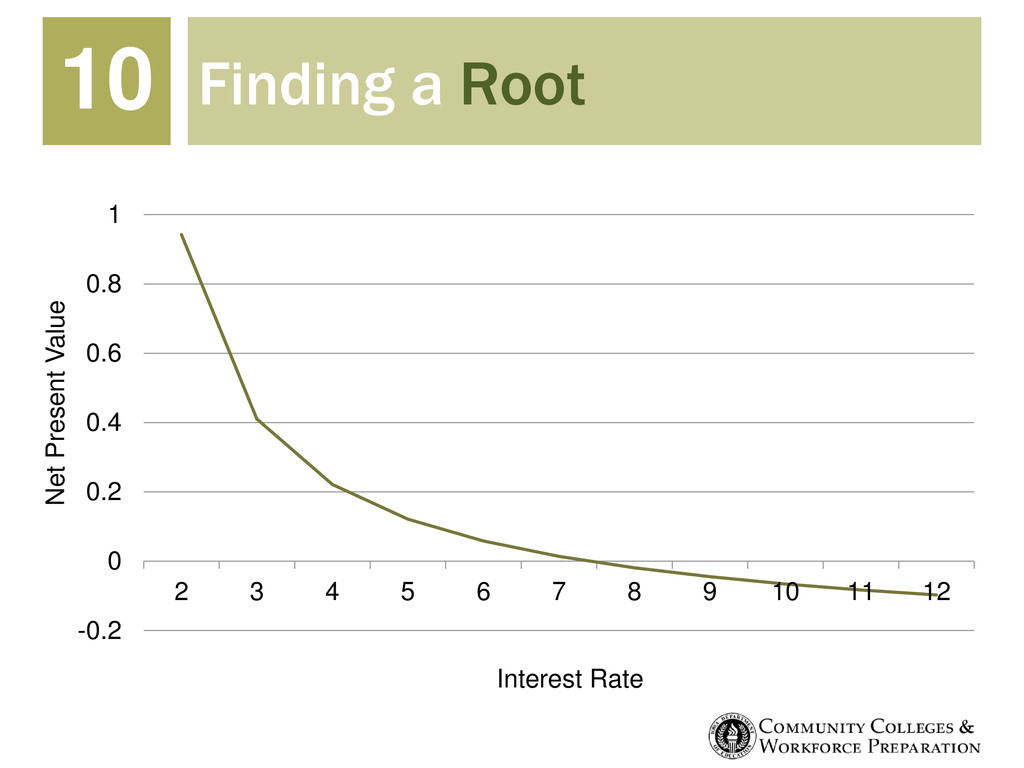
T i i d ) 1 ( 1 ) 1 ( 1 1 Let d be a vector of discount rates . When we assume an interest rate, then the net present value is: c d F ) ( X Y Where F is an n-element vector of net present values for each student.
www.iowa.gov/educate/ccpublications/ The Annual Condition of Iowa’s Community Colleges 2009, Iowa Department of Education Economic Returns & Career Transitions for Iowa Community College Students, Iowa Department of Education and Iowa Workforce Development “Calculating Returns to Degree Using Administrative Data: 2002 Cohort” T. Schenk & K. Matsuyama. Iowa Department of Education Technical Bulletin No. 2. 2009.
![Tom SCHENK Iowa Department of Education (515) 281-3753 [email protected] www.iowa.gov/educate/](https://files.speakerdeck.com/presentations/4fc97ae4af6a020022025442/slide_22.jpg)