Upgrade to Pro — share decks privately, control downloads, hide ads and more …

Patrick Campbell — Our Fundamental Strategy of Building a Business is Broken (Turing Fest 2018)

Patrick Campbell — Our Fundamental Strategy of Building a Business is Broken (Turing Fest 2018)

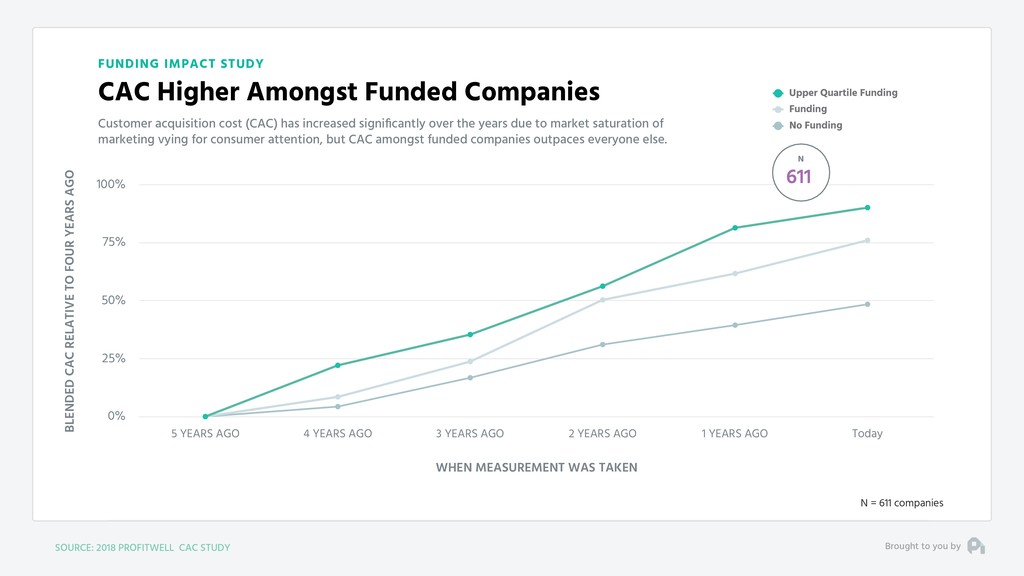
We've reached the point in the market where the "best practices" we've been taught are no longer applicable when it comes to growth. Using data from millions of customers and thousands of companies, Patrick will debunk much of the dogma that drives our mental models around building a business, before offering up a practical guide around pricing, building the right product, retention, and targeting the right customers - all to ensure we're building a sustainable, thriving business.

Turing Fest

August 01, 2018
Tweet

More Decks by Turing Fest

Other Decks in Business

Transcript

  1. You Brought to you by • Really good tech •

    Some great design • Low money
  2. You Brought to you by • Really good tech •

    Some great design • Low money
  3. You Brought to you by • Really good tech •

    Some great design • Low money
  4. You Brought to you by • Really good tech •

    Some great design • Low money
  5. You Brought to you by • Really good tech •

    Some great design • Low money
  6. You Brought to you by • Really good tech •

    Some great design • Low money
  7. You Brought to you by • Really good tech •

    Some great design • Low money
  8. Brought to you by “Wait - how do you even

    know large, bearded man?”
  9. Churn tribution Financial Unit Price Survey Willingness to In-App Usage

    Drastically reduce churn RETAIN Actionable, accurate insights to make you smarter about your business (for free) SUBSCRIPTION METRICS Proprietary pricing software for monetization MONETIZE
  10. We’ve collected more market data and seen inside more growth

    businesses than anyone else out there. Brought to you by
  11. • Company Level Cliches • Product Problems • Growth Terribleness

    THREE MAIN AXES OF BEST PRACTICES WE’LL EXPLORE — GETTING BACK TO THE FUNDAMENTALS Brought to you by your friends at
  12. FUNDING IMPACT STUDY CAC Higher Amongst Funded Companies Customer acquisition

    cost (CAC) has increased significantly over the years due to market saturation of marketing vying for consumer attention, but CAC amongst funded companies outpaces everyone else. BLENDED CAC RELATIVE TO FOUR YEARS AGO SOURCE: 2018 PROFITWELL CAC STUDY 0% 25% 50% 75% 100% 5 YEARS AGO 4 YEARS AGO 3 YEARS AGO 2 YEARS AGO 1 YEARS AGO Today Upper Quartile Funding Funding No Funding WHEN MEASUREMENT WAS TAKEN N 611 N = 611 companies Brought to you by
  13. CONSUMERS ARE GETTING HAMMERED Number of Competitors in First Year

    in Business Companies started more than a year ago had far fewer competitors in their space than companies started today. AVERAGE # OF COMPETITORS IN THEIR 1ST YEAR AGE OF COMPANY 2016 SOFTWARE MARKET SURVEY 0 5 10 5 YEARS OLD 3 YEARS OLD 1 YEAR OLD 9.7 4.8 2.6 N = 1432 software founders and executives Brought to you by your friends at
  14. CAC COMPETITION BENCHMARKS CAC Lower Amongst Competition Focused Companies Customer

    acquisition cost (CAC) has increased significantly over the years due to market saturation of marketing vying for consumer attention, but CAC amongst competitor focused companies is lower. BLENDED CAC RELATIVE TO FOUR YEARS AGO SOURCE: 2018 PROFITWELL CAC STUDY 0% 15% 30% 45% 60% 5 YEARS AGO 4 YEARS AGO 3 YEARS AGO 2 YEARS AGO 1 YEARS AGO Today Overall Competitor Marketing Strategy WHEN MEASUREMENT WAS TAKEN N 507 N = 507 companies Brought to you by
  15. PRODUCT COMPETITION BENCHMARKS NPS is Lower for Competitor Focused Product

    Teams NPS is falling overall, but companies who are focused on competition from a product perspective are seeing lower NPS scores overall indicating you shouldn’t focused on competition to build product. AVERAGE NPS SCORE YEARS AGO SOURCE: 2018 COMPETITOR STUDY 0 7 13 20 27 33 40 5 YEARS AGO 3 YEARS AGO 1 YEAR AGO 5.22 12.08 24.11 10.2 19.5 33.8 Overall Competitive Product Strategy N = 231 companies N 231 Brought to you by
  16. FOUNDER IMPACT STUDY Hard to Grow Quickly Without Being All

    In Companies with Founders who score high on our work-life balance index tend to have companies who are growing much slower than those who score low on the work-life balance index. MIDSPREAD YOY GROWTH % SOURCE: 2018 PROFITWELL FOUNDER IMPACT STUDY 0% 25% 50% 75% 100% 2012 2013 2014 2015 2016 2017 49.3% 55.7% 54.1% 45.3% 47.9% 51.4% 30.9% 31.8% 27.5% 29.4% 32.2% 32.7% Balanced All In N 182 N = Minimum of 182 companies per segment pulled from the middle 2/3 of companies in terms of growth rate. This, along with a dampening model was used to control for outlier spikes in growth rate. Brought to you by YEAR MEASUREMENT WAS TAKEN
  17. FOUNDER IMPACT STUDY Companies with Founders with a Hobby Grow

    Slower Founder who have a hobby they dedicate an average of 10 hours per week to tend to have slower growing companies compared to Founders without a hobby or ones that take up less than 10 hours per week. MIDSPREAD YOY GROWTH % SOURCE: 2018 PROFITWELL FOUNDER IMPACT STUDY 0% 25% 50% 75% 100% 2014 2015 2016 2017 51.2% 53.1% 54.1% 46.2% 40.5% 43.0% 37.0% 38.9% Hobby No Hobby N 182 N = Minimum of 182 companies per segment pulled from the middle 2/3 of companies in terms of growth rate. This, along with a dampening model was used to control for outlier spikes in growth rate. Brought to you by YEAR MEASUREMENT WAS TAKEN
  18. • Funding requires scalpel, not sledgehammer thinking • Competition thinking

    will help unit economics, but not product • Work-life balance and hobbies likely will mean slower growth BUILDING A COMPANY IS INSANELY TOUGH — RETHINK THE COMPANY CLICHES Brought to you by your friends at
  19. THE MARKET IS DROPPING OUT BENEATH US Consumer Willingness to

    Pay has Declined Over Time Software willingness to pay has declined significantly over the past few years due to increased options and higher demands. WTP AS % OF WTP 4 YEARS AGO SOURCE: 2017 CONSUMER WILLINGNESS TO PAY STUDY 0% 30% 60% 90% 120% 5 YEARS AGO 4 YEARS AGO 3 YEARS AGO 2 YEARS AGO 1 YEAR AGO TODAY Core Features Single Sign On Integrations Analytics WHEN MEASUREMENT WAS TAKEN N = Varies by line, but minimum of 10,000 customer respondents per line N 921k Brought to you by your friends at
  20. -50% -40% -30% -20% -10% 0% 10% 20% 30% 40%

    50% -0.5 -0.4 -0.3 -0.2 -0.1 0 0.1 0.2 0.3 0.4 0.5 Revenue Drivers 2017 SOFTWARE MARKET SURVEY THE MARKET IS DROPPING OUT BENEATH US Measuring consumer sentiment to what we’re building DEVIATION FROM MEDIAN WTP RELATIVE PREFERENCE MAGNITUDE Brought to you by
  21. 2017 SOFTWARE MARKET SURVEY THE MARKET IS DROPPING OUT BENEATH

    US Measuring consumer sentiment to what we’re building Relative Value of Attributes Brought to you by
  22. 2017 SOFTWARE MARKET SURVEY THE MARKET IS DROPPING OUT BENEATH

    US Measuring consumer sentiment to what we’re building Relative Value of Attributes • Taste • Country of Origin • Temperature Brought to you by
  23. 2017 SOFTWARE MARKET SURVEY THE MARKET IS DROPPING OUT BENEATH

    US Measuring consumer sentiment to what we’re building Relative Value of Attributes • Taste • Country of Origin • Temperature Willingness to Pay • Price elasticity for a cup of coffee Brought to you by
  24. -50% -40% -30% -20% -10% 0% 10% 20% 30% 40%

    50% -0.5 -0.4 -0.3 -0.2 -0.1 0 0.1 0.2 0.3 0.4 0.5 Revenue Drivers 2017 SOFTWARE MARKET SURVEY THE MARKET IS DROPPING OUT BENEATH US Measuring consumer sentiment to what we’re building DEVIATION FROM MEDIAN WTP RELATIVE PREFERENCE MAGNITUDE Taste Brought to you by
  25. -50% -40% -30% -20% -10% 0% 10% 20% 30% 40%

    50% -0.5 -0.4 -0.3 -0.2 -0.1 0 0.1 0.2 0.3 0.4 0.5 Revenue Drivers 2017 SOFTWARE MARKET SURVEY THE MARKET IS DROPPING OUT BENEATH US Measuring consumer sentiment to what we’re building DEVIATION FROM MEDIAN WTP RELATIVE PREFERENCE MAGNITUDE Taste Temperature Country of Origin Brought to you by
  26. -50% -40% -30% -20% -10% 0% 10% 20% 30% 40%

    50% -0.5 -0.4 -0.3 -0.2 -0.1 0 0.1 0.2 0.3 0.4 0.5 Revenue Drivers 2017 SOFTWARE MARKET SURVEY THE MARKET IS DROPPING OUT BENEATH US Measuring consumer sentiment to what we’re building DEVIATION FROM MEDIAN WTP RELATIVE PREFERENCE MAGNITUDE Taste Temperature Country of Origin Brought to you by
  27. -50% -40% -30% -20% -10% 0% 10% 20% 30% 40%

    50% -0.5 -0.4 -0.3 -0.2 -0.1 0 0.1 0.2 0.3 0.4 0.5 Revenue Drivers 2017 SOFTWARE MARKET SURVEY WE’RE BUILDING THE WRONG PRODUCT Calculating the expected impact of product on growth DEVIATION FROM MEDIAN WTP RELATIVE PREFERENCE MAGNITUDE Differentiable Features High Value/High WTP Brought to you by
  28. -50% -40% -30% -20% -10% 0% 10% 20% 30% 40%

    50% -0.5 -0.4 -0.3 -0.2 -0.1 0 0.1 0.2 0.3 0.4 0.5 Revenue Drivers 2017 SOFTWARE MARKET SURVEY WE’RE BUILDING THE WRONG PRODUCT Calculating the expected impact of product on growth DEVIATION FROM MEDIAN WTP RELATIVE PREFERENCE MAGNITUDE Differentiable Features High Value/High WTP Add-Ons Low Value/High WTP Brought to you by
  29. -50% -40% -30% -20% -10% 0% 10% 20% 30% 40%

    50% -0.5 -0.4 -0.3 -0.2 -0.1 0 0.1 0.2 0.3 0.4 0.5 Revenue Drivers 2017 SOFTWARE MARKET SURVEY WE’RE BUILDING THE WRONG PRODUCT Calculating the expected impact of product on growth DEVIATION FROM MEDIAN WTP RELATIVE PREFERENCE MAGNITUDE Differentiable Features High Value/High WTP Add-Ons Low Value/High WTP Core Features High Value/Low WTP Brought to you by
  30. -50% -40% -30% -20% -10% 0% 10% 20% 30% 40%

    50% -0.5 -0.4 -0.3 -0.2 -0.1 0 0.1 0.2 0.3 0.4 0.5 Revenue Drivers 2017 SOFTWARE MARKET SURVEY WE’RE BUILDING THE WRONG PRODUCT Calculating the expected impact of product on growth DEVIATION FROM MEDIAN WTP RELATIVE PREFERENCE MAGNITUDE Differentiable Features High Value/High WTP Add-Ons Low Value/High WTP Core Features High Value/Low WTP Trash Land Low Value/Low WTP Brought to you by
  31. CLEAR WINNERS AND LOSERS Comparing Cust Dev Strategies of Companies

    Acquisition based growth companies grow at a smaller rate than those with a balanced growth approach (growth from all three pillars of growth). YOY GROWTH RATE SOURCE: 2017 STUDY ON CUST DEV 0% 25% 50% 75% 100% 2012 2017 44.821% 31.72% Minimal Customer Development Aggressive Customer Development N 687 N = Minimum of 687 companies per segment pulled from the middle 2/3 of companies in terms of growth rate. This, along with a dampening model was used to control for outlier spikes in growth rate. Brought to you by
  32. CLEAR WINNERS AND LOSERS Comparing Cust Dev Strategies of Companies

    Acquisition based growth companies grow at a smaller rate than those with a balanced growth approach (growth from all three pillars of growth). YOY GROWTH RATE SOURCE: 2017 STUDY ON CUST DEV 0% 25% 50% 75% 100% 2012 2017 59.08% 44.821% 17.43% 31.72% Minimal Customer Development Aggressive Customer Development N 687 N = Minimum of 687 companies per segment pulled from the middle 2/3 of companies in terms of growth rate. This, along with a dampening model was used to control for outlier spikes in growth rate. Brought to you by
  33. • You probably need multiple products sooner than later (at

    least for growth) • Features are no longer keys to brute force growth • You need to understand your customers better to properly build the right product these days PRODUCT FOCUS HAS NEVER BEEN MORE IMPORTANT — PRODUCT REQUIRES FOCUS Brought to you by your friends at
  34. WE MAKE MATTER SO MUCH WORSE Which Pillar is the

    Most Important in Your Business Founders and software executives overwhelmingly put their support behind acquisition based growth instead of caring about monetization or retention. % OF TOTAL RESPONDENTS PILLAR OF THE BUSINESS 2017 SOFTWARE MARKET SURVEY 0% 50% 100% MORE LOGOS MORE $ PER CUSTOMER KEEP CUSTOMER LONGER 21.1% 7.58% 71.32% N = 1578 software founders and executives N 1578 Brought to you by your friends at
  35. WE FOCUS ON THE WRONG FUNDAMENTALS Impact of Improving Each

    Pillar of Your Business Monetization and retention based growth far outpaces acquisition based growth. This impact is getting greater over time. % IMPACT ON REVENUE SOURCE: 2016 STUDY ON COMPANY UNIT ECONOMICS 0% 5% 10% 15% 20% ACQUISITION MONETIZATION RETENTION 2.35% 3.32% 2008 - 2012 2013 - 2016 N 734 N = Data from 734 software companies PILLAR OF THE BUSINESS Brought to you by your friends at
  36. WE FOCUS ON THE WRONG FUNDAMENTALS Impact of Improving Each

    Pillar of Your Business Monetization and retention based growth far outpaces acquisition based growth. This impact is getting greater over time. % IMPACT ON REVENUE SOURCE: 2016 STUDY ON COMPANY UNIT ECONOMICS 0% 5% 10% 15% 20% ACQUISITION MONETIZATION RETENTION 9.32% 15.89% 2.35% 6.71% 12.7% 3.32% 2008 - 2012 2013 - 2016 N 1.4k N = Data from 1.4k software companies PILLAR OF THE BUSINESS Brought to you by your friends at
  37. • Discounting is terrible. Stop it. • You need at

    least the semblance of a brand strategy. • Pricing/Retention are more important than ever GROWTH IS IMPOSSIBLY HARD GIVEN THE DENSITY OF THE MARKET — GROWTH IS TOUGH Brought to you by your friends at