Upgrade to Pro
— share decks privately, control downloads, hide ads and more …
Speaker Deck
Features
Speaker Deck
PRO
Sign in
Sign up for free
Search
Search
Early Stage Investing: 1999 All Over Again?
Search
Tytus Michalski
November 28, 2012
Business
130
1
Share
Embed
Copy iframe code
Copy JS code
Copy link
Start on current slide
Early Stage Investing: 1999 All Over Again?
Tytus Michalski
November 28, 2012
More Decks by Tytus Michalski
See All by Tytus Michalski
Latest Trends in Deal Terms
tytus
0
100
Startup Ecosystems: What is the Single Most Important Factor?
tytus
0
110
Build and Fly (You and Entrepreneurship)
tytus
0
130
Angels in HK
tytus
0
170
Logistics: Old vs. New
tytus
0
110
Angel Investing: Fear is Good
tytus
0
200
Angel Fundraising (Enhanced & Extended Version)
tytus
0
400
Angel Fundraising
tytus
0
110
Education: Past vs. Present
tytus
0
270
Other Decks in Business
See All in Business
株式会社BALLAS 会社案内
ballas_inc
0
40k
株式会社プロッセルテクノロジーズ会社紹介
tom1214
0
310
フルカイテン株式会社 採用資料
fullkaiten
0
100k
[CCSummit2026]Confidential Computing for Sovereign AI: The Emerging Opportunity in Japan ーBuilt on Global Innovation, Governed by Sovereign Trust.ー
acompany
PRO
0
380
プロシェアリング白書2026_PROSHARING_REPORT_2026
circulation
0
190
タスク分解も大事だけど、「文脈」を分解するのはもっと大事
masahagiwara
0
130
自分を知ることから始まる生存戦略
peacemaker07
2
430
PMMから始まる経営 PMM→CMO/CPOの5年から導いた、 PMMの役割
kazuotanaka
1
320
【アルー株式会社】27年度・28年度新卒採用_会社説明資料
recruitalue
0
110
自分のハンドルを握る〜AI時代だからこそ求められるセルフマネジメントの技術/Self-Management Skills Needed More Than Ever in the AI Era
ikuodanaka
1
3.2k
enechain company deck
enechain
PRO
10
180k
Kasanare_Recruitng_Pitch
kyoichi_yasuda
0
690
Featured
See All Featured
The Illustrated Children's Guide to Kubernetes
chrisshort
51
53k
The Art of Programming - Codeland 2020
erikaheidi
57
14k
Evolution of real-time – Irina Nazarova, EuRuKo, 2024
irinanazarova
9
1.4k
Code Review Best Practice
trishagee
74
20k
What does AI have to do with Human Rights?
axbom
PRO
1
2.2k
The Psychology of Web Performance [Beyond Tellerrand 2023]
tammyeverts
49
3.5k
Un-Boring Meetings
codingconduct
0
350
Jess Joyce - The Pitfalls of Following Frameworks
techseoconnect
PRO
1
190
Bioeconomy Workshop: Dr. Julius Ecuru, Opportunities for a Bioeconomy in West Africa
akademiya2063
PRO
1
180
Bootstrapping a Software Product
garrettdimon
PRO
307
120k
GraphQLの誤解/rethinking-graphql
sonatard
75
12k
Highjacked: Video Game Concept Design
rkendrick25
PRO
1
410
Transcript
Early Stage Investing: 1999 All Over Again?
[email protected]
DISCLAIMER Source of all data in this presentation: wild guesses
and random numbers found on the Internet.
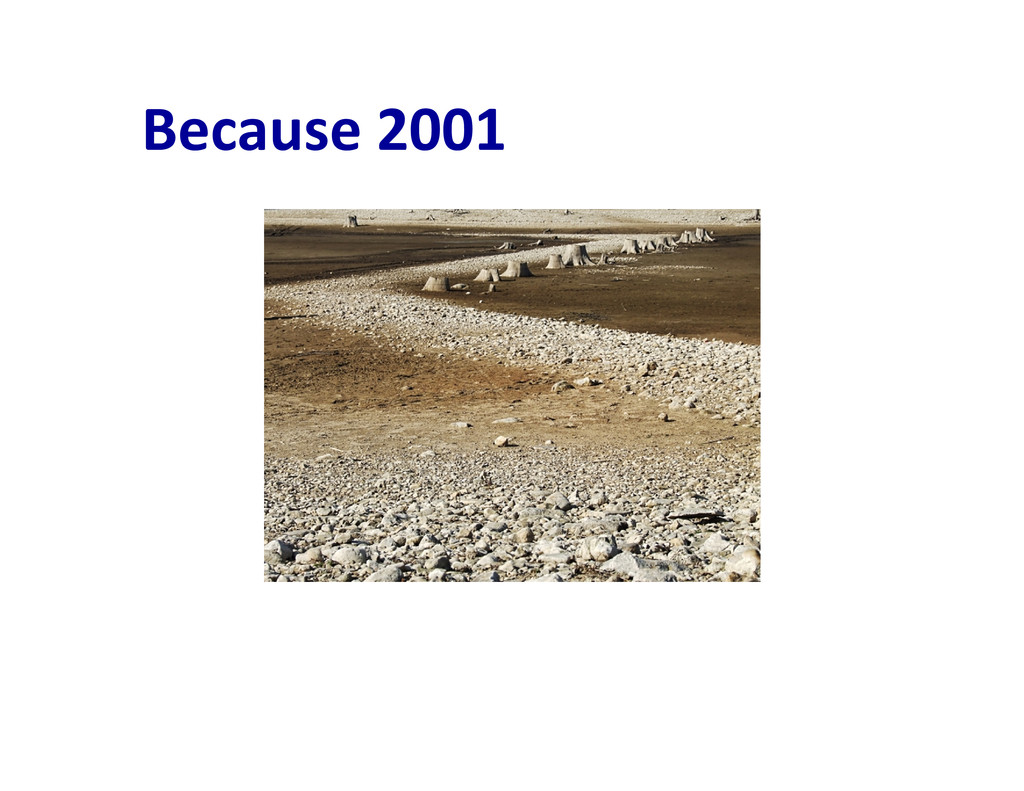
Why 1999?
Because 2001
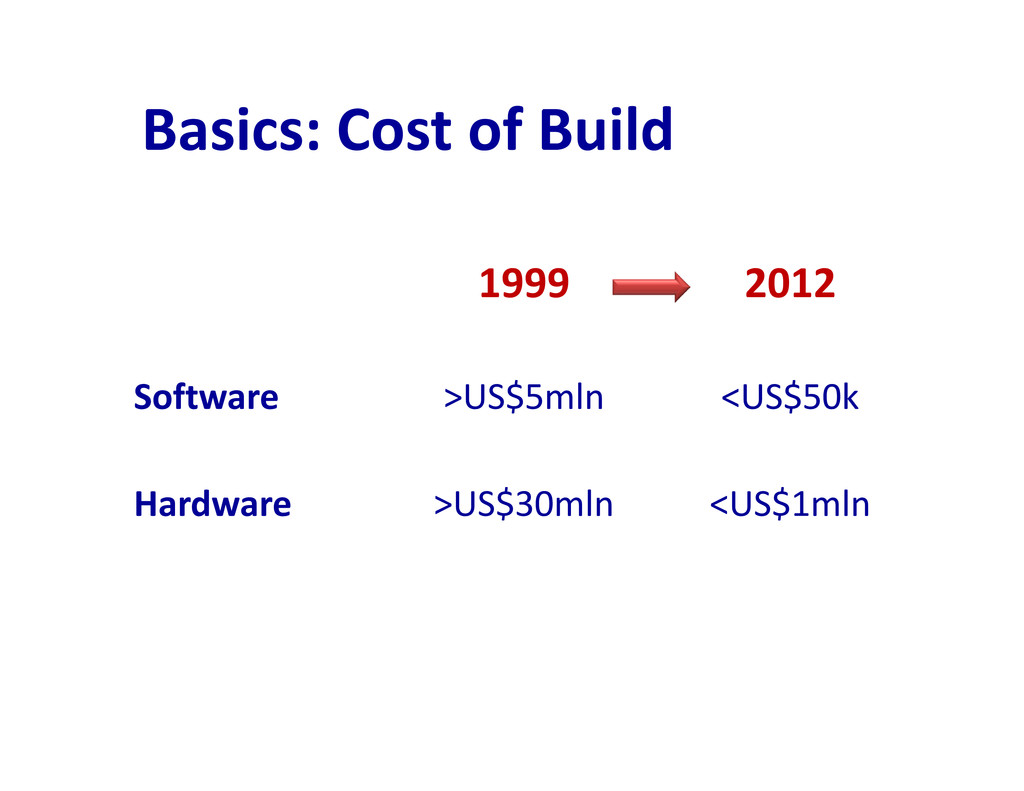
Basics: Cost of Build 1999 2012 Software >US$5mln <US$50k Hardware
>US$30mln <US$1mln
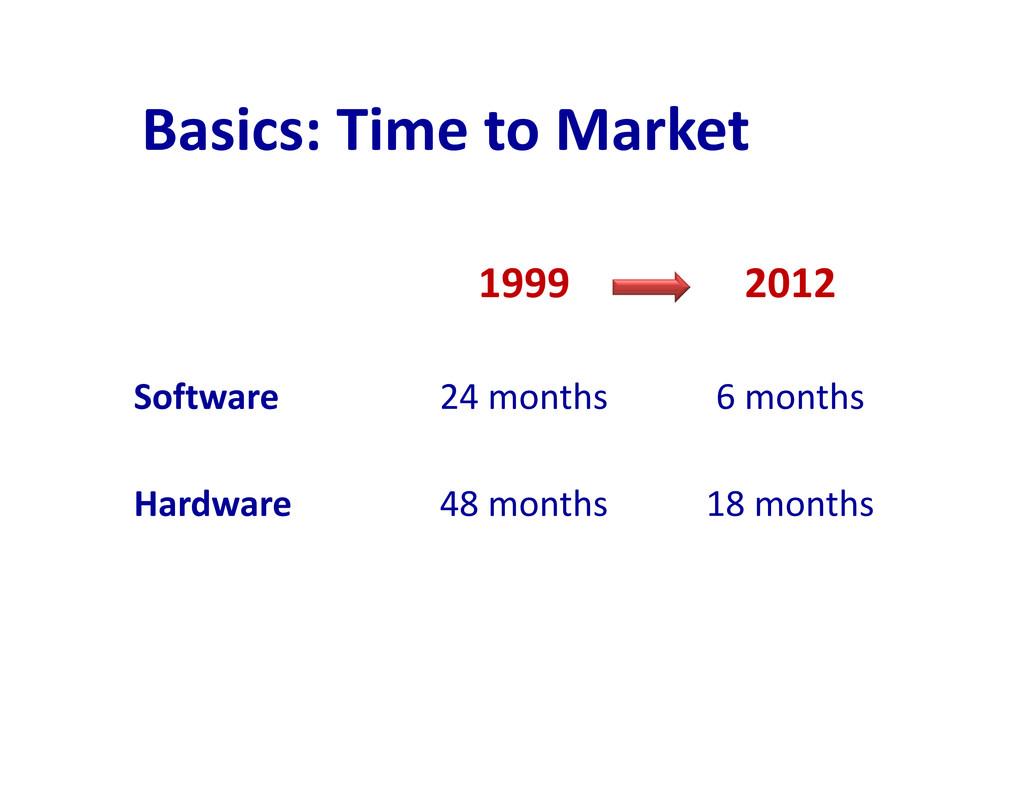
Basics: Time to Market 1999 2012 Software 24 months 6
months Hardware 48 months 18 months
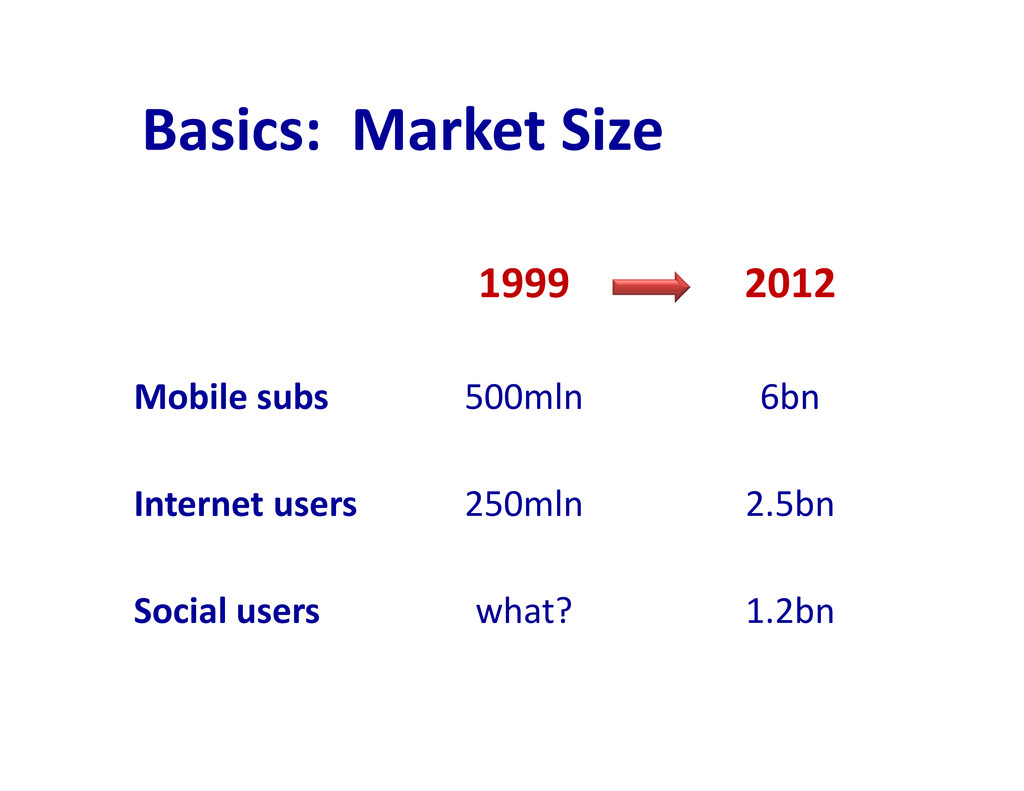
Basics: Market Size 1999 2012 Mobile subs 500mln 6bn Internet
users 250mln 2.5bn Social users what? 1.2bn
Basics: Massive Change 1999 2012 Cost of build 50x cheaper
Time to market 3x faster Market size 10x bigger
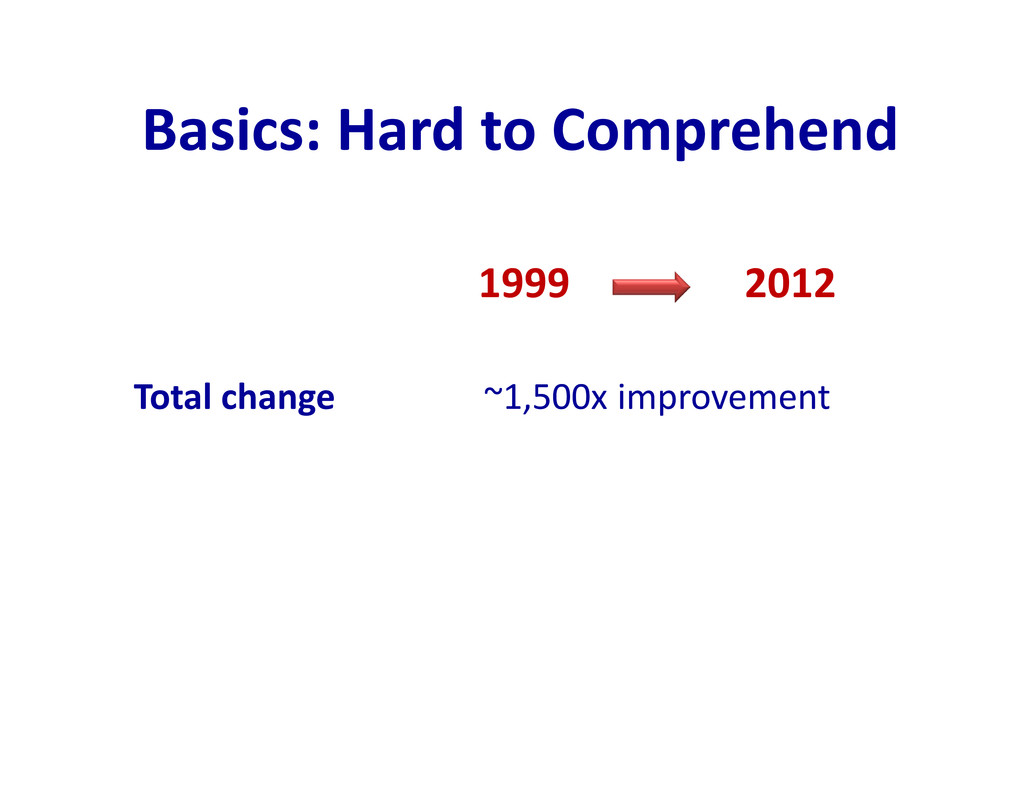
Basics: Hard to Comprehend 1999 2012 Total change ~1,500x improvement
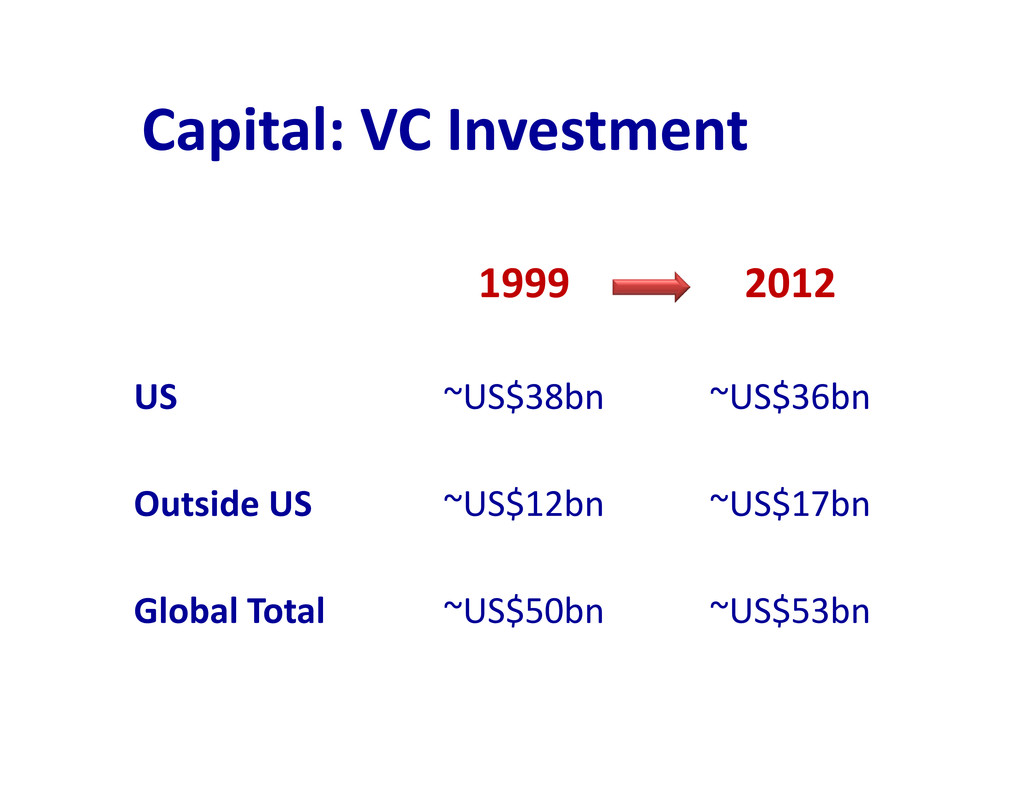
Capital: VC Investment 1999 2012 US ~US$38bn ~US$36bn Outside US
~US$12bn ~US$17bn Global Total ~US$50bn ~US$53bn
Capital: Angel Investment 1999 2012 US ~US$36bn ~US$25bn Outside US
~US$8bn ~US$15bn Global Total ~US$44bn ~US$40bn
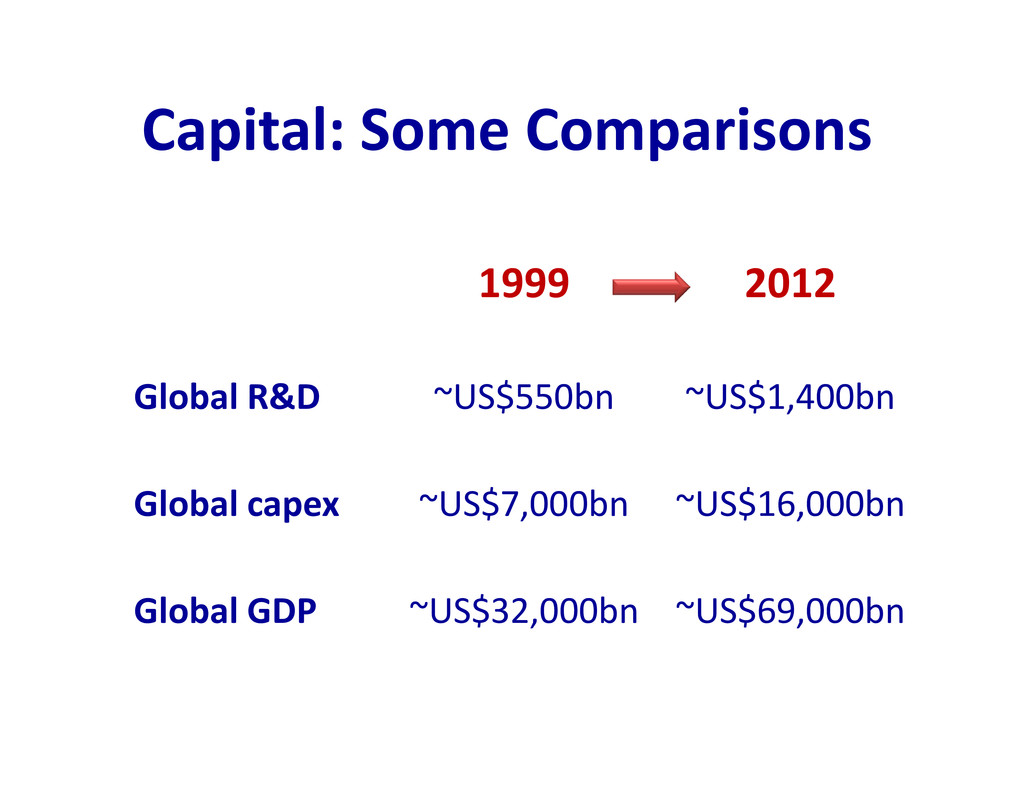
Capital: Some Comparisons 1999 2012 Global R&D ~US$550bn ~US$1,400bn Global
capex ~US$7,000bn ~US$16,000bn Global GDP ~US$32,000bn ~US$69,000bn
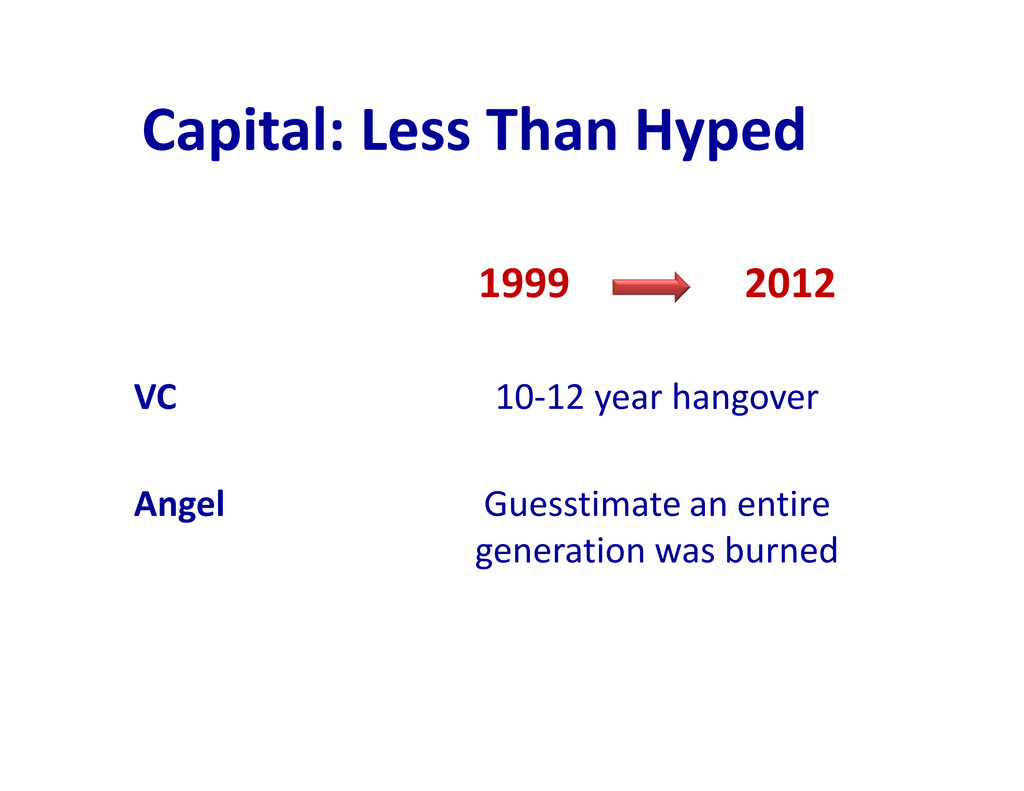
Capital: Less Than Hyped 1999 2012 VC 10-12 year hangover
Angel Guesstimate an entire generation was burned
Wildcards: Emerging Areas Some Examples as of 2011 Genomics 30k
human genomes sequenced 3D printing 30k 3D printers installed base Space 500 visitors to space
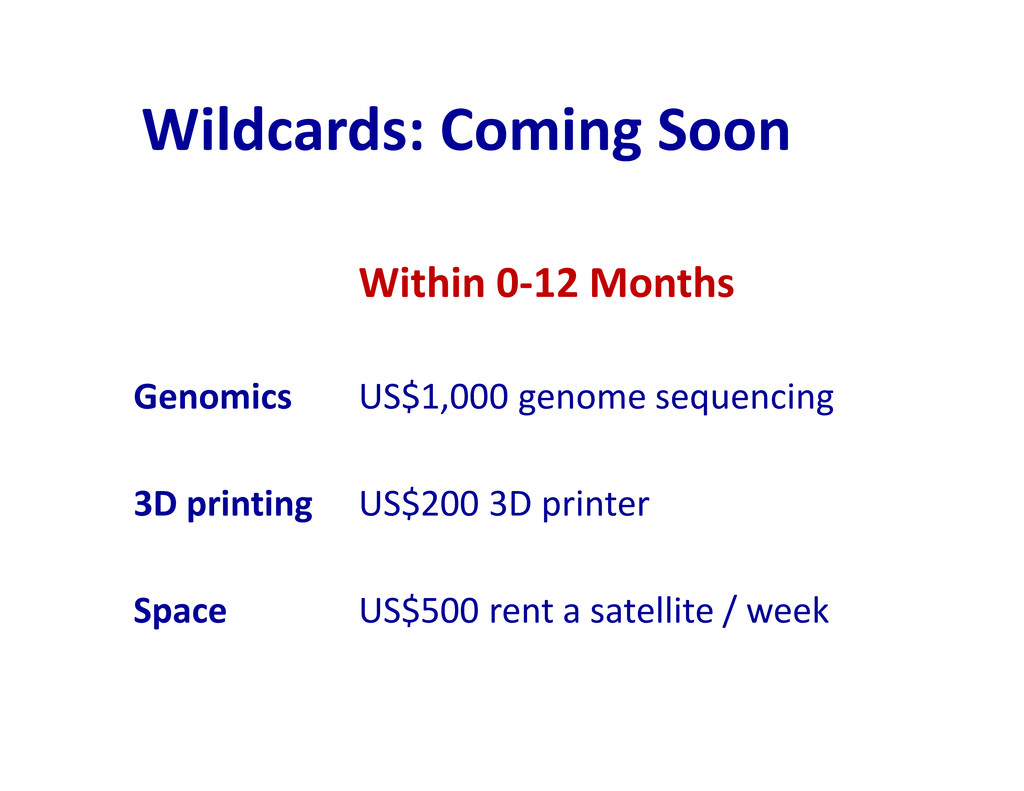
Wildcards: Coming Soon Within 0-12 Months Genomics US$1,000 genome sequencing
3D printing US$200 3D printer Space US$500 rent a satellite / week
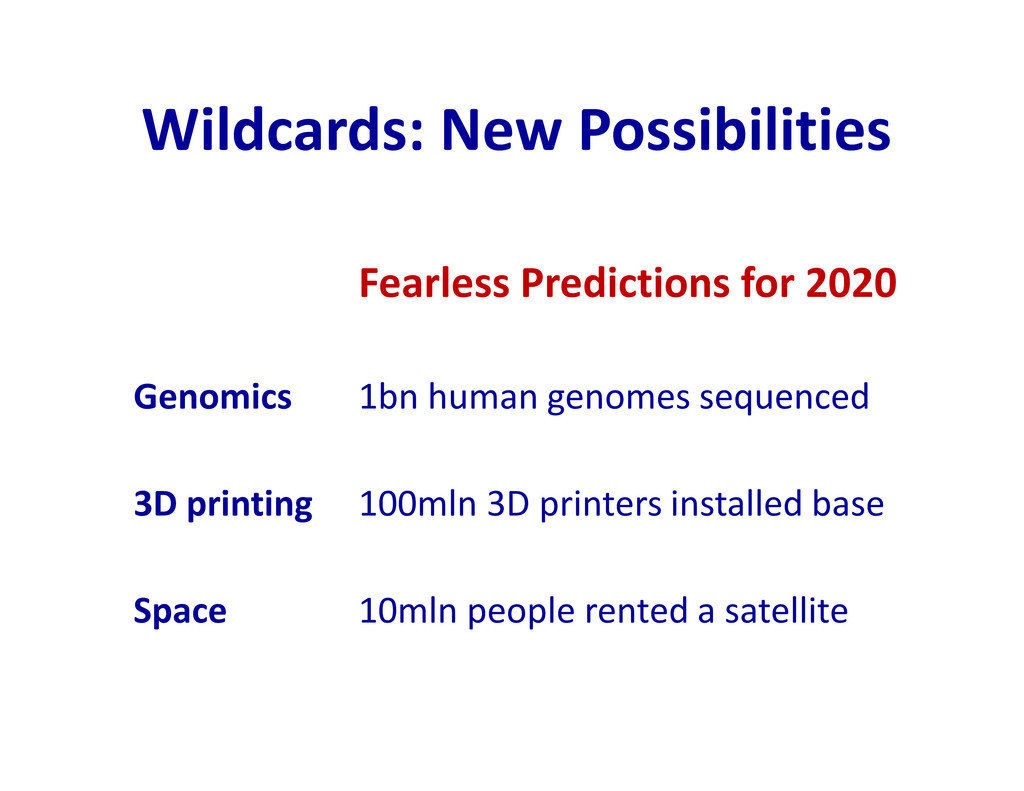
Wildcards: New Possibilities Fearless Predictions for 2020 Genomics 1bn human
genomes sequenced 3D printing 100mln 3D printers installed base Space 10mln people rented a satellite
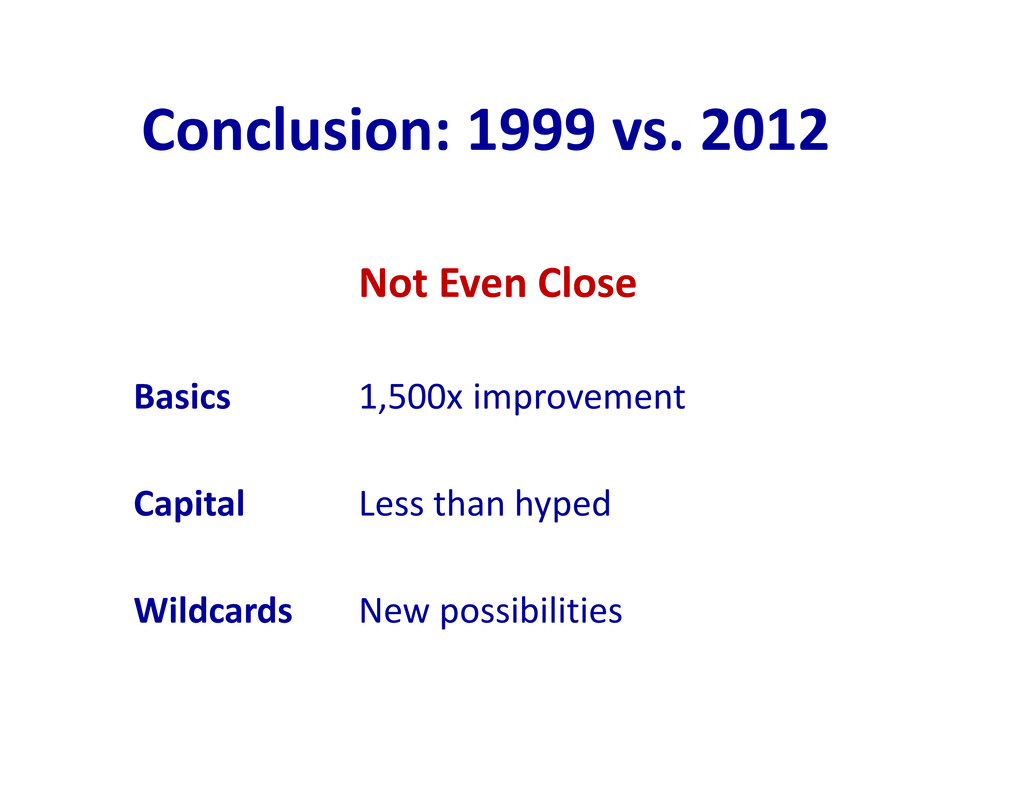
Conclusion: 1999 vs. 2012 Not Even Close Basics 1,500x improvement
Capital Less than hyped Wildcards New possibilities
“Compared with what we ought to be, we are only
half-awake.” - William James
[email protected]
![Early Stage Investing: 1999 All Over Again? [email protected]](https://files.speakerdeck.com/presentations/59cd48101b280130270e1231380fad16/slide_0.jpg)