FCCM Professor of Neurology and Neurosurgery Chief of Stroke and Neurocritical Care Division Department of Neurology Rutgers, The State University of New Jersey Robert Wood Johnson Medical School Chief of Neurology Director of Comprehensive Stroke Center Director of Neuro Intensive Care Unit Robert Wood Johnson University Hospital
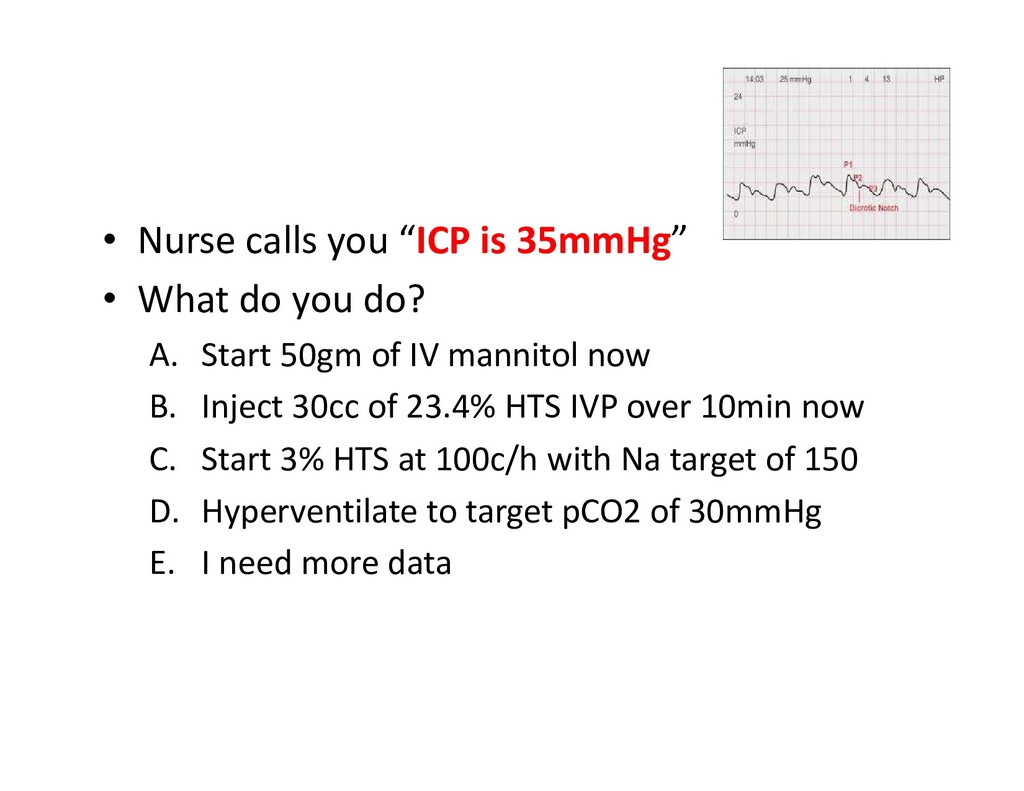
you do? A. Start 50gm of IV mannitol now B. Inject 30cc of 23.4% HTS IVP over 10min now C. Start 3% HTS at 100c/h with Na target of 150 D. Hyperventilate to target pCO2 of 30mmHg E. I need more data
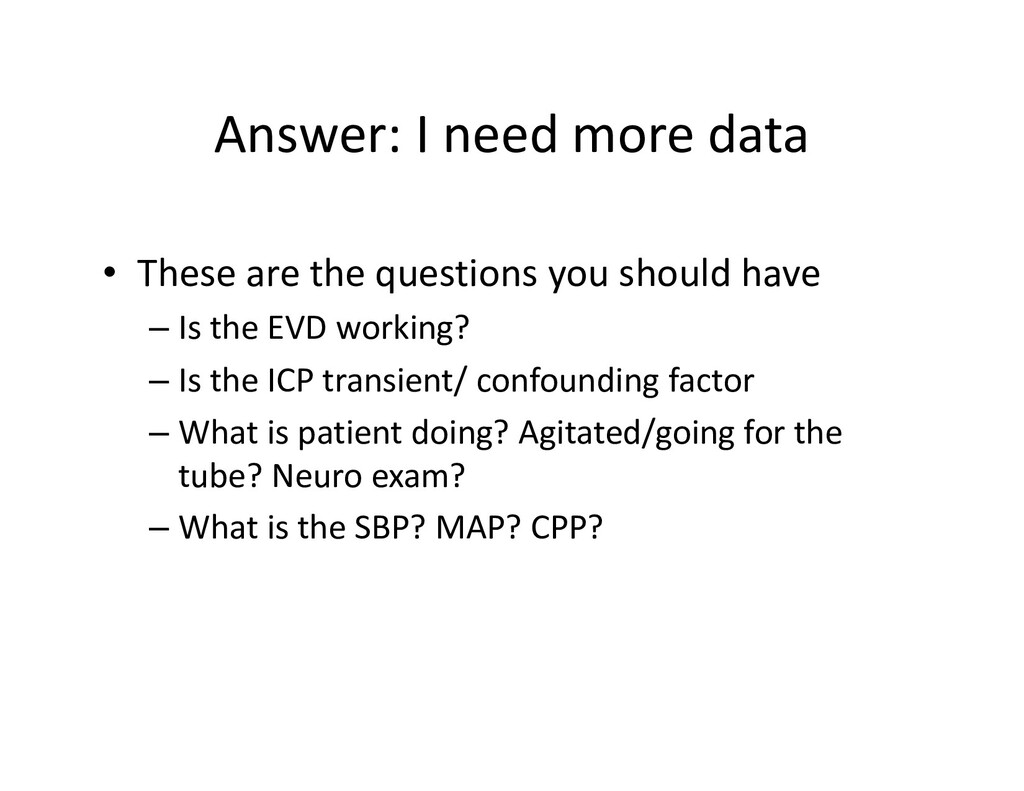
you should have – Is the EVD working? – Is the ICP transient/ confounding factor – What is patient doing? Agitated/going for the tube? Neuro exam? – What is the SBP? MAP? CPP?
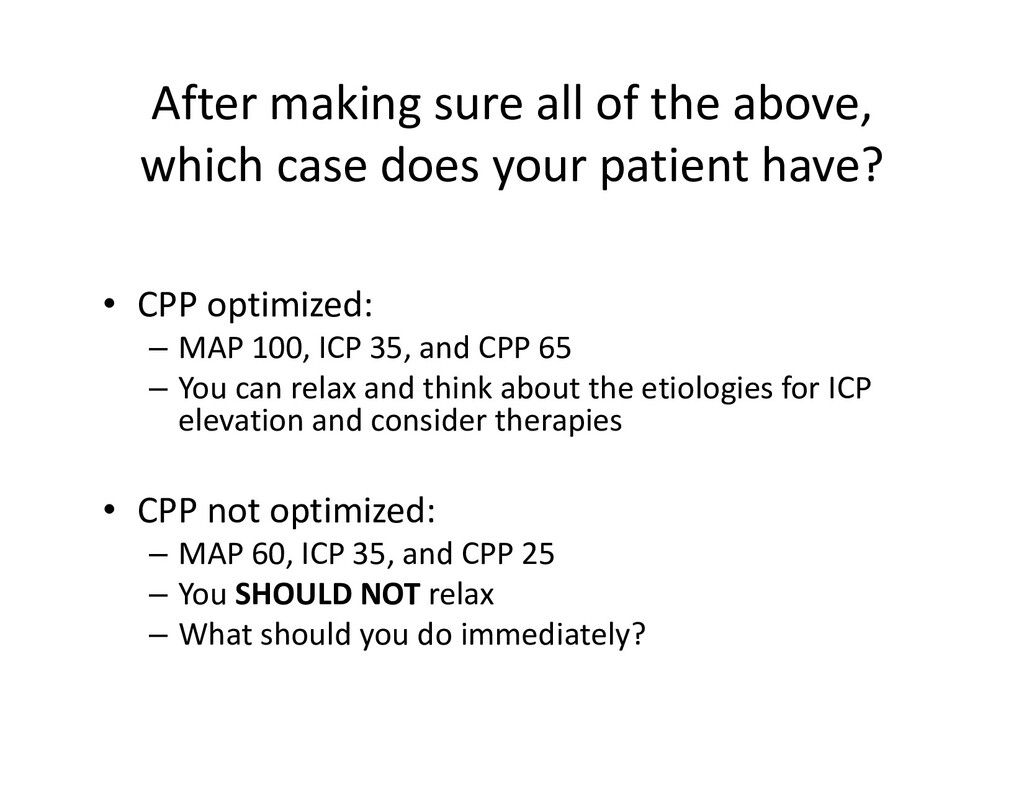
your patient have? • CPP optimized: – MAP 100, ICP 35, and CPP 65 – You can relax and think about the etiologies for ICP elevation and consider therapies • CPP not optimized: – MAP 60, ICP 35, and CPP 25 – You SHOULD NOT relax – What should you do immediately?
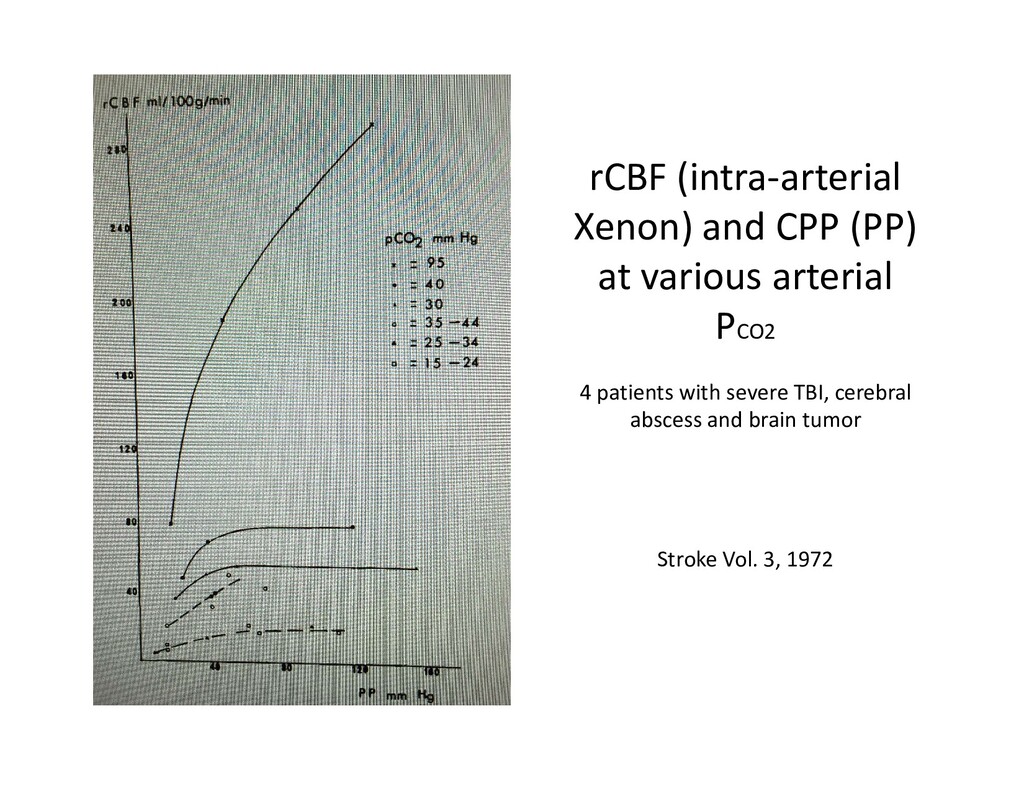
Pressure and Regional Cerebral Blood Flow in Patients With Severe Neurological Disorders • BY M. PETER HEILBRUN, M.D.,* PAUL BALSLEV JORGENSEN, M.D., AND GUDRUN BOYSEN, M.D. • Stroke, Vol 3, March-April, 1972
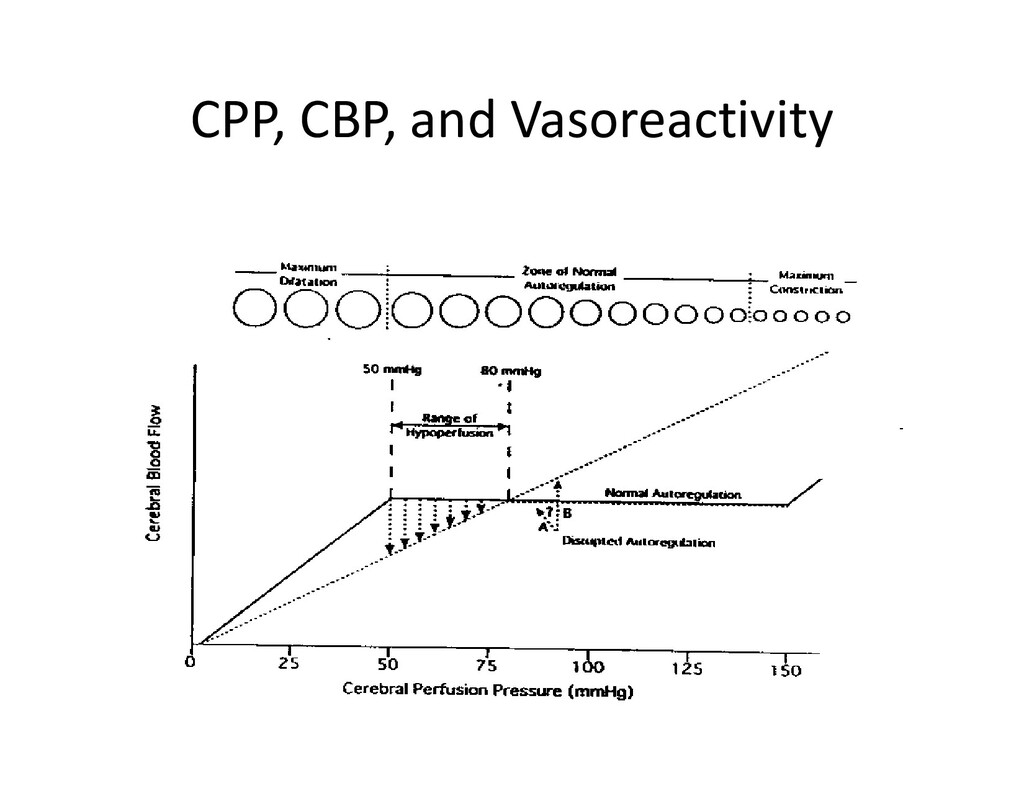
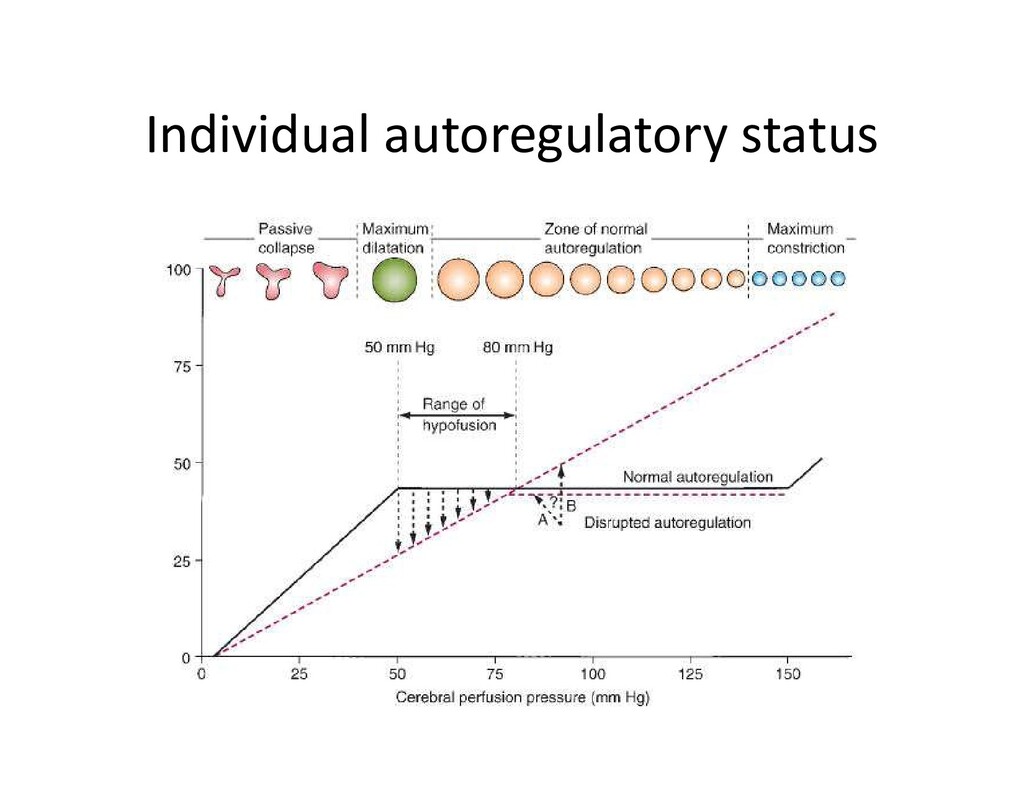
and CBF show very clearly that… When the CPP falls below the normal autoregulatory range, by combination of either ICP increases or systemic BP decreases, both normal and damaged brain tissue reacts with a pressure passive flow response… When CPP falls close to zero, there was cessation of flow”
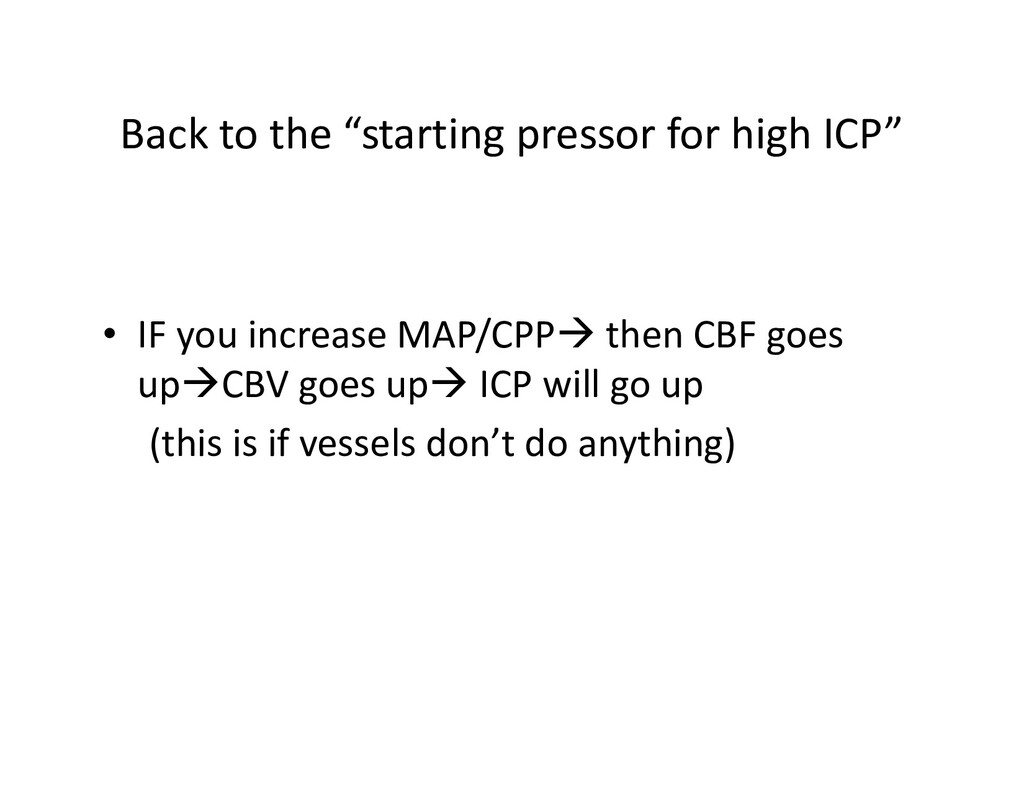
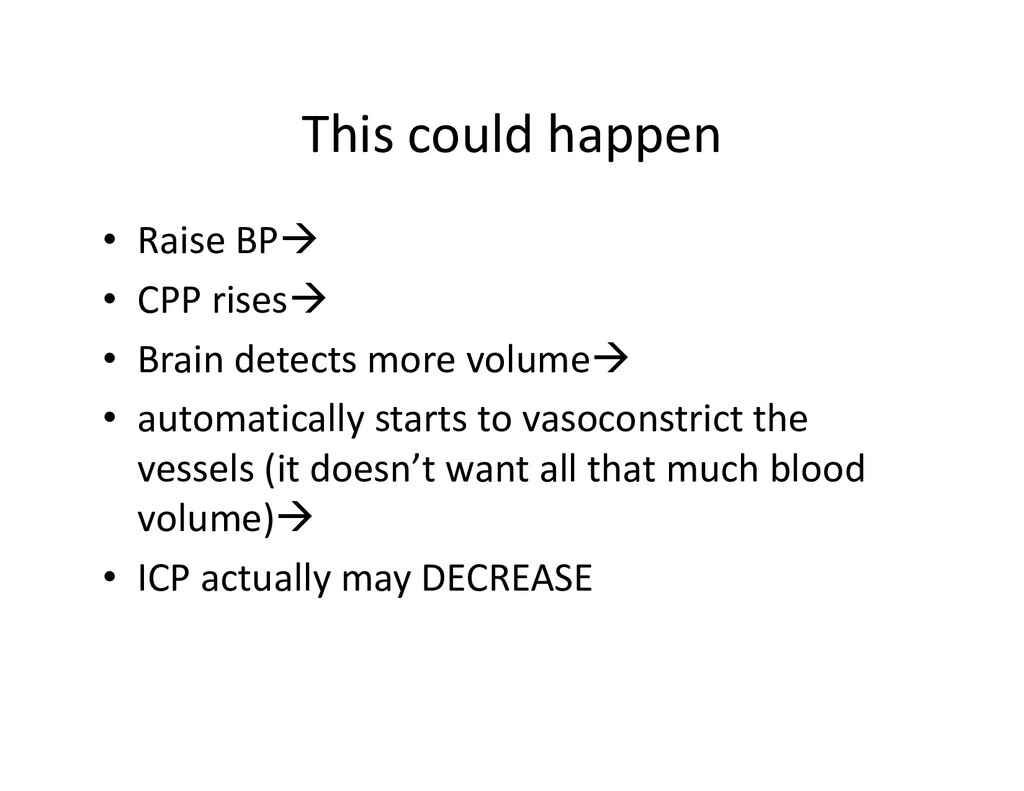
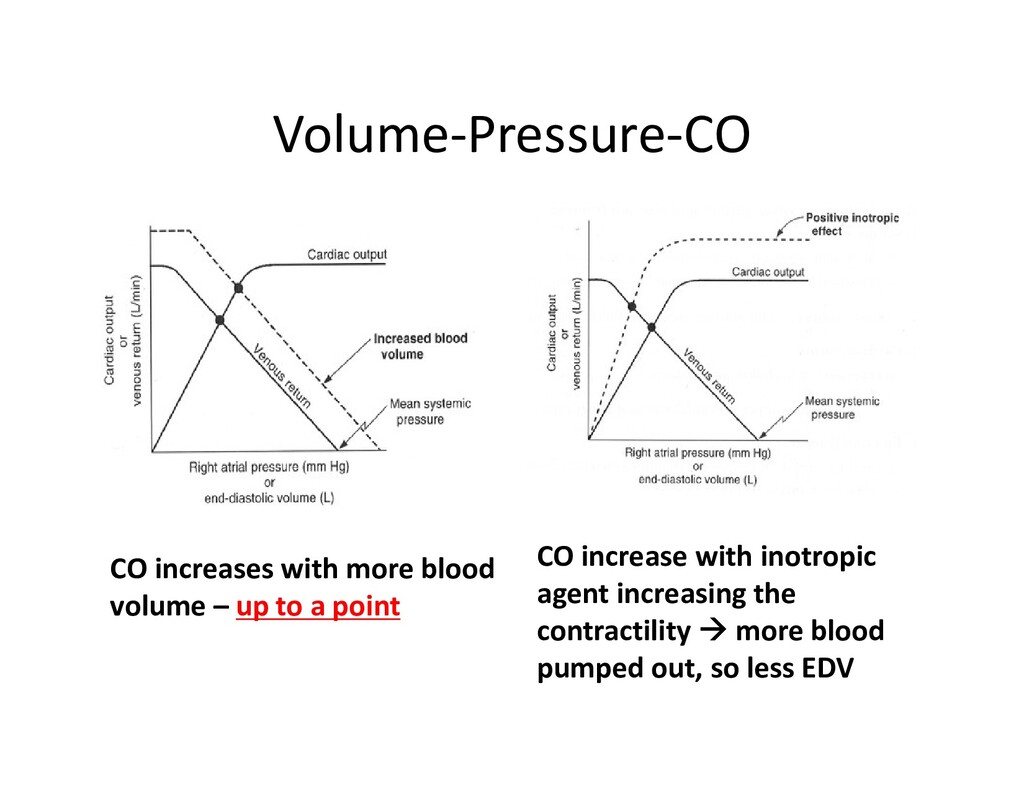
Brain detects more volume • automatically starts to vasoconstrict the vessels (it doesn’t want all that much blood volume) • ICP actually may DECREASE
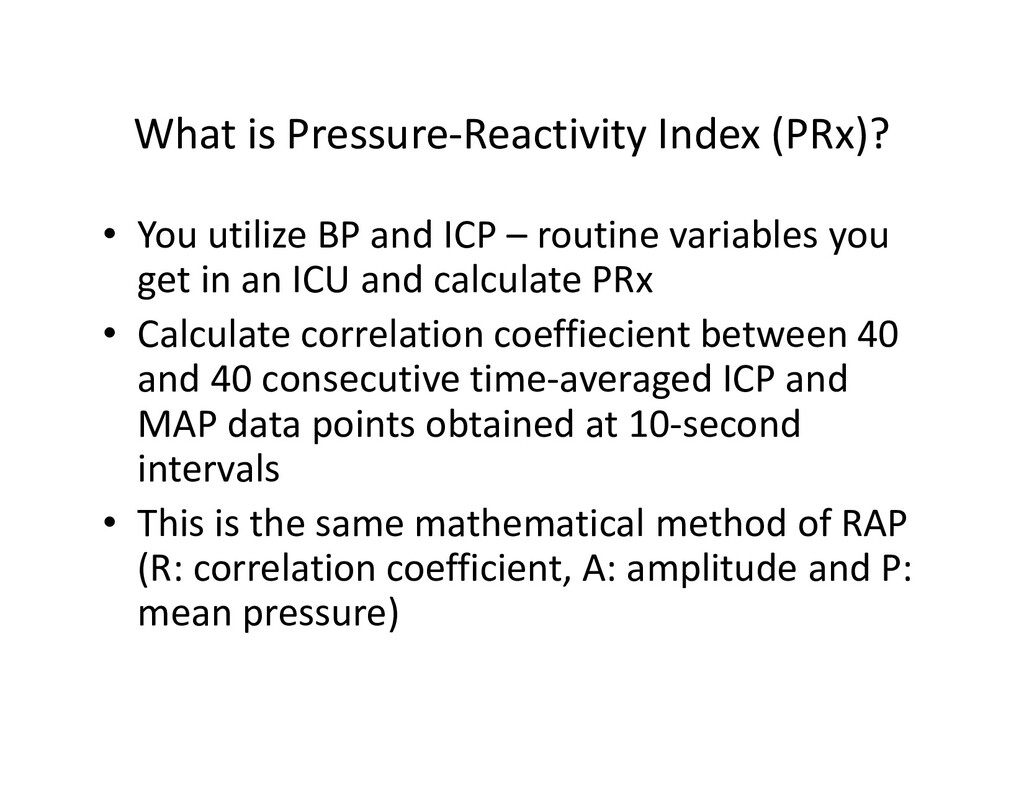
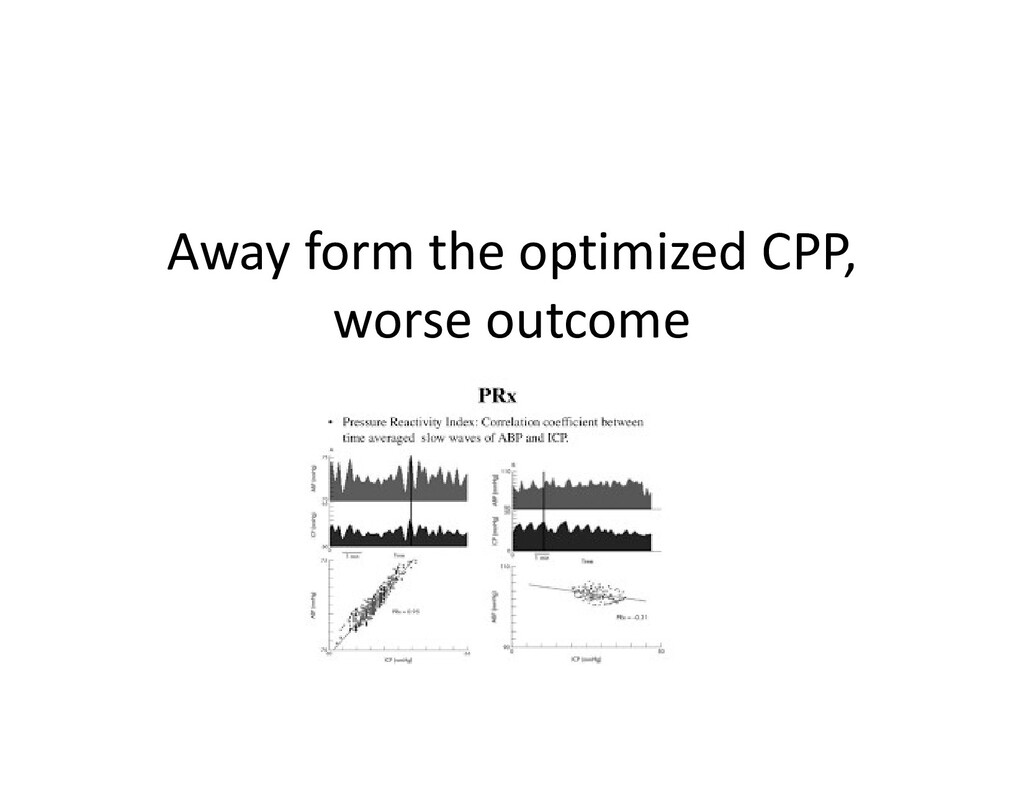
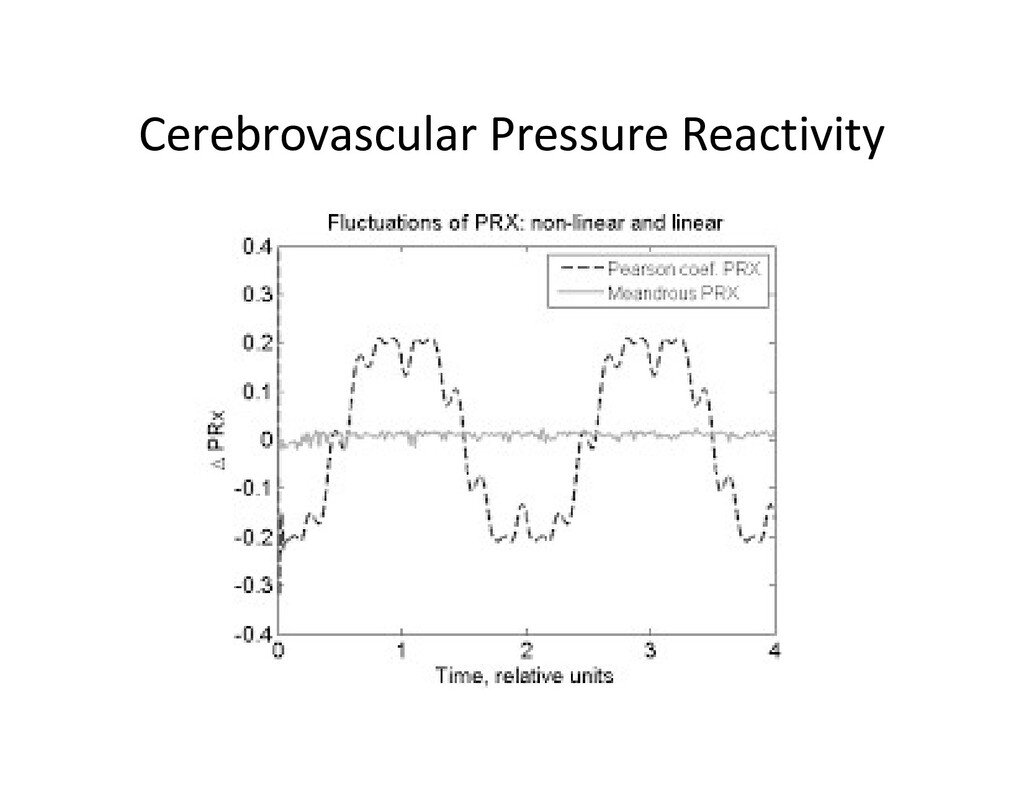
ICP – routine variables you get in an ICU and calculate PRx • Calculate correlation coeffiecient between 40 and 40 consecutive time-averaged ICP and MAP data points obtained at 10-second intervals • This is the same mathematical method of RAP (R: correlation coefficient, A: amplitude and P: mean pressure)
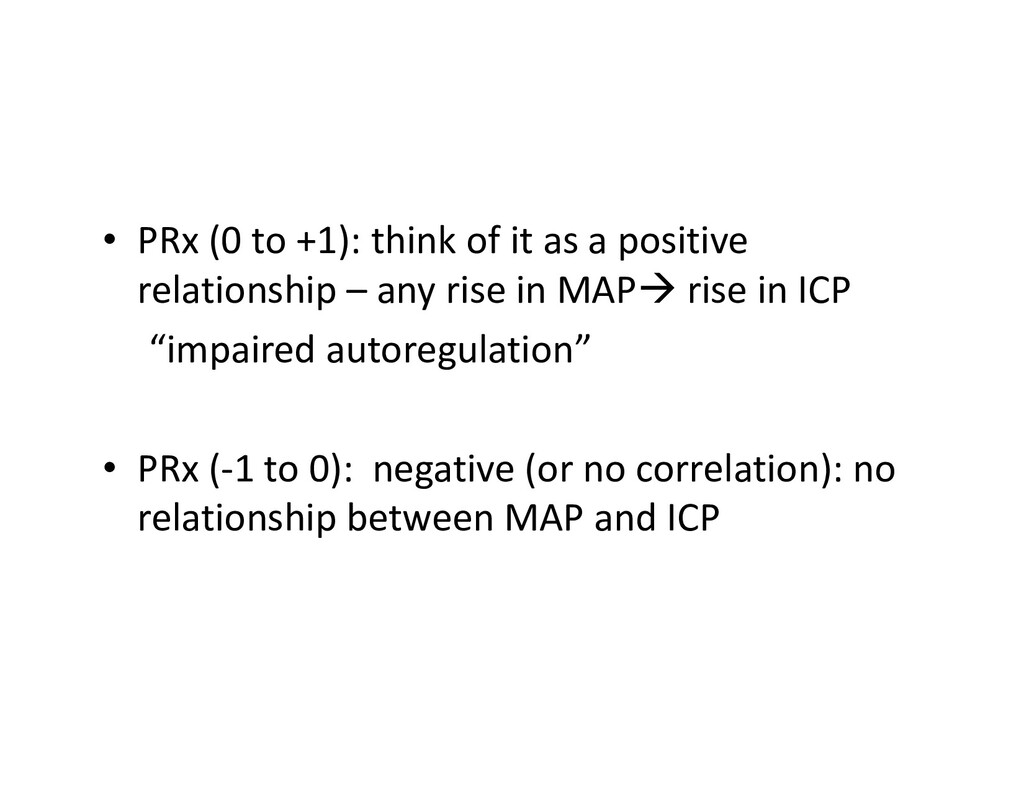
positive relationship – any rise in MAP rise in ICP “impaired autoregulation” • PRx (-1 to 0): negative (or no correlation): no relationship between MAP and ICP
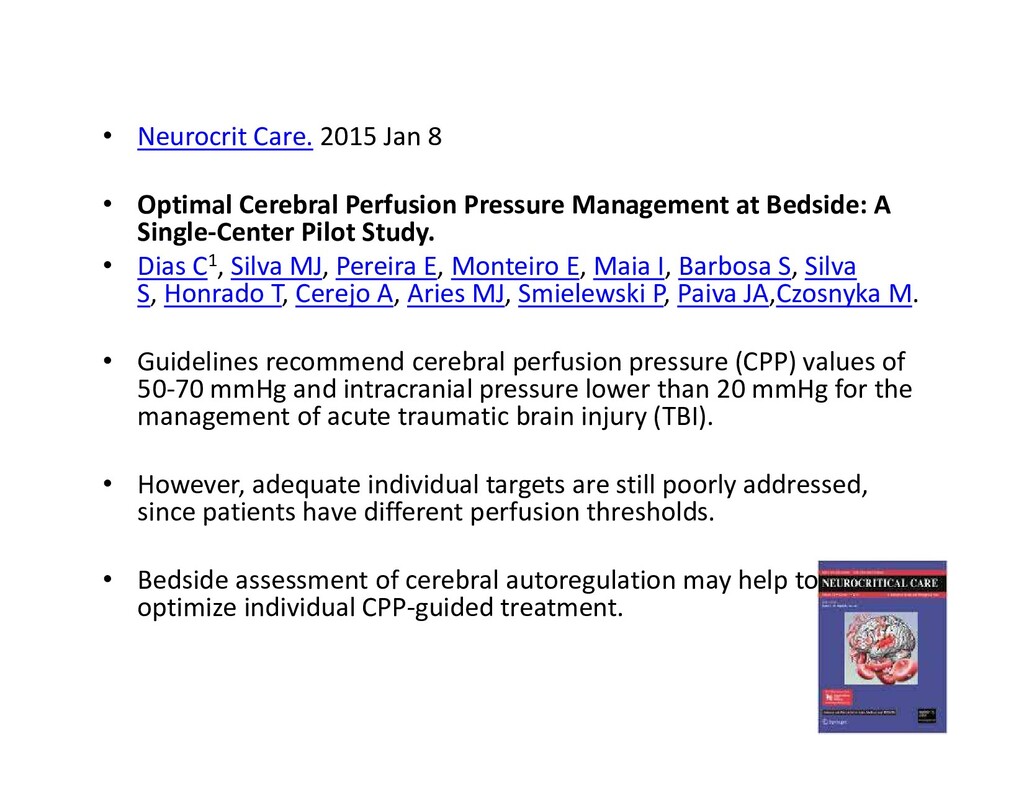
Pressure Management at Bedside: A Single-Center Pilot Study. • Dias C1, Silva MJ, Pereira E, Monteiro E, Maia I, Barbosa S, Silva S, Honrado T, Cerejo A, Aries MJ, Smielewski P, Paiva JA,Czosnyka M. • Guidelines recommend cerebral perfusion pressure (CPP) values of 50-70 mmHg and intracranial pressure lower than 20 mmHg for the management of acute traumatic brain injury (TBI). • However, adequate individual targets are still poorly addressed, since patients have different perfusion thresholds. • Bedside assessment of cerebral autoregulation may help to optimize individual CPP-guided treatment.
total multimodal brain monitoring time = 5,520 h • Preserved autoregulation was associated with greater Glasgow coma score on admission (p = 0.01) and better outcome (p = 0.01). • patients with the larger discrepancy (>10 mm Hg) between real CPP and CPPopt more likely have had adverse outcome (p = 0.04).
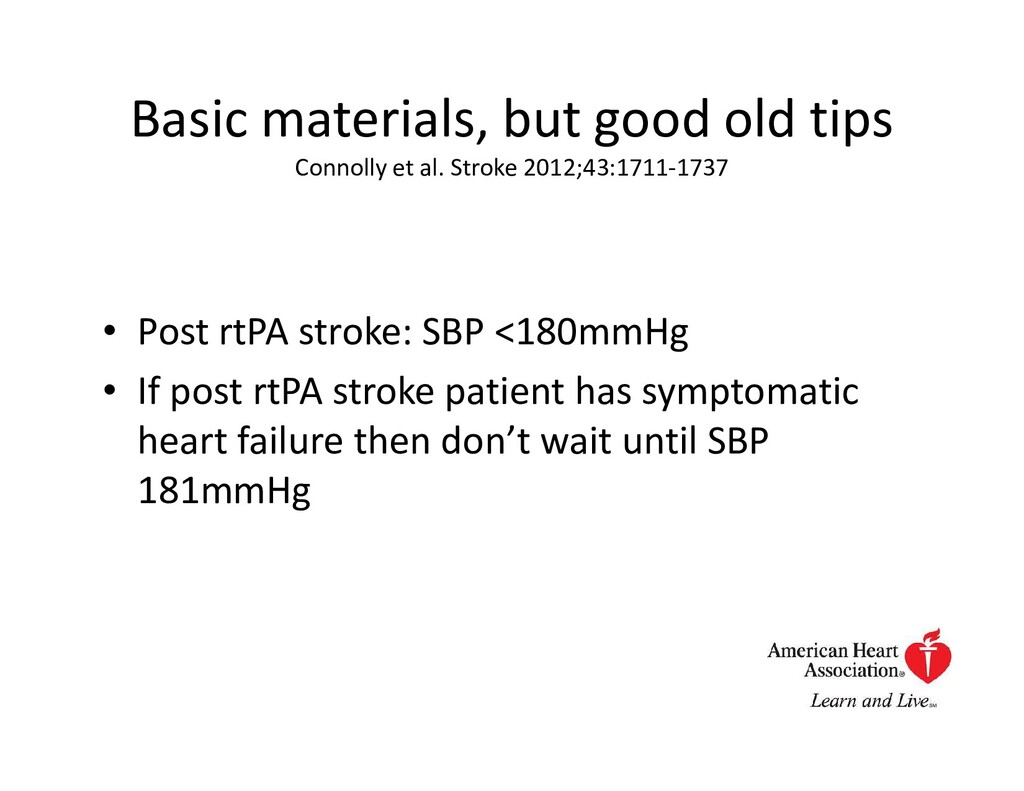
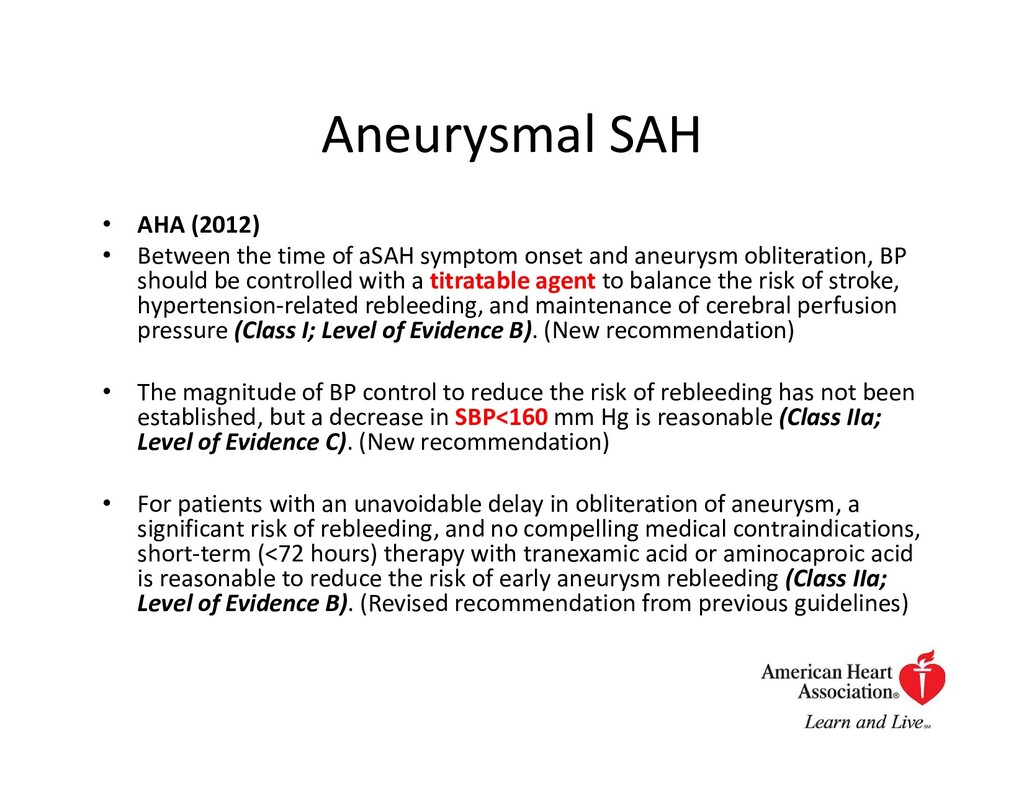
aSAH symptom onset and aneurysm obliteration, BP should be controlled with a titratable agent to balance the risk of stroke, hypertension-related rebleeding, and maintenance of cerebral perfusion pressure (Class I; Level of Evidence B). (New recommendation) • The magnitude of BP control to reduce the risk of rebleeding has not been established, but a decrease in SBP<160 mm Hg is reasonable (Class IIa; Level of Evidence C). (New recommendation) • For patients with an unavoidable delay in obliteration of aneurysm, a significant risk of rebleeding, and no compelling medical contraindications, short-term (<72 hours) therapy with tranexamic acid or aminocaproic acid is reasonable to reduce the risk of early aneurysm rebleeding (Class IIa; Level of Evidence B). (Revised recommendation from previous guidelines)
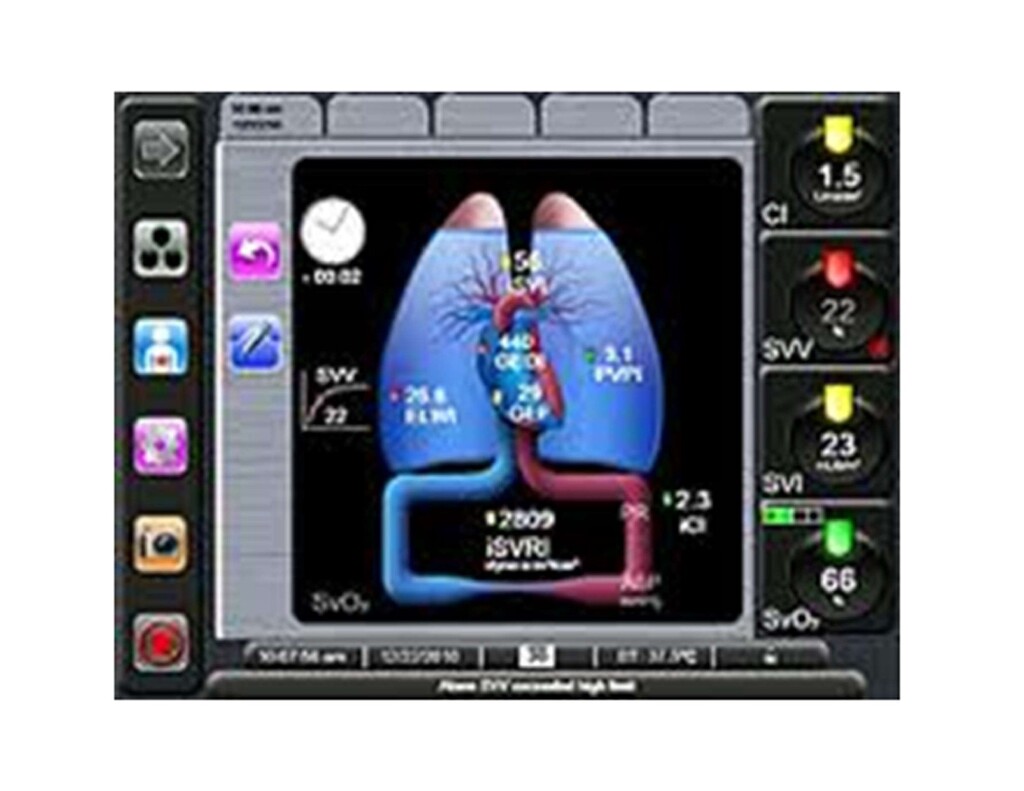
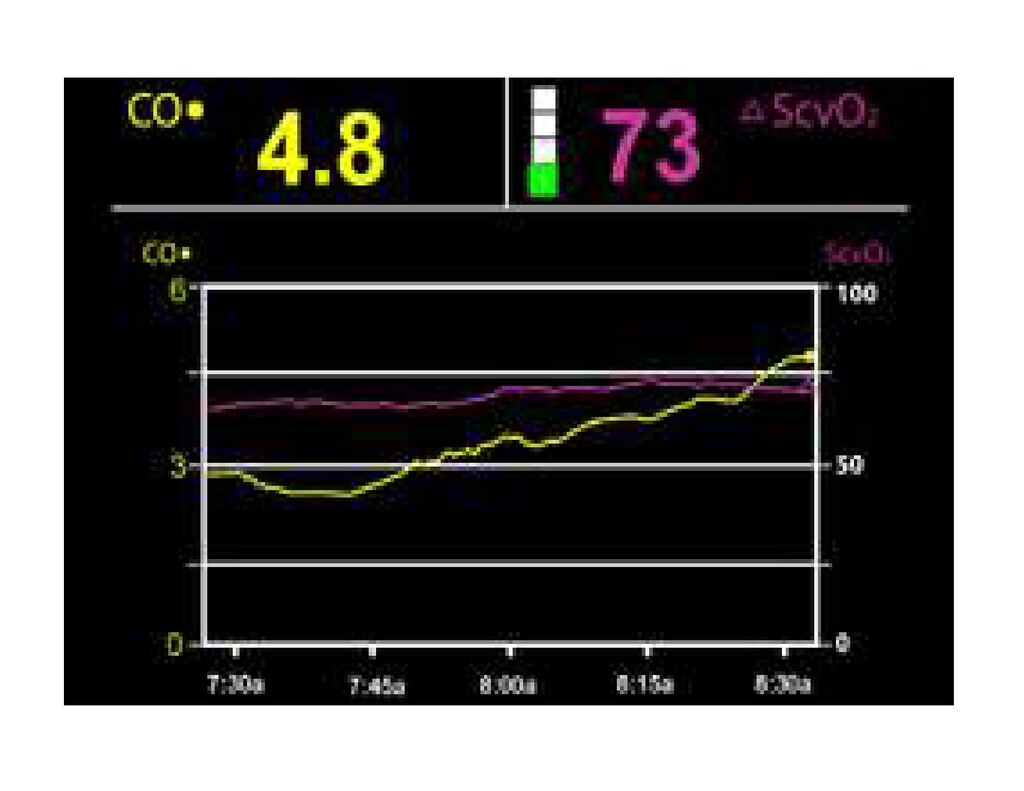
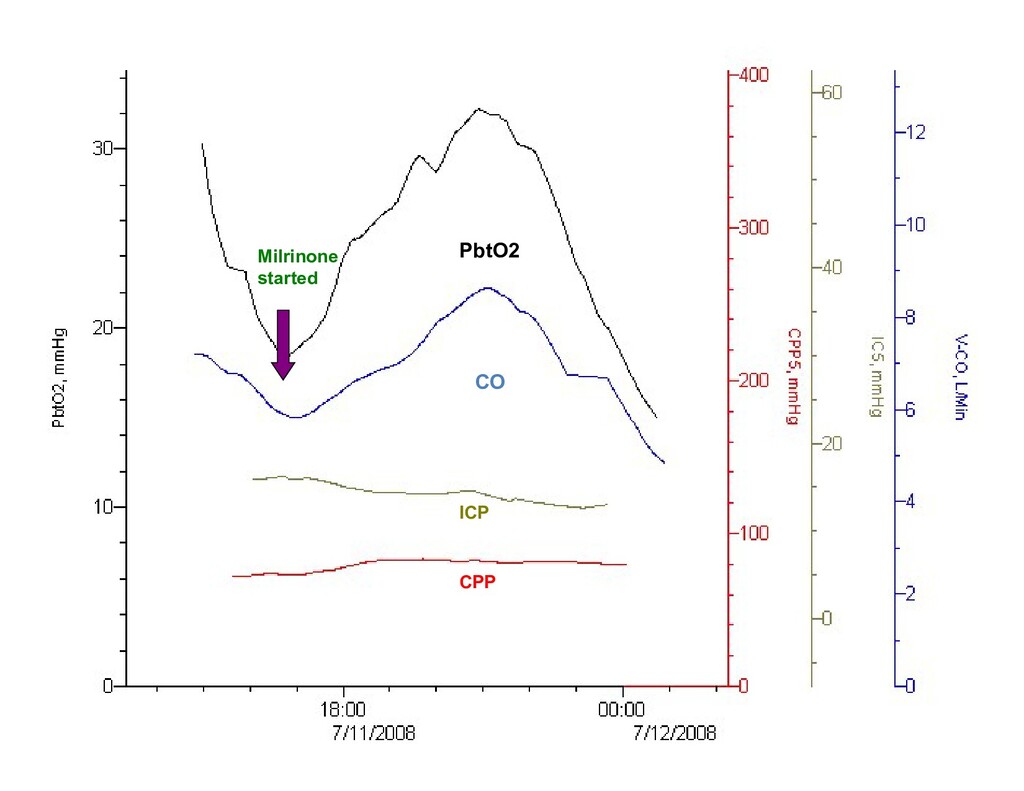
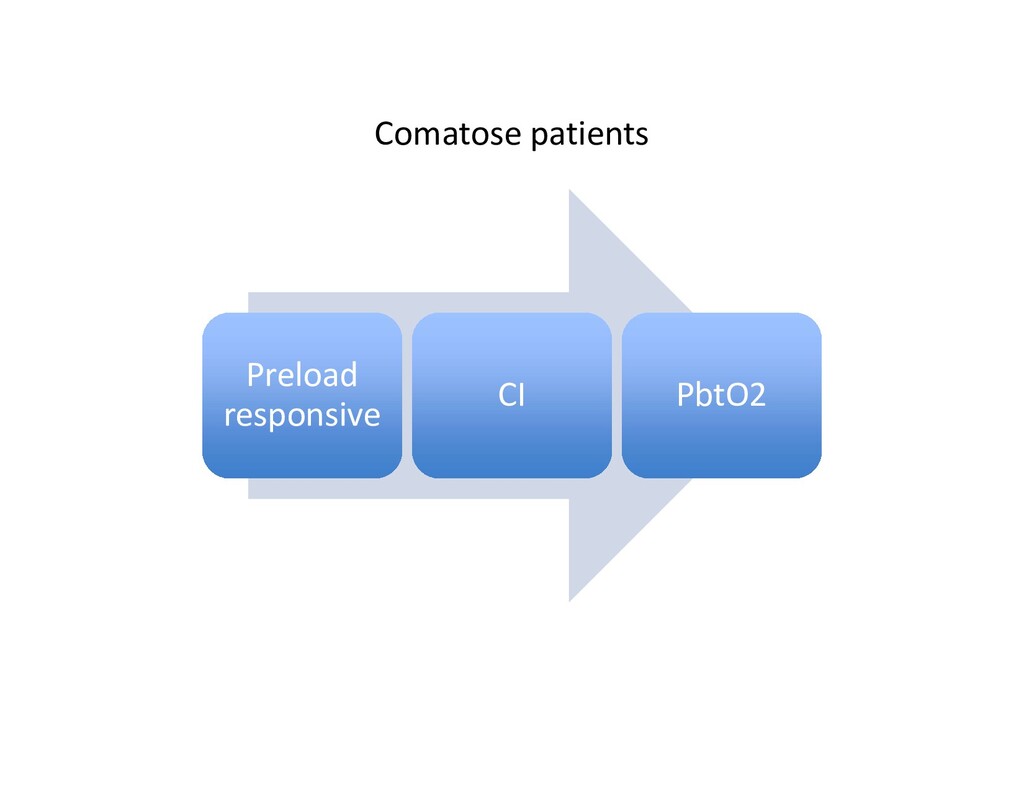
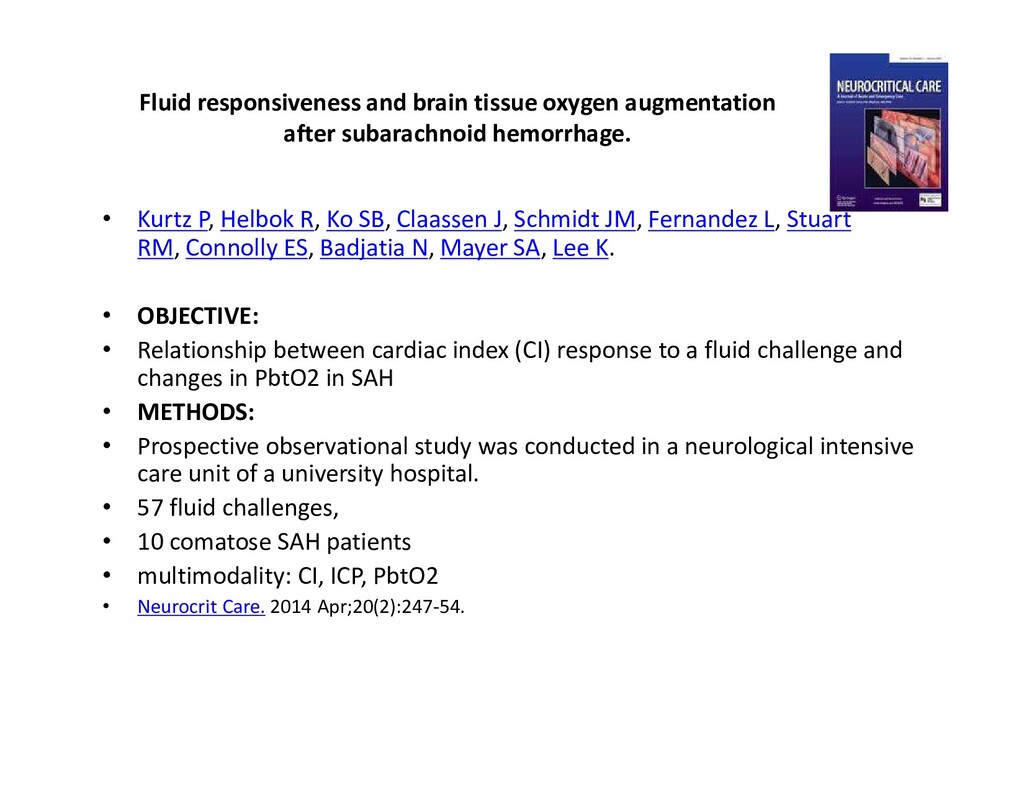
• Kurtz P, Helbok R, Ko SB, Claassen J, Schmidt JM, Fernandez L, Stuart RM, Connolly ES, Badjatia N, Mayer SA, Lee K. • OBJECTIVE: • Relationship between cardiac index (CI) response to a fluid challenge and changes in PbtO2 in SAH • METHODS: • Prospective observational study was conducted in a neurological intensive care unit of a university hospital. • 57 fluid challenges, • 10 comatose SAH patients • multimodality: CI, ICP, PbtO2 • Neurocrit Care. 2014 Apr;20(2):247-54.
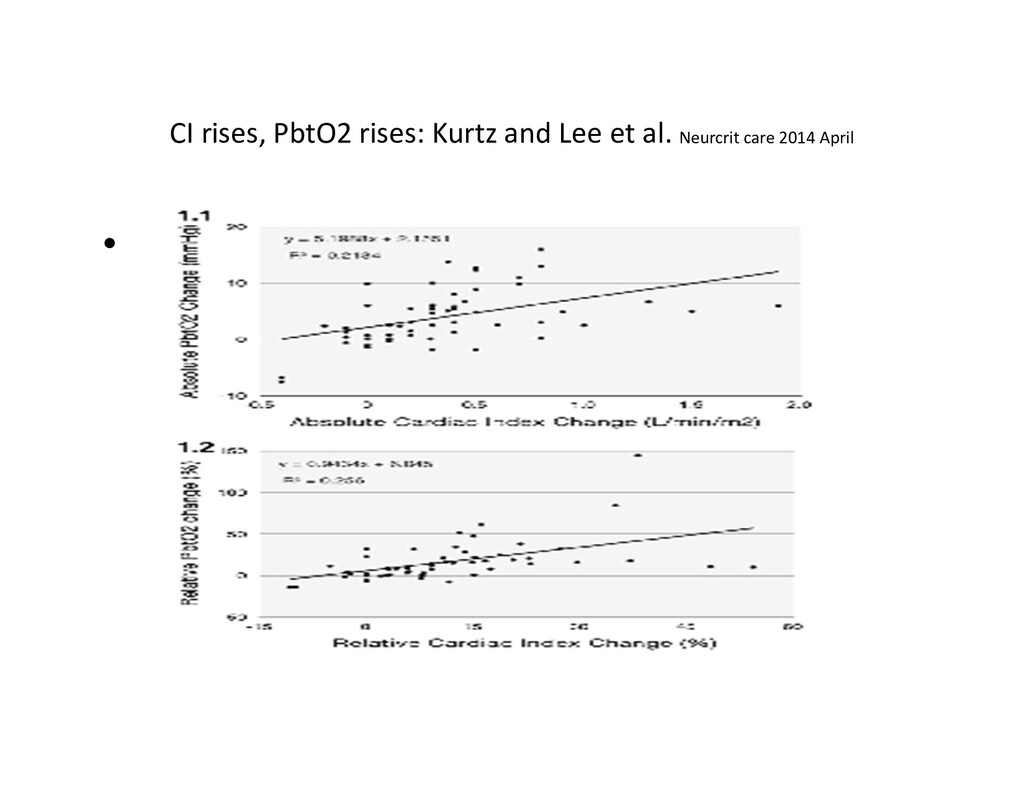
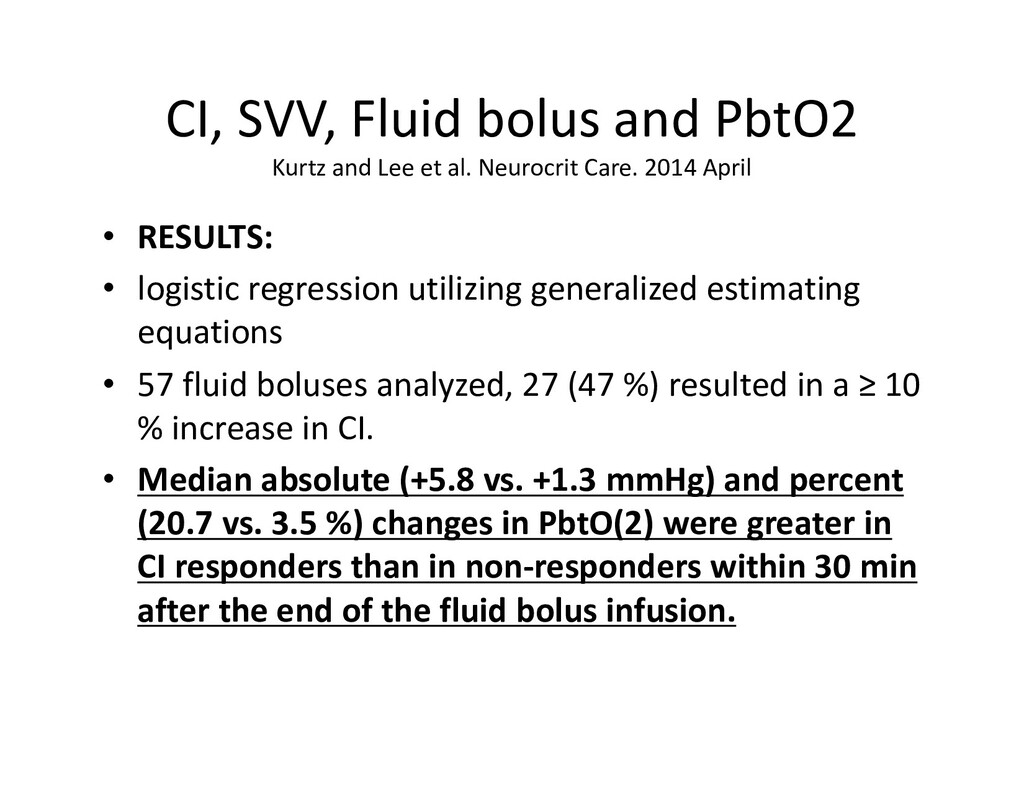
al. Neurocrit Care. 2014 April • RESULTS: • logistic regression utilizing generalized estimating equations • 57 fluid boluses analyzed, 27 (47 %) resulted in a ≥ 10 % increase in CI. • Median absolute (+5.8 vs. +1.3 mmHg) and percent (20.7 vs. 3.5 %) changes in PbtO(2) were greater in CI responders than in non-responders within 30 min after the end of the fluid bolus infusion.
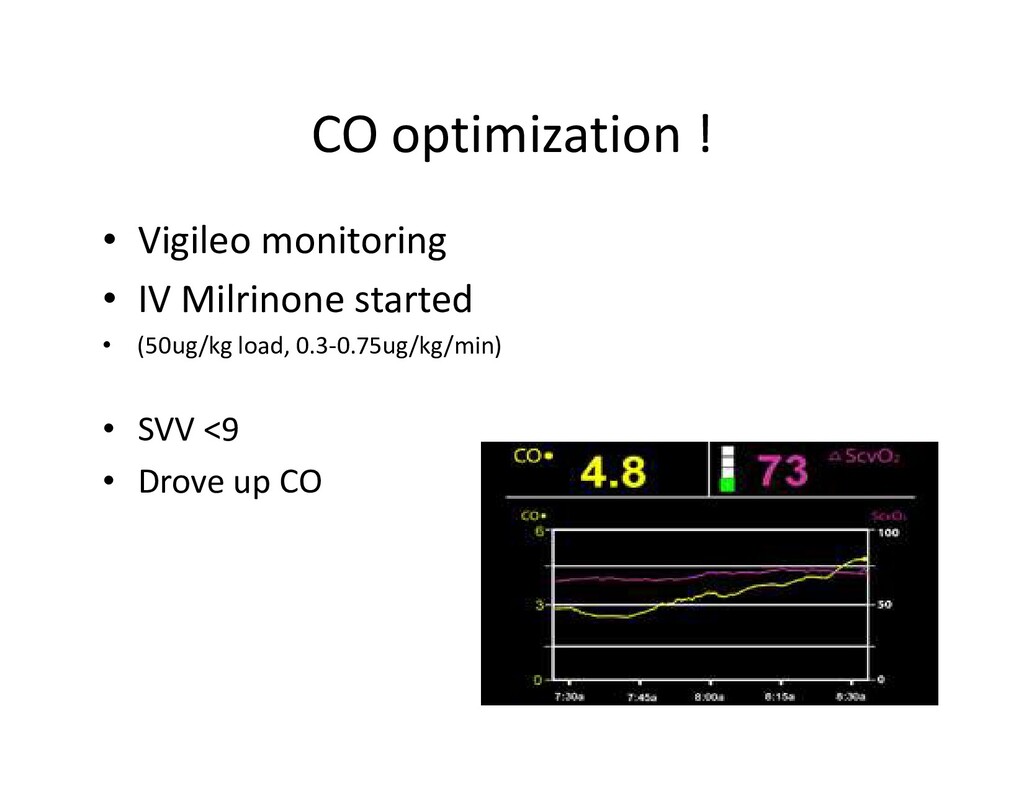
associated with PbtO(2) response (adjusted odds ratio 21.5, 95 % CI 1.4-324, P = 0.03) after adjusting for MAP change and end-tidal CO(2). • Stroke volume variation showed a good ability to predict CI and PbtO(2) response with areas under the ROC curve of 0.86 and 0.81 with the best cut-off SVV=9 % for both responses.
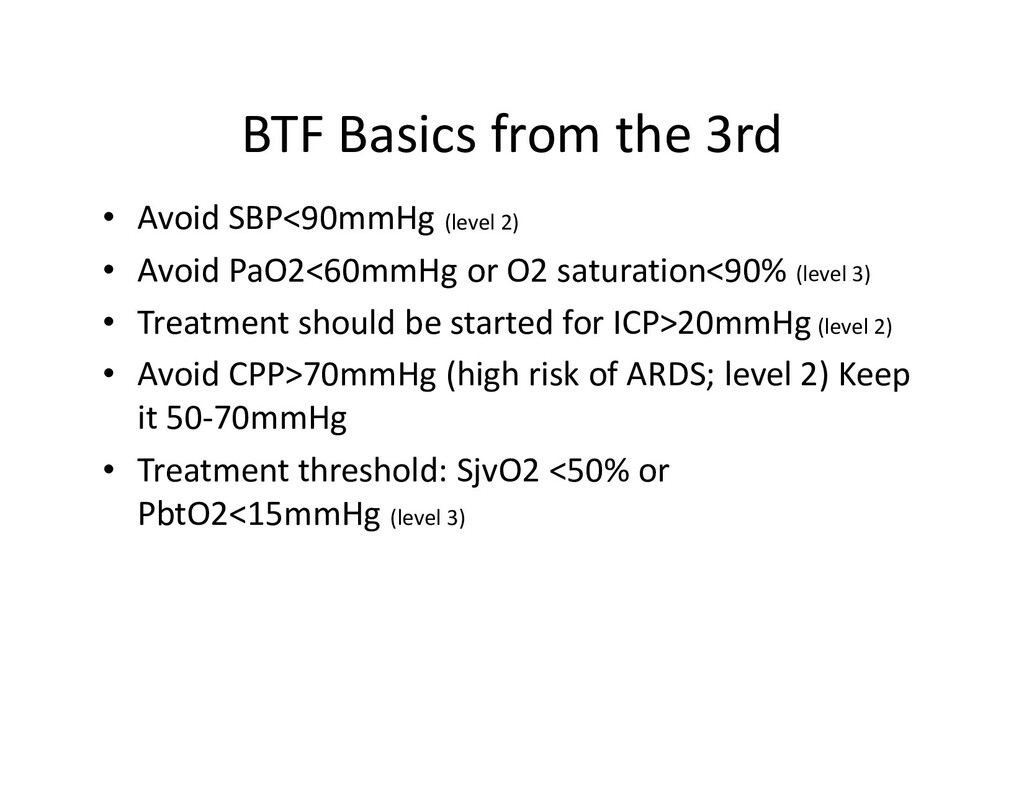
• Avoid PaO2<60mmHg or O2 saturation<90% (level 3) • Treatment should be started for ICP>20mmHg (level 2) • Avoid CPP>70mmHg (high risk of ARDS; level 2) Keep it 50-70mmHg • Treatment threshold: SjvO2 <50% or PbtO2<15mmHg (level 3)
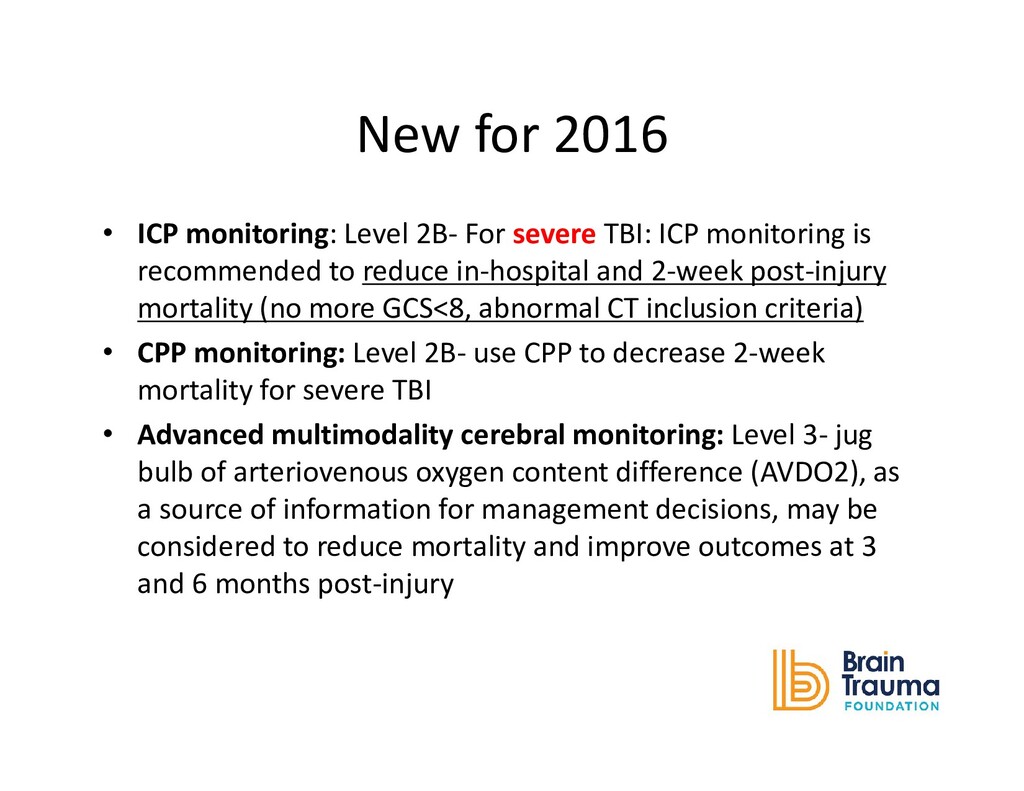
TBI: ICP monitoring is recommended to reduce in-hospital and 2-week post-injury mortality (no more GCS<8, abnormal CT inclusion criteria) • CPP monitoring: Level 2B- use CPP to decrease 2-week mortality for severe TBI • Advanced multimodality cerebral monitoring: Level 3- jug bulb of arteriovenous oxygen content difference (AVDO2), as a source of information for management decisions, may be considered to reduce mortality and improve outcomes at 3 and 6 months post-injury
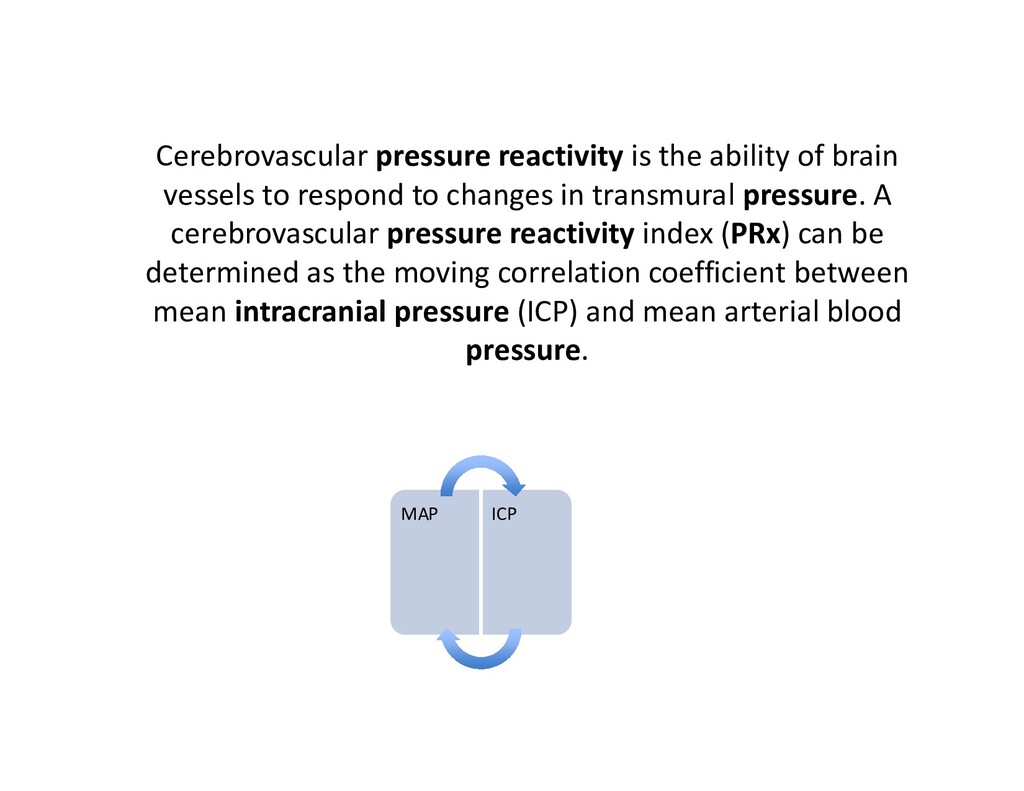
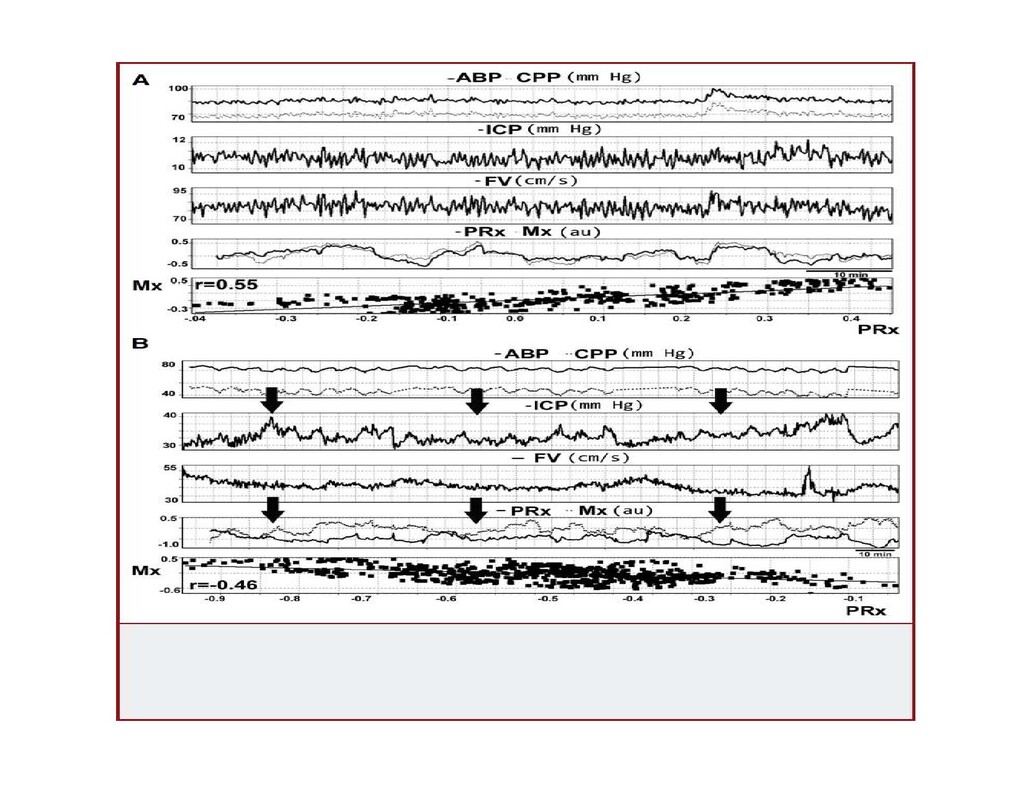
respond to changes in transmural pressure. A cerebrovascular pressure reactivity index (PRx) can be determined as the moving correlation coefficient between mean intracranial pressure (ICP) and mean arterial blood pressure. MAP MAP ICP ICP
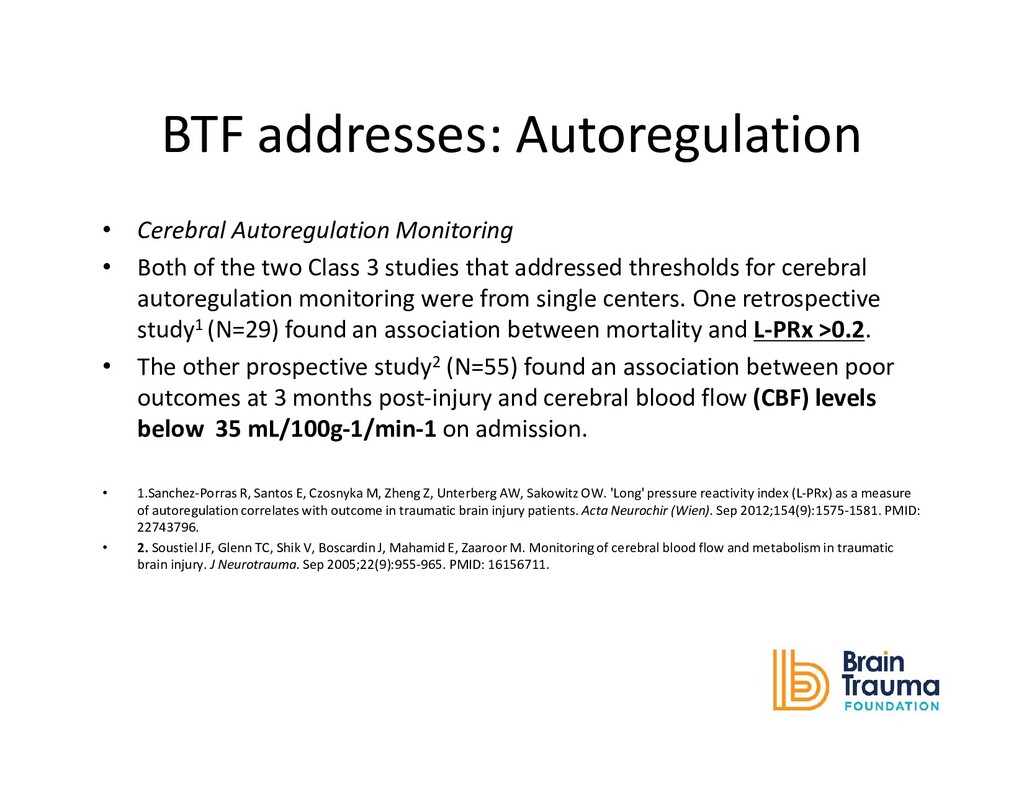
the two Class 3 studies that addressed thresholds for cerebral autoregulation monitoring were from single centers. One retrospective study1 (N=29) found an association between mortality and L-PRx >0.2. • The other prospective study2 (N=55) found an association between poor outcomes at 3 months post-injury and cerebral blood flow (CBF) levels below 35 mL/100g-1/min-1 on admission. • 1.Sanchez-Porras R, Santos E, Czosnyka M, Zheng Z, Unterberg AW, Sakowitz OW. 'Long' pressure reactivity index (L-PRx) as a measure of autoregulation correlates with outcome in traumatic brain injury patients. Acta Neurochir (Wien). Sep 2012;154(9):1575-1581. PMID: 22743796. • 2. Soustiel JF, Glenn TC, Shik V, Boscardin J, Mahamid E, Zaaroor M. Monitoring of cerebral blood flow and metabolism in traumatic brain injury. J Neurotrauma. Sep 2005;22(9):955-965. PMID: 16156711.
flow autoregulation and cerebrovascular pressure reactivityafter traumatic brain injury. • Budohoski KP1, Czosnyka M, de Riva N, Smielewski P, Pickard JD, Menon DK, Kirkpatrick PJ, Lavinio A. – Cambridge, UK and Barcelona, Spain • Cerebrovascular pressure reactivity is the principal mechanism of autoregulation! • Assessment of cerebra autoregulation can be performed by using the mean flow index (Mx) based on TCD • Cerebrovascular pressure reactivity can be monitored by using the pressure reactivity index (PRx), which is based on ICP • PRx can be monitored continuously, whereas Mx can only be monitored in short periods when TCD probes can be applied
pressure reactivity (PRx) is associated with impairment in cerebral autoregulation (Mx). • METHODS: • 345 TBI patients was screened for data availability including simultaneous Mx and PRx monitoring. • Absolute differences, temporal changes, and association with outcome of the 2 indices were analyzed.
patients • a moderate correlation between Mx and PRx was found (r = 0.58; P < .001). • The area under the receiver operator characteristic curve designed to detect the ability of PRx to predict impaired cerebral autoregulation was 0.700 (95% confidence interval: 0.607-0.880). • Discrepancies between Mx and PRx were most pronounced at an ICP of 30 mm Hg and they were significantly larger for patients who died (P = .026). • Both Mx and PRx were significantly lower at day 1 post admission in patients who survived than in those who died (P < .01).
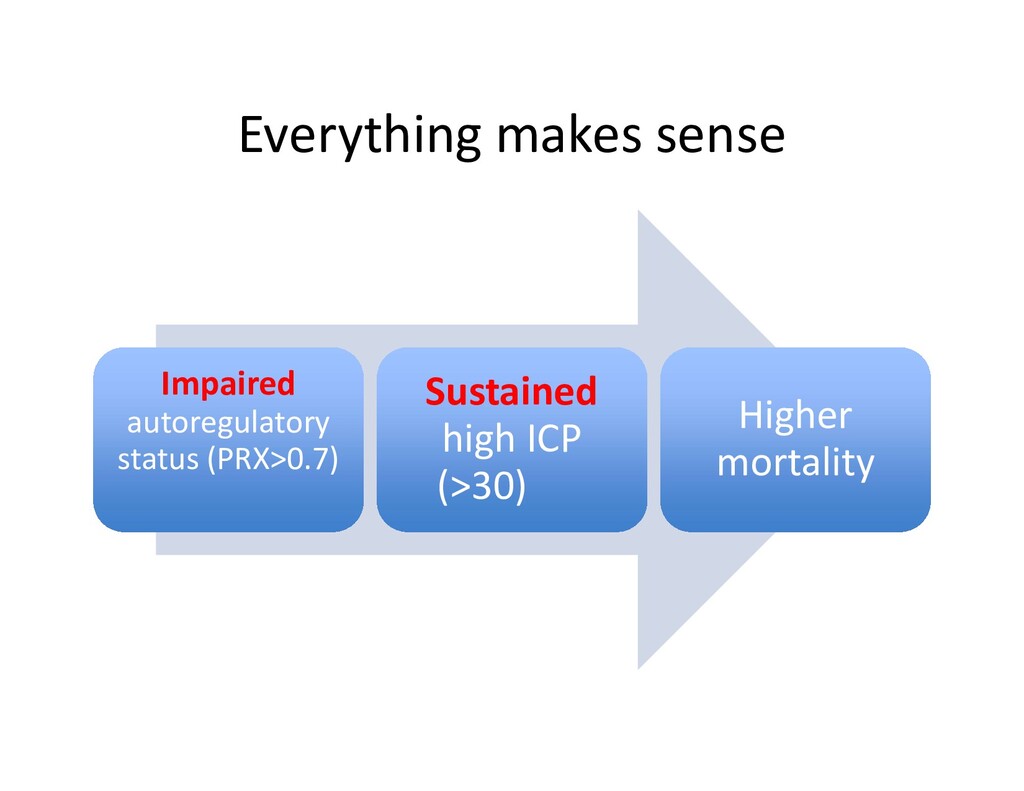
and PRx (Pressure Reactivity/autoregulation) • Discrepancies between Mx and PRx are particularly significant in patients with sustained intracranial hypertension.
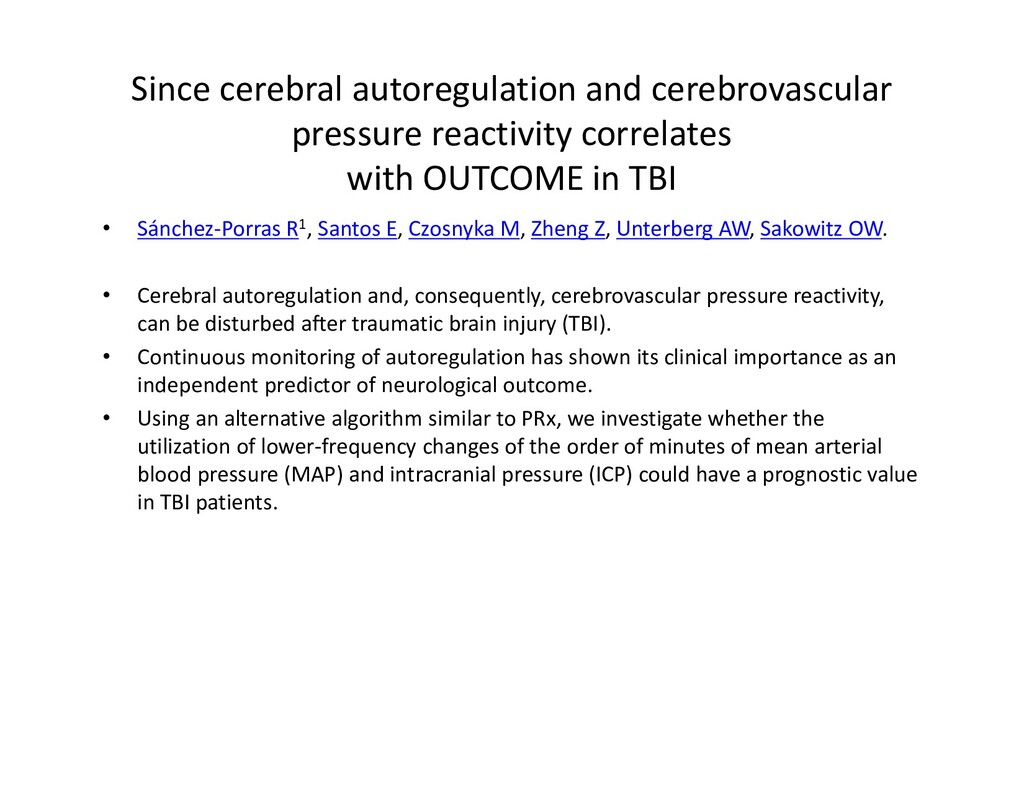
in TBI • Sánchez-Porras R1, Santos E, Czosnyka M, Zheng Z, Unterberg AW, Sakowitz OW. • Cerebral autoregulation and, consequently, cerebrovascular pressure reactivity, can be disturbed after traumatic brain injury (TBI). • Continuous monitoring of autoregulation has shown its clinical importance as an independent predictor of neurological outcome. • Using an alternative algorithm similar to PRx, we investigate whether the utilization of lower-frequency changes of the order of minutes of mean arterial blood pressure (MAP) and intracranial pressure (ICP) could have a prognostic value in TBI patients.
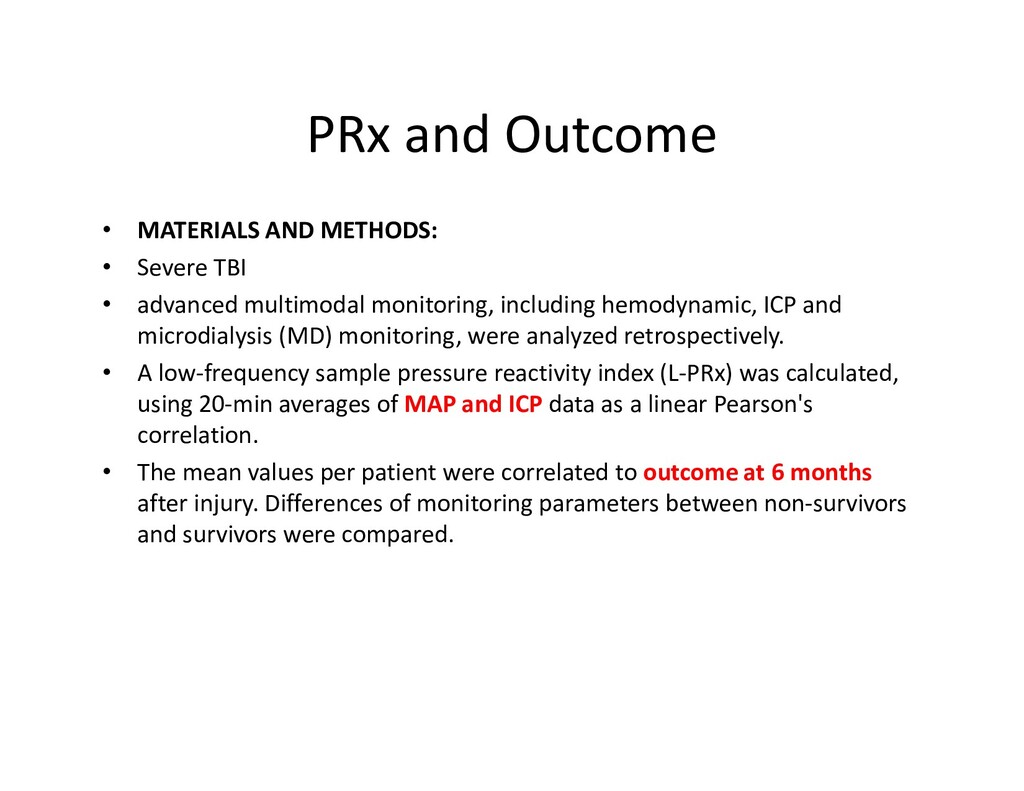
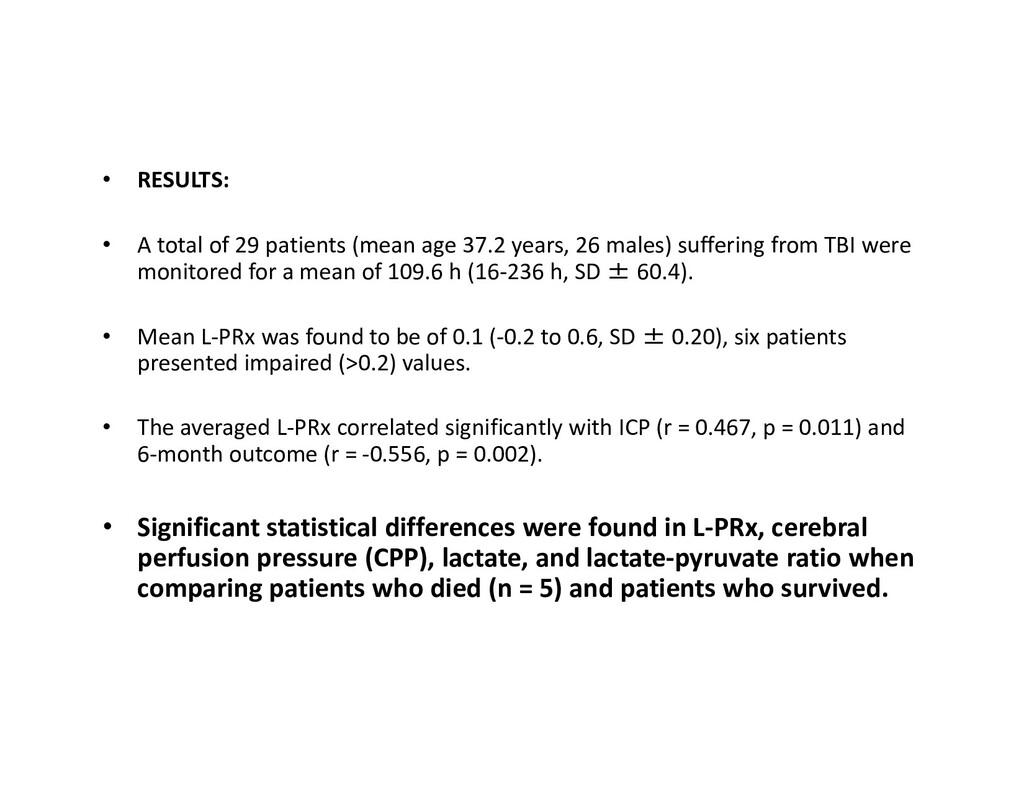
• advanced multimodal monitoring, including hemodynamic, ICP and microdialysis (MD) monitoring, were analyzed retrospectively. • A low-frequency sample pressure reactivity index (L-PRx) was calculated, using 20-min averages of MAP and ICP data as a linear Pearson's correlation. • The mean values per patient were correlated to outcome at 6 months after injury. Differences of monitoring parameters between non-survivors and survivors were compared.
37.2 years, 26 males) suffering from TBI were monitored for a mean of 109.6 h (16-236 h, SD ± 60.4). • Mean L-PRx was found to be of 0.1 (-0.2 to 0.6, SD ± 0.20), six patients presented impaired (>0.2) values. • The averaged L-PRx correlated significantly with ICP (r = 0.467, p = 0.011) and 6-month outcome (r = -0.556, p = 0.002). • Significant statistical differences were found in L-PRx, cerebral perfusion pressure (CPP), lactate, and lactate-pyruvate ratio when comparing patients who died (n = 5) and patients who survived.
TBI patients. Very slow changes of MAP and ICP may contain important autoregulation information. • L-PRx may be an alternative algorithm for the estimation of cerebral autoregulation and clinical prognosis.
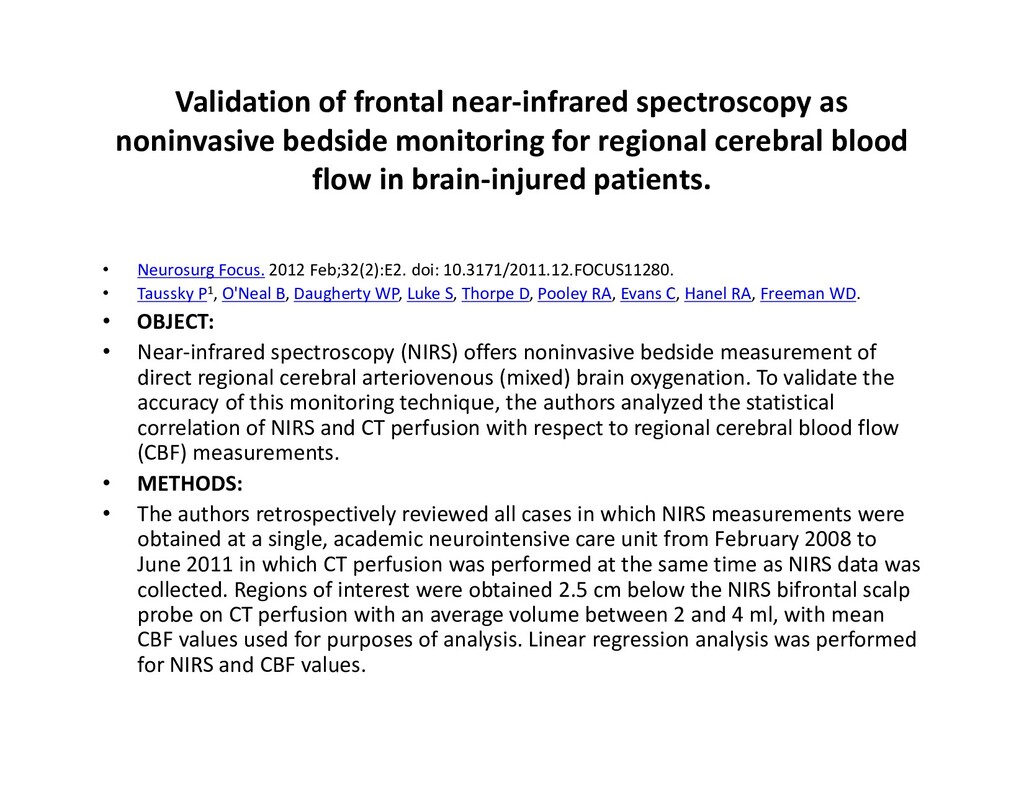
regional cerebral blood flow in brain-injured patients. • Neurosurg Focus. 2012 Feb;32(2):E2. doi: 10.3171/2011.12.FOCUS11280. • Taussky P1, O'Neal B, Daugherty WP, Luke S, Thorpe D, Pooley RA, Evans C, Hanel RA, Freeman WD. • OBJECT: • Near-infrared spectroscopy (NIRS) offers noninvasive bedside measurement of direct regional cerebral arteriovenous (mixed) brain oxygenation. To validate the accuracy of this monitoring technique, the authors analyzed the statistical correlation of NIRS and CT perfusion with respect to regional cerebral blood flow (CBF) measurements. • METHODS: • The authors retrospectively reviewed all cases in which NIRS measurements were obtained at a single, academic neurointensive care unit from February 2008 to June 2011 in which CT perfusion was performed at the same time as NIRS data was collected. Regions of interest were obtained 2.5 cm below the NIRS bifrontal scalp probe on CT perfusion with an average volume between 2 and 4 ml, with mean CBF values used for purposes of analysis. Linear regression analysis was performed for NIRS and CBF values.
6 of whom suffered subarachnoid hemorrhage, 1 ischemic stroke, and 1 intracerebral hemorrhage and brain edema. Mean CBF measured by CT perfusion was 61 ml/100 g/min for the left side and 60 ml/100 g/min for the right side, while mean NIRS values were 75 on the right and 74 on the left. Linear regression analysis demonstrated a statistically significant probability value (p<0.0001) comparing NIRS frontal oximetry and CT perfusion- obtained CBF values.
frontal NIRS cerebral oxygenation measurements compared with regional CBF on CT perfusion imaging. Thus, frontal NIRS cerebral oxygenation measurement may serve as a useful, noninvasive, bedside intensive care unit monitoring tool to assess brain oxygenation in a direct manner.
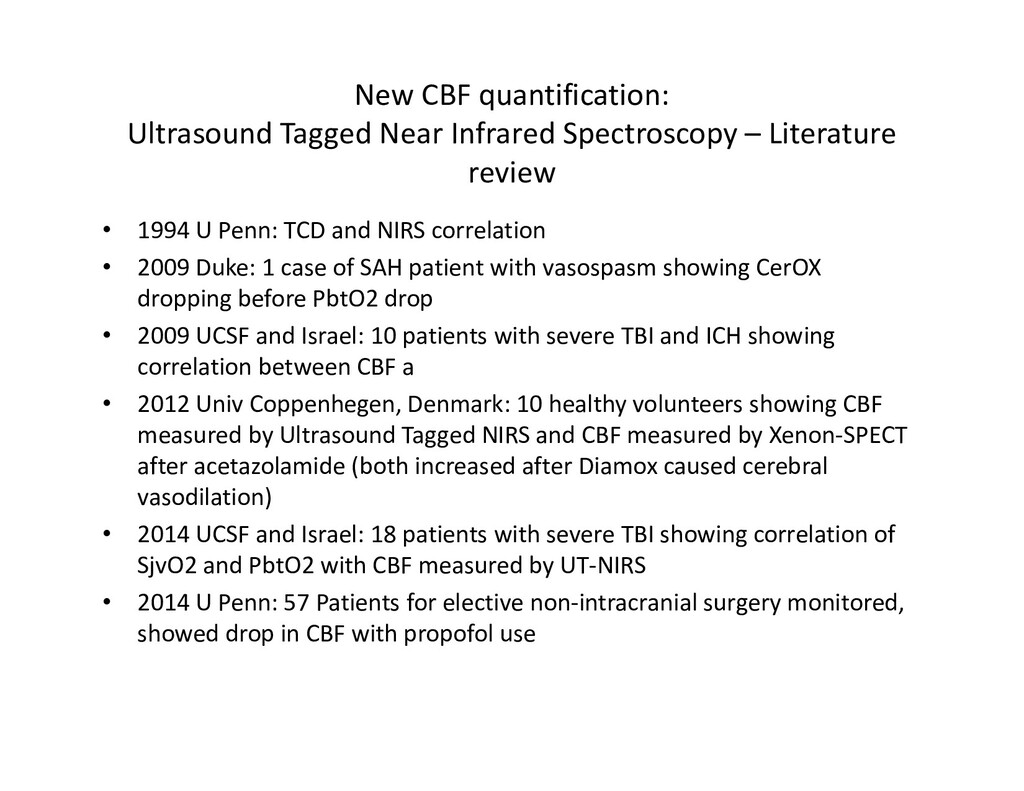
review • 1994 U Penn: TCD and NIRS correlation • 2009 Duke: 1 case of SAH patient with vasospasm showing CerOX dropping before PbtO2 drop • 2009 UCSF and Israel: 10 patients with severe TBI and ICH showing correlation between CBF a • 2012 Univ Coppenhegen, Denmark: 10 healthy volunteers showing CBF measured by Ultrasound Tagged NIRS and CBF measured by Xenon-SPECT after acetazolamide (both increased after Diamox caused cerebral vasodilation) • 2014 UCSF and Israel: 18 patients with severe TBI showing correlation of SjvO2 and PbtO2 with CBF measured by UT-NIRS • 2014 U Penn: 57 Patients for elective non-intracranial surgery monitored, showed drop in CBF with propofol use
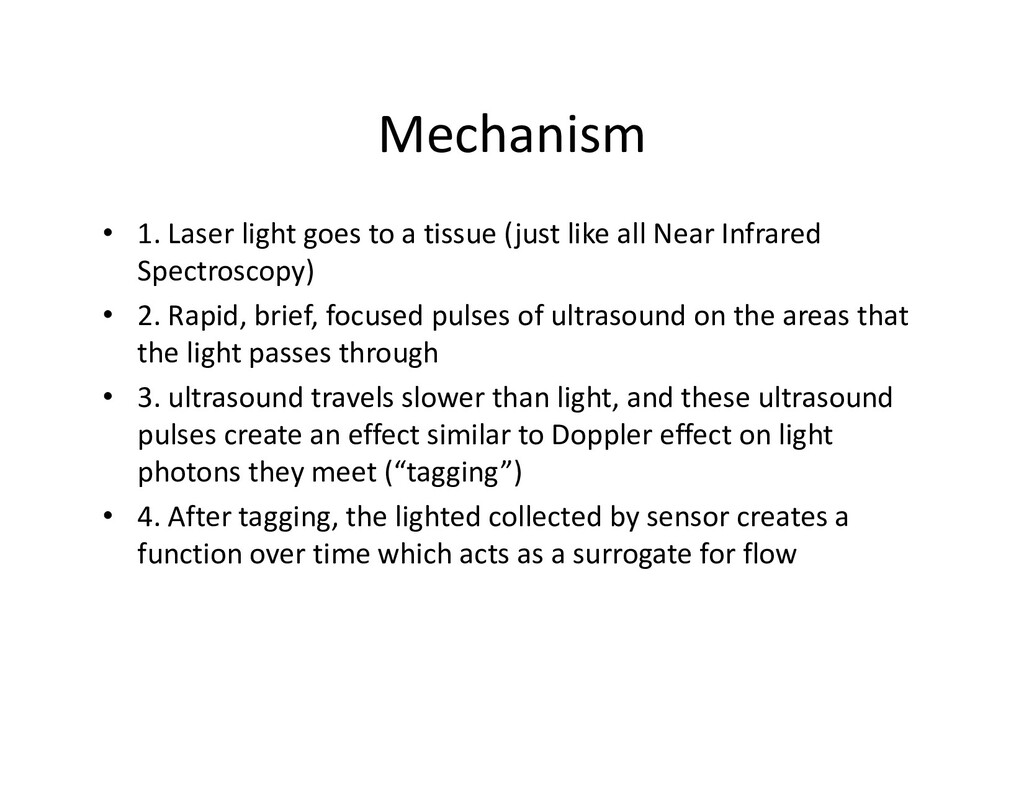
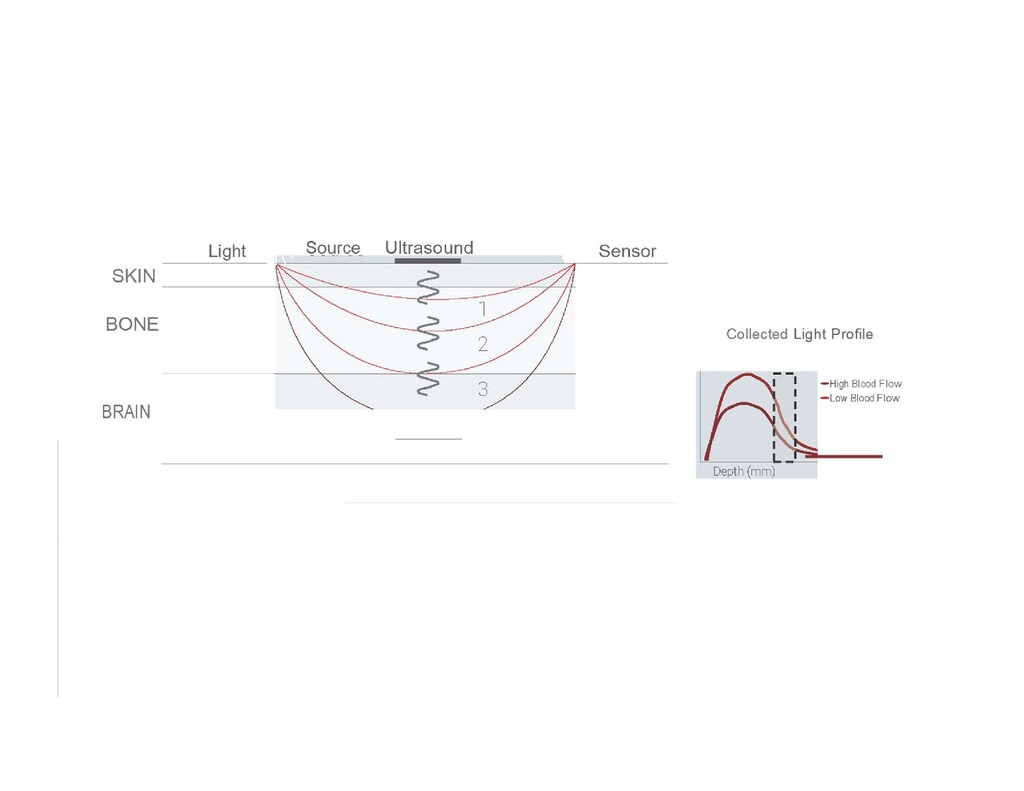
like all Near Infrared Spectroscopy) • 2. Rapid, brief, focused pulses of ultrasound on the areas that the light passes through • 3. ultrasound travels slower than light, and these ultrasound pulses create an effect similar to Doppler effect on light photons they meet (“tagging”) • 4. After tagging, the lighted collected by sensor creates a function over time which acts as a surrogate for flow
perfusion • Oxygenation is important but oximetry is not a direct surrogate for flow – Oxygen demand may go up or down- leading to low or high oximetry numbers – Vessel occlusion leads to reduced oximetry and flor – Early sepsis leads to increased flow with increased oxygen demand (low oxygen, high flow state) – So different states may have different oximetry and flow values