$30 off During Our Annual Pro Sale. View Details »

UX14 - Is Big Data Killing Customer Experience? (Arun Jawarlal)

uxindia
October 10, 2014

UX14 - Is Big Data Killing Customer Experience? (Arun Jawarlal)

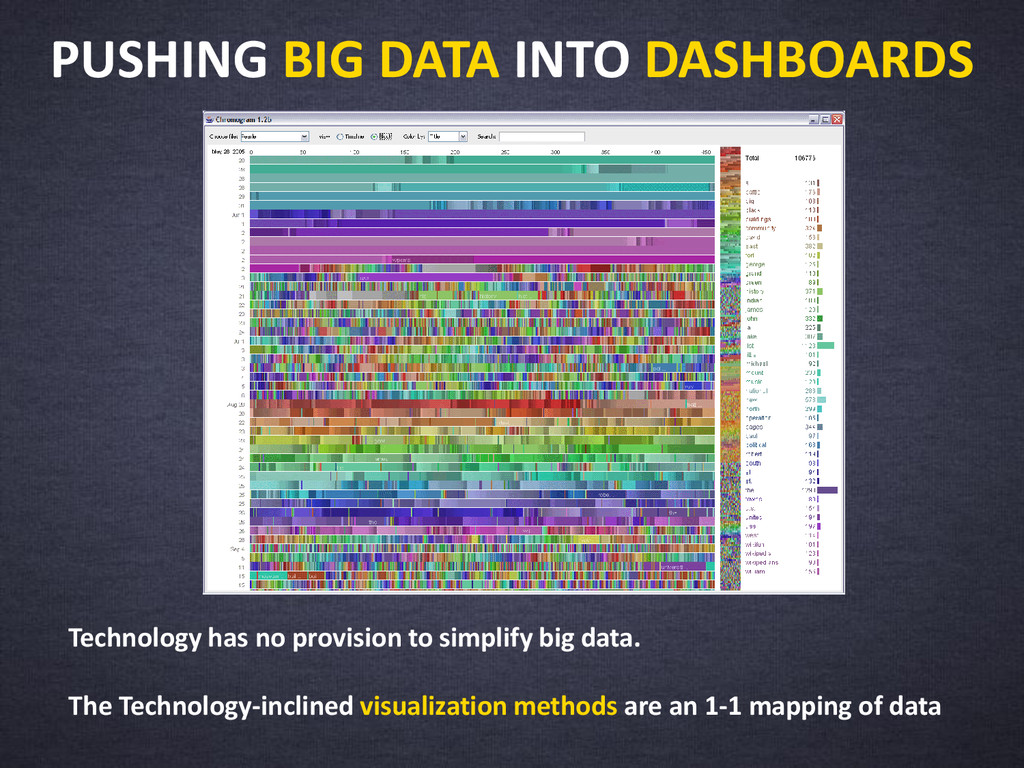
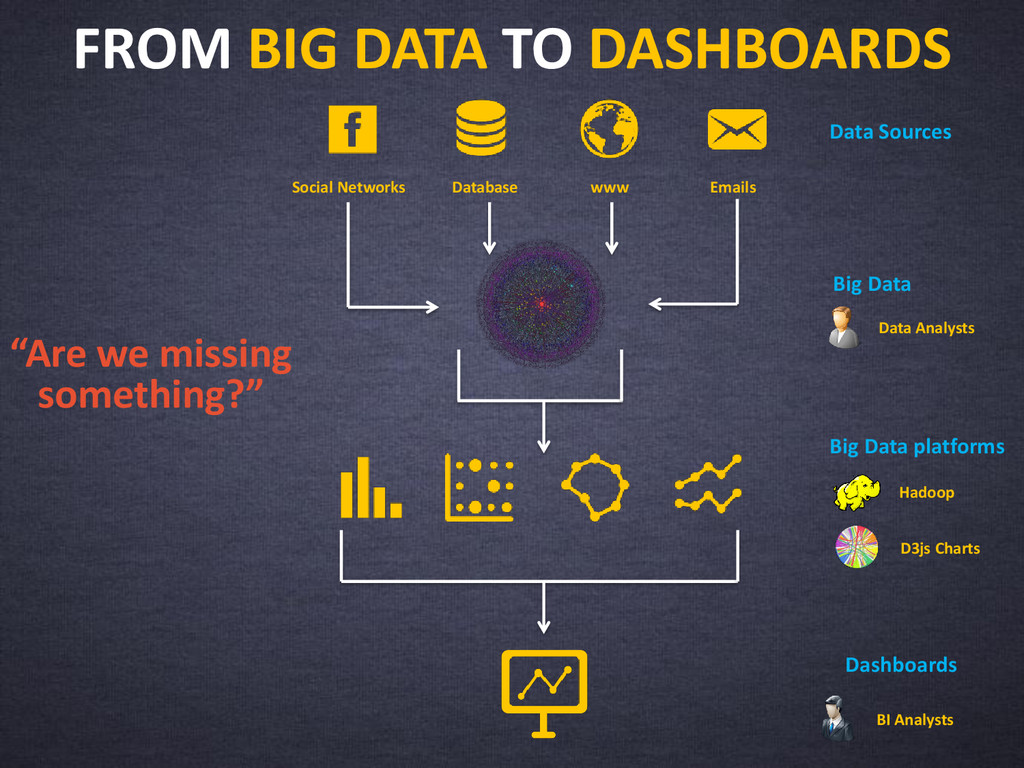
In today's Big Data world, many technologies have been introduced to understand, analyze, slice and dice data. There also have been new genres of professionals supporting big data (Data Scientist). This raises some important questions - Are we (UX) doing enough to channelize Big data into Dashboard user experience? Are we helping Customers view data precisely? Is big data being converted into big visualizations and big dashboards rather than simple visualizations and Simple Dashboards? Are Users/Customers overwhelmed by the Big data?
There are so many questions lingering in the minds of people. We have a mammoth elephant in the living room and people are too scared to act. They choose to ignore the elephant rather than trying to deal with the problem.
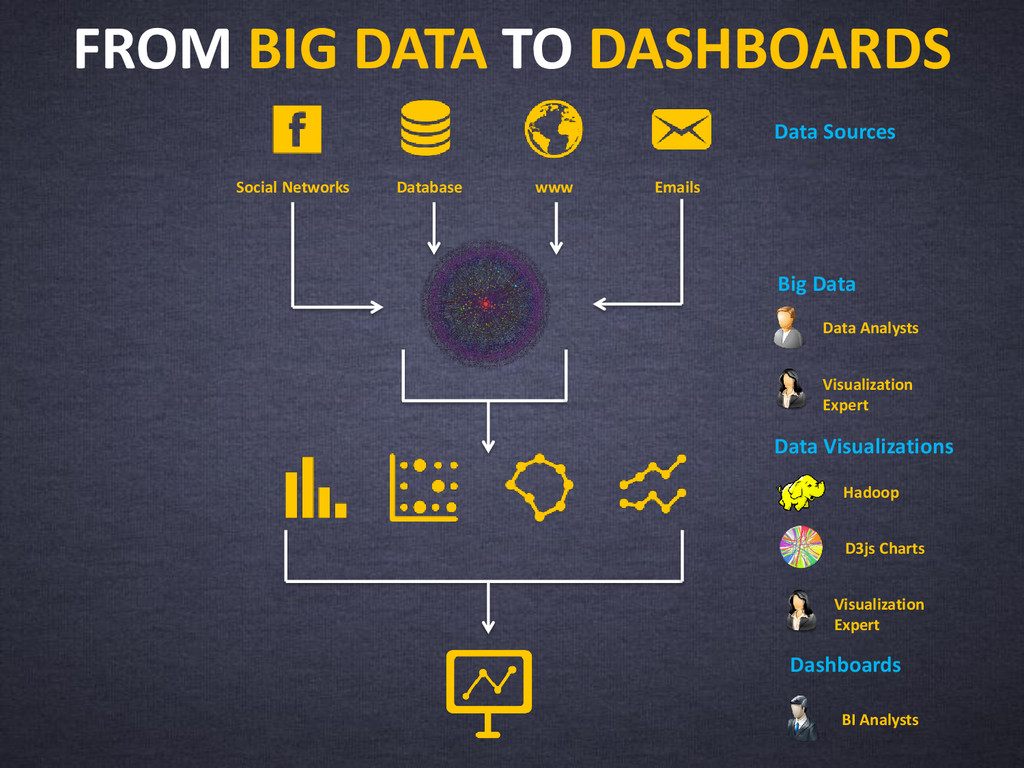
We as User Experience professionals have always had a responsibility to raise questions on ROI (Return on Investment) of organizations. We have been paramount in saving millions of Dollars being squandered into IT where users have never been given key importance. We all have a new responsibility - Taming Big Data.
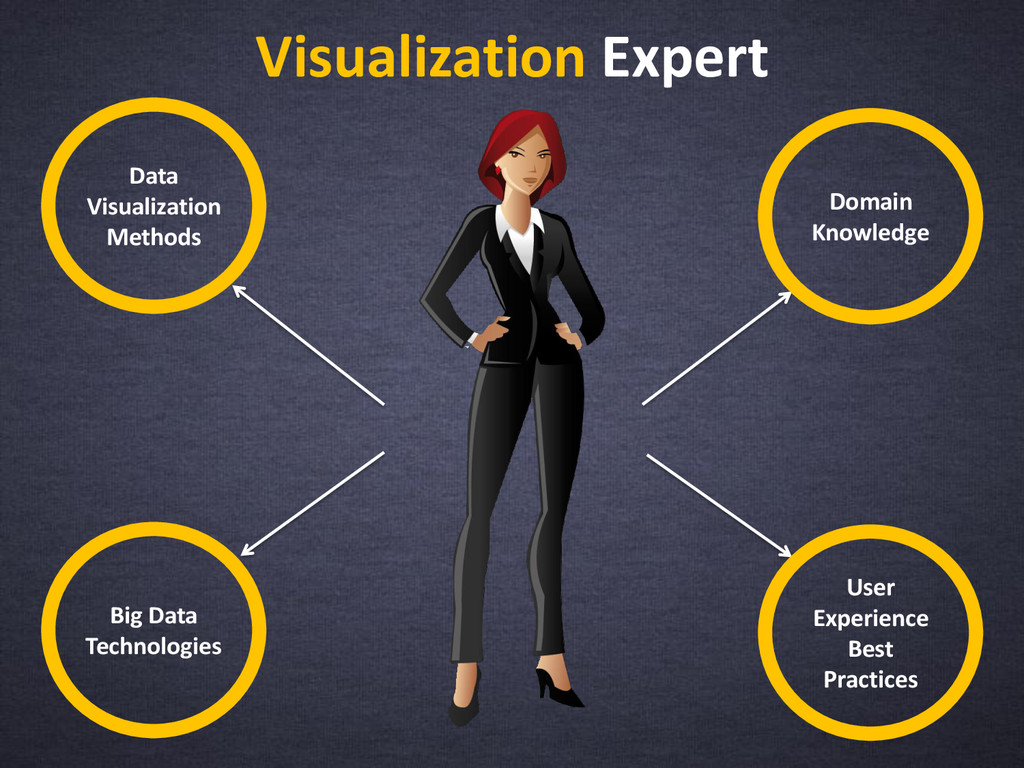
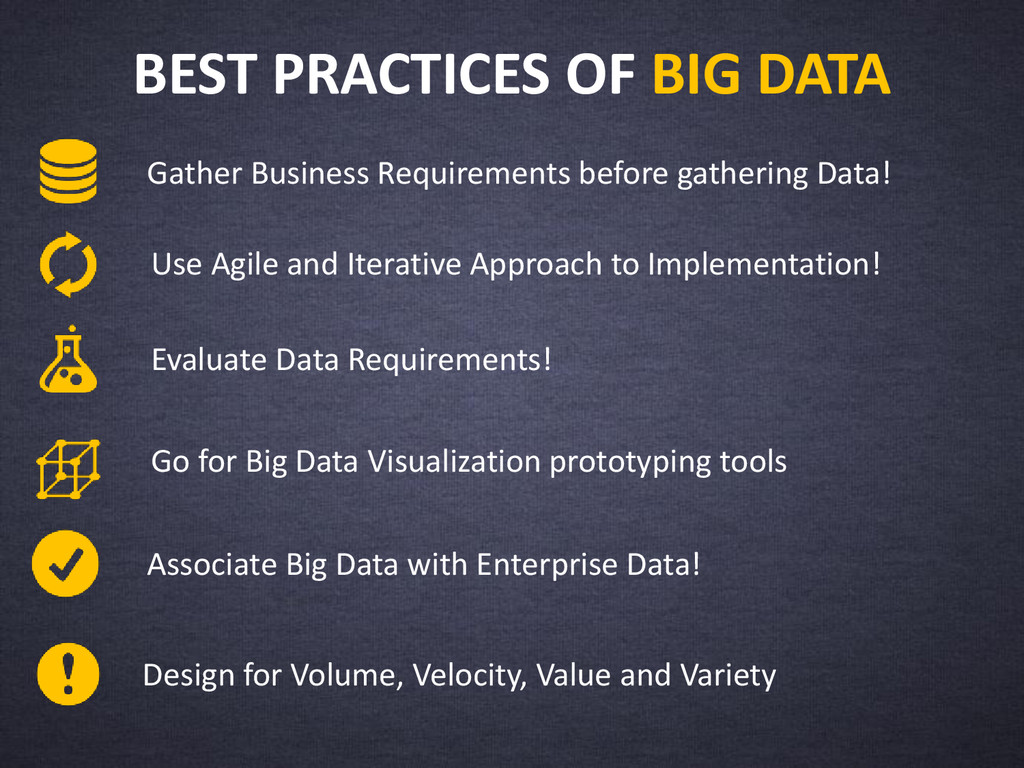
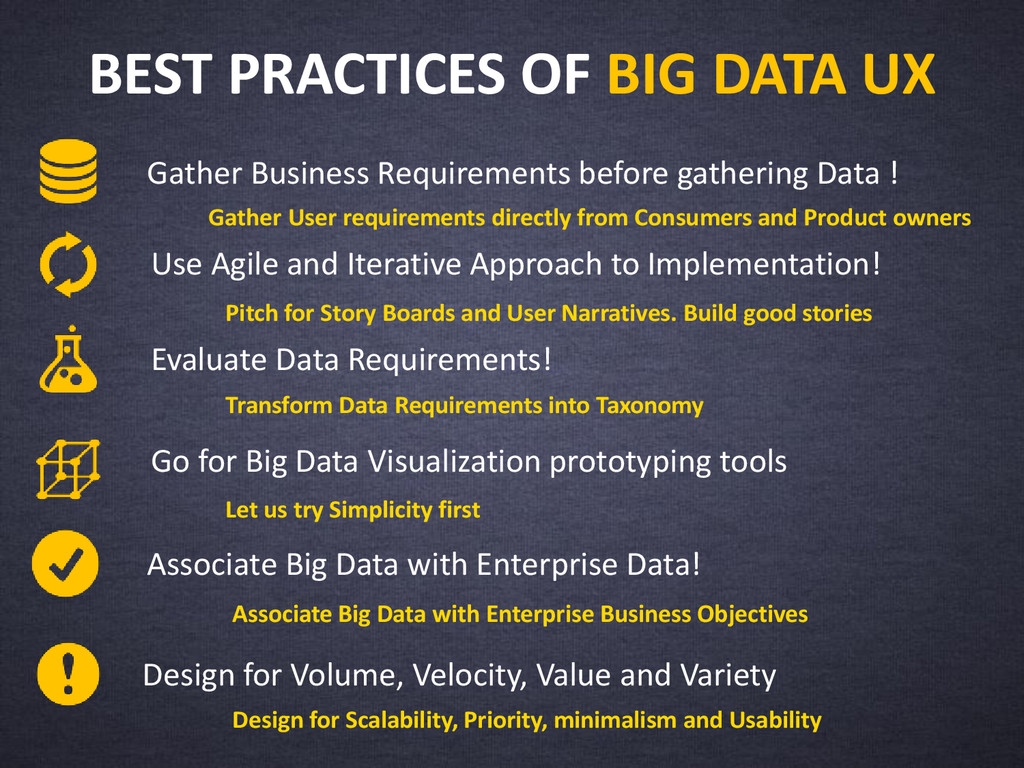
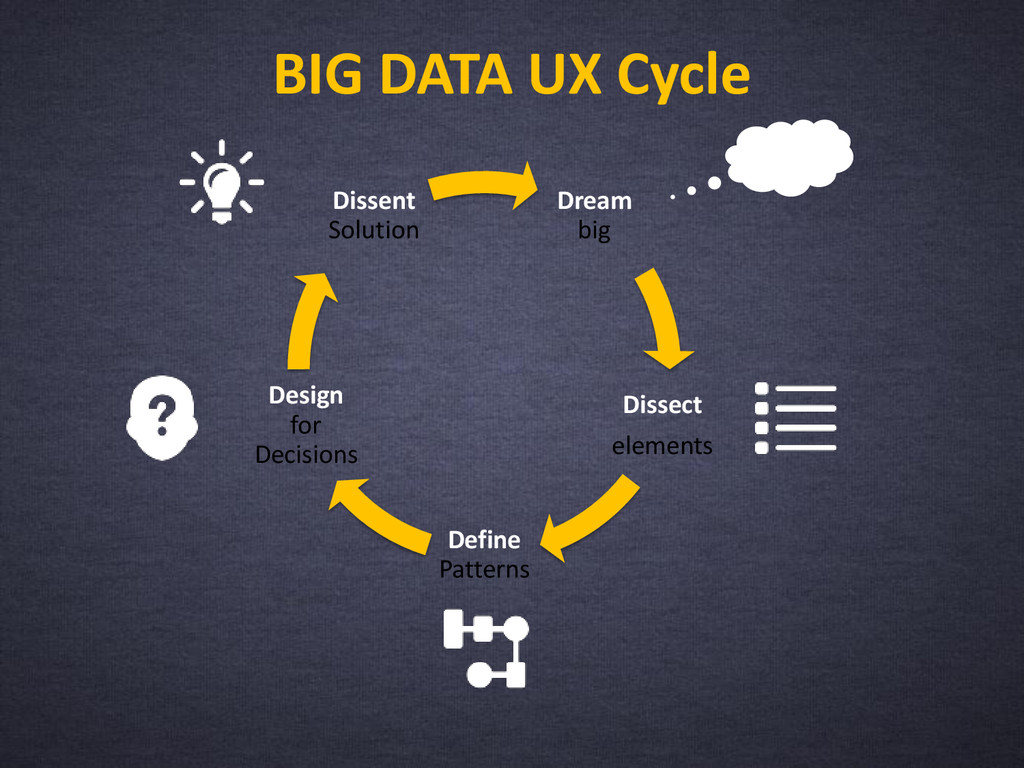
This concept proposes a 5 step process for Big Data UX and a new skill set for Big Data UX.

uxindia

October 10, 2014
Tweet

More Decks by uxindia

Other Decks in Design

Transcript

  1. Is Big Data Killing Customer Experience?
    Arun Jawarlal, Lead – Usability & UX Research

    View Slide

  2. iNautix - A BNY Mellon Company
    iNautix Technologies India Private Limited is a group company of
    Bank of New York Mellon - a leading financial services provider.
    We provide technology development, business & technology
    operations and remote infrastructure management services for BNY
    Mellon and its subsidiaries. iNautix also develops and delivers
    comprehensive technology solutions and software development
    products for customers of BNY Mellon.
    Leveraging the resources based in Chennai and Pune, India, our
    parent organization BNY Mellon and other subsidiaries benefit from
    the proven track record of our more than 5000 consultants, analysts,
    and technologists.

    View Slide

  3. The Big Dashboard story

    View Slide

  4. This is Mr. John Doe, Product Manager
    of ABC Financial Corp.,
    This travel with
    John Doe is going
    to show one of his
    Experiences with
    the Dashboards!

    View Slide

  5. Mr. John Doe has a new Exercise :
    STEP 1 : To find out which is the Most Time
    Consuming Repetitive Activity in his
    Application
    STEP 2 : To introduce an Interaction Feature
    to make it more Productive

    View Slide

  6. So his team
    gathered data to
    come up with a
    Data Analysis
    Dashboard of the
    Most Time
    Consuming
    Repetitive Actions
    on the Portal.
    Mr. John Doe wanted his team to analyze the Data and
    give him insights on the highest used feature/function.
    This would enable him to make informed decisions.

    View Slide

  7. This was the Dashboard presented to Mr. John Doe
    Data Analysis Dashboard
    Home Page Transaction
    Account
    Setup
    Reports
    Insights
    Issue Management
    Alerts
    Login
    Navigation Activity
    0
    5
    10
    15
    Mon Tue Wed Thu Fri Sat Sun Mon Tue Wed Thu
    Daily Transaction Chart
    Website Portals Vs. Usage Analytics
    Portal Name Time Spent # of Clicks Freq. Buttons
    Market Status 200 Mins 45 Today, Compare
    Stock Value 230 Mins 44 Present, Change
    Market Analysis 220 Mins 37 Compare Stock, News
    Stock Profile 100 Mins 32 Watch list, Buy/Sell
    Compare 220 Mins 28 Change, Buy/Sell
    News 107 Mins 21 Today, Weekly
    Rates 190 Mins 35 Buy/Sell

    View Slide

  8. “ Can someone Walk me through this?“, asked
    Mr. John Doe
    Home Page Transaction
    Account Setup
    Reports
    Insights
    Issue Management
    Alerts
    Login

    View Slide

  9. What is Big Data?

    View Slide

  10. Evolution Timeline of Dashboards

    View Slide

  11. What is BIG DATA?
    Big data is collection of Data
    sets so Large and Complex that
    it becomes difficult to Process
    using Traditional Processing
    Tools.
    Technologies
    D3.js
    Google Charts
    Visualizing.org
    Hadoop
    MapReduce

    View Slide

  12. Some scary BIG DATA revelations
    • Gartner predicts that by 2015, we need 4.4 Million Data Scientists
    • IDC research states that more than 70% (900 Exabytes- 880Billion
    GB) of the data on the Internet will be User Generated in 2010
    • Intel suggests that 44% of those who are not analyzing
    unstructured data expect to do so in the next 12 to 18 months
    • EMC Report states that Digital universe will reach 40 trillion
    gigabytes by 2020
    • IDC also states that only 1% of the world Data is being analyzed
    currently
    Source : Multiple

    View Slide

  13. FACTS ABOUT BIG DATA
    2.7
    Zeta bytes
    235
    Tera bytes
    Digital Universe U.S Library of Congress Walmart Database
    2.5
    Peta bytes
    100
    Tera bytes
    Data Daily Uploaded in Facebook
    571
    New
    Websites
    Created Every Minute of the Day
    Source : Wikibon

    View Slide

  14. BIG DATA VISUALIZATION
    2005 2006 2007 2008 2009 2020
    2010 2011
    Search
    Engines
    Social Media
    Producers
    Other websites
    6.6 Zettabytes (Approx.)
    Social Big Data : Type of Data
    collected from Social Media is
    approximately 500GB per second

    View Slide

  15. Is Big Data Visualization really confusing?

    View Slide

  16. DATA VISUALIZATION METHODS

    View Slide

  17. LETS KNOW A CHART
    What is the name of this
    Chart?
    Node Chart!
    What can it represent?
    Network Nodes /
    Connections
    Where can you use it?
    Relationship Mapping

    View Slide

  18. LETS KNOW A CHART
    What is the name of this
    Chart?
    Tree map
    What can it represent?
    Proportions
    Where can you use it?
    Budget Planning,
    Financial Data

    View Slide

  19. PUSHING BIG DATA INTO DASHBOARDS
    Technology has no provision to simplify big data.
    The Technology-inclined visualization methods are an 1-1 mapping of data

    View Slide

  20. FROM BIG DATA TO DASHBOARDS
    www
    Database
    Social Networks Emails
    Big Data
    Big Data platforms
    Dashboards
    Data Analysts
    BI Analysts
    Data Sources
    Hadoop
    D3js Charts
    “Are we missing
    something?”

    View Slide

  21. FROM BIG DATA TO DASHBOARDS
    www
    Database
    Social Networks Emails
    Big Data
    Data Visualizations
    Dashboards
    Data Analysts
    BI Analysts
    Data Sources
    Hadoop
    D3js Charts
    Visualization
    Expert
    Visualization
    Expert

    View Slide

  22. Visualization Expert
    Data
    Visualization
    Methods
    Domain
    Knowledge
    User
    Experience
    Best
    Practices
    Big Data
    Technologies

    View Slide

  23. BEST PRACTICES OF BIG DATA
    Gather Business Requirements before gathering Data!
    Use Agile and Iterative Approach to Implementation!
    Evaluate Data Requirements!
    Go for Big Data Visualization prototyping tools
    Associate Big Data with Enterprise Data!
    Design for Volume, Velocity, Value and Variety

    View Slide

  24. BEST PRACTICES OF BIG DATA UX
    Gather Business Requirements before gathering Data !
    Use Agile and Iterative Approach to Implementation!
    Evaluate Data Requirements!
    Go for Big Data Visualization prototyping tools
    Associate Big Data with Enterprise Data!
    Design for Volume, Velocity, Value and Variety
    Gather User requirements directly from Consumers and Product owners
    Pitch for Story Boards and User Narratives. Build good stories
    Transform Data Requirements into Taxonomy
    Let us try Simplicity first
    Associate Big Data with Enterprise Business Objectives
    Design for Scalability, Priority, minimalism and Usability

    View Slide

  25. The Big Data UX Cycle

    View Slide

  26. Perception Processing*
    Parallel
    Processing
    Pattern Perception
    Goal
    Processing
    Source : Colin Ware(2004)
    1
    2
    3

    View Slide

  27. BIG DATA UX Cycle
    Dream
    big
    Dissect
    elements
    Define
    Patterns
    Design
    for
    Decisions
    Dissent
    Solution

    View Slide

  28. We have Ms. Jane Doe who is also a Product Manager
    of the Competitor company of ABC Corp., tries to Find
    the most time consuming and repetitive tasks in the
    Portal and compete in the Market with an Improved
    Interactivity.

    View Slide

  29. Ms. Jane Doe advised her team to analyze the
    Customer Behavior in the Trading Portal and come up
    with a Dashboard containing the over all picture of the
    Analysis!
    The team analyzed
    the Data and along
    with the UX, came
    up with the
    Dashboard
    portraying the
    Analysis
    Information for
    Ms. Jane Doe

    View Slide

  30. This was the Dashboard presented to Ms. Jane Doe
    321
    No. of Users
    240
    Mins/User
    Most Time Spent in
    a Page
    Most clicked
    Button/Icon
    2035
    Times
    Data Analysis Dashboard
    Top 5 Screens
    Trading
    Insights
    Issue Management
    Reports
    News
    0
    500
    1000
    1500
    2000
    2500
    Buy/Sell Profile Trade News Insights
    Frequently Used Button
    TRANSACTIONS BUY/SELL
    Transactions

    View Slide

  31. Likelihood of People
    Transactions
    Insights
    Issue Management
    Reports
    News
    Top 5 Screens
    “ I think we now know the Frequent Actions
    performed by Users in our Portal. Lets try to enhance
    it and make it more easy for the Users!“,
    says Ms. Jane Doe

    View Slide

  32. What do we infer from their Experiences?
    Ms. Jane Doe Mr. John Doe
    Use of Big Data
    Lacks Insights
    Technology Centric
    Use of Key Data
    Decision Centric
    User Centric

    View Slide

  33. With UX intervention, Big Data
    dashboards can reach a higher level of
    maturity!

    View Slide

  34. Thanks
    Reach me @ [email protected]

    View Slide