Upgrade to Pro — share decks privately, control downloads, hide ads and more …

How to be a lion tamer

Wannes Rams
September 26, 2016

How to be a lion tamer

Keeping WebSphere under control with free tools - Wannes & Sharon share some tips and experience on the free tools they use daily to monitor Connections environments using FREE tools

Presented with Sharon James @IconUK 2016

Wannes Rams

September 26, 2016
Tweet

More Decks by Wannes Rams

Other Decks in Technology

Transcript

  1. How to be a lion tamer
    (or keeping WebSphere under control with free tools)
    Sharon Bellamy James & Wannes Rams

    View Slide

  2. Sharon Bellamy James
    • IBM WebSphere since 1999 &
    Connections since 2 / 2008
    • Many years experience with
    migrations, installations, administration,
    integration, customization & DOCUMENTATION
    • Tiny bit of a Star wars & Disney fan
    • Charity fundraising Cosplayer/Costumer
    • Part of the team that brings you ICON UK
    2

    View Slide

  3. Wannes Rams
    3
    • Domino since 2000, Sametime since version 6.5.1
    Connections since 2.01
    • Many years experience with
    architecture, migrations, installations,
    integration, customization
    • Owner at Ramsit
    • Hard core (average) table tennis player
    • Social Connections User group board member

    View Slide

  4. Overview
    • Nagios
    • WebSphere PTT
    • Nmon Visualizer

    View Slide

  5. • https://www.nagios.com
    • Nagios Core - The open source industry standard in IT infrastructure monitoring and alerting
    • Download Core: https://www.nagios.org/downloads/nagios-core/
    • https://exchange.nagios.org – for 3rd party plugins and add ons
    • Nagiosql (https://sourceforge.net/projects/nagiosql/ www.nagiosql.org ) - GUI configuration
    interface
    • Front ends – Looking glass - https://exchange.nagios.org/directory/Addons/Frontends-%28GUIs-
    and-CLIs%29/Web-Interfaces/Nagios-Looking-Glass/details

    View Slide

  6. • IS FREE !!! – well open source
    • Linux 
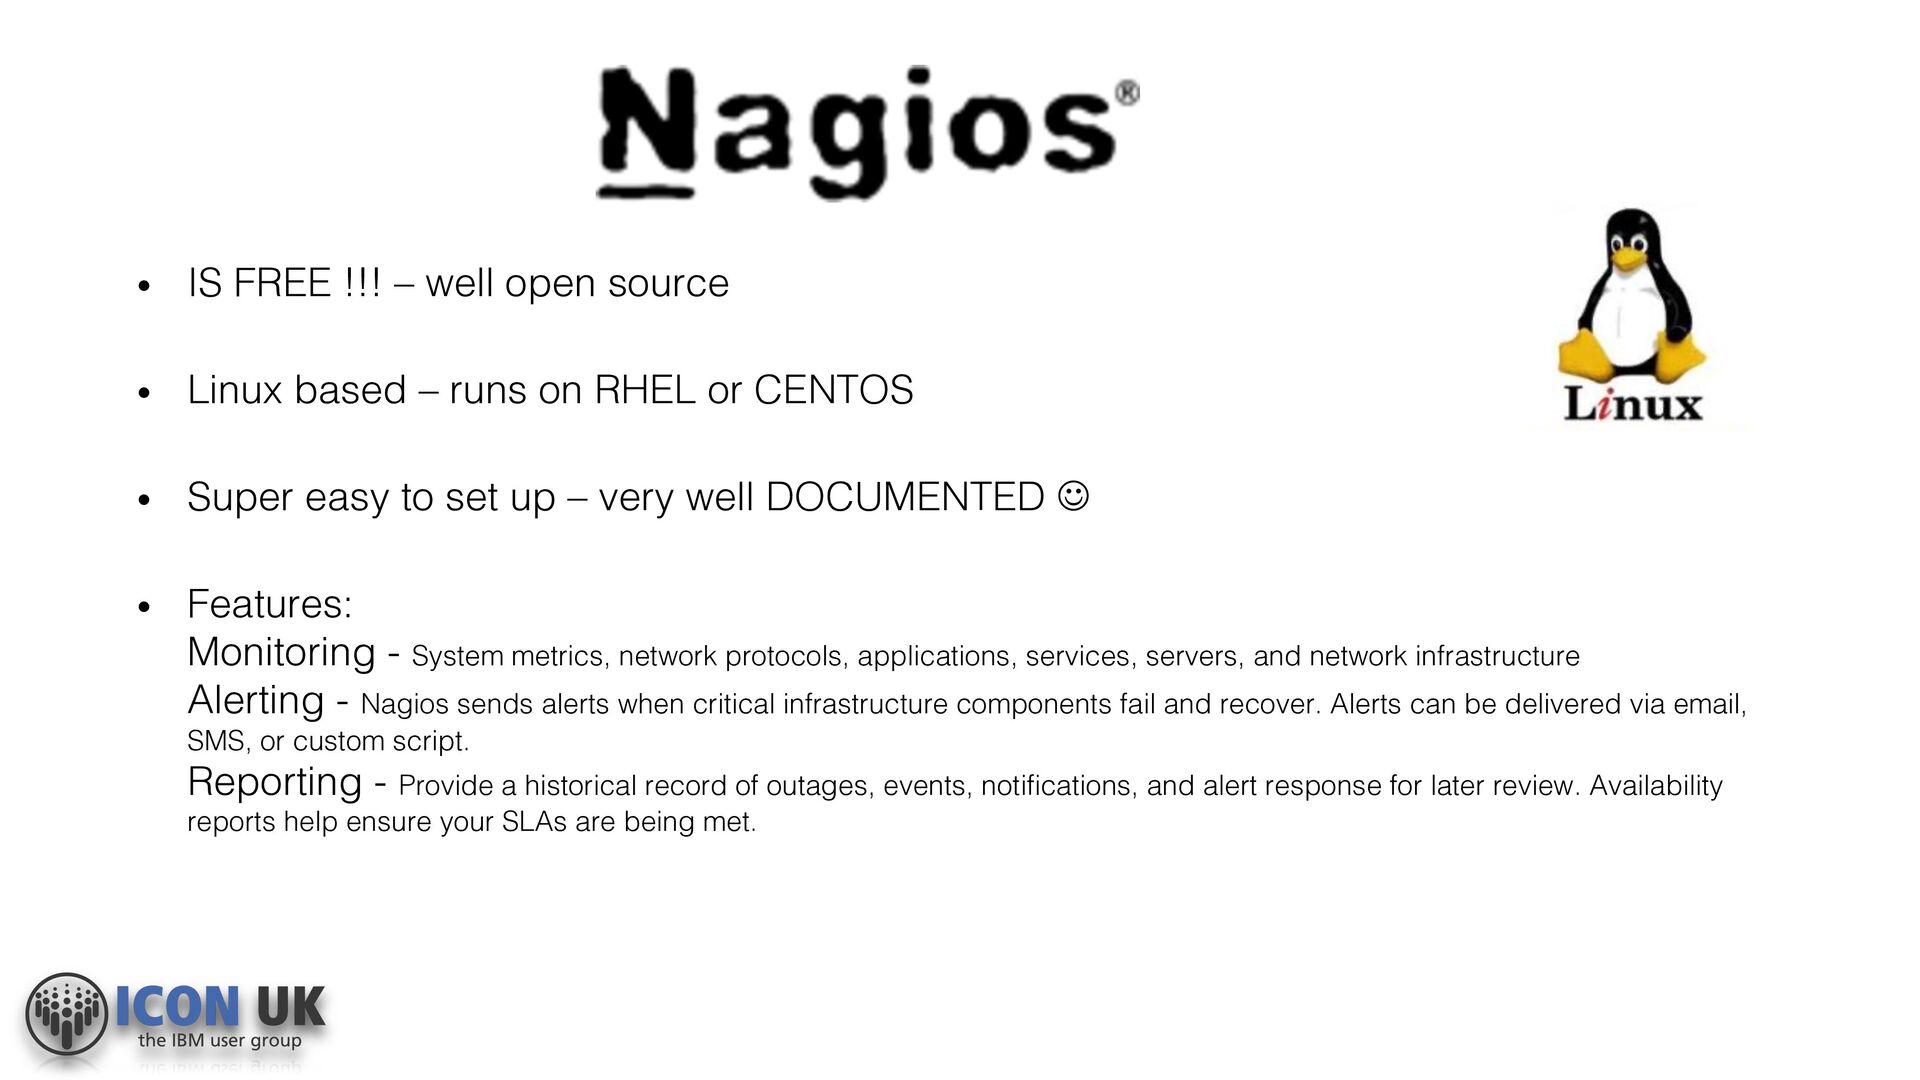
based – runs on RHEL or CENTOS
    • Super easy to set up – very well DOCUMENTED J
    • Features:
    Monitoring - System metrics, network protocols, applications, services, servers, and network infrastructure
    Alerting - Nagios sends alerts when critical infrastructure components fail and recover. Alerts can be delivered via email,
    SMS, or custom script.
    Reporting - Provide a historical record of outages, events, notifications, and alert response for later review. Availability
    reports help ensure your SLAs are being met.

    View Slide

  7. View Slide

  8. View Slide

  9. Nagios & Websphere
    • Basic WAS monitoring
    • Up or 
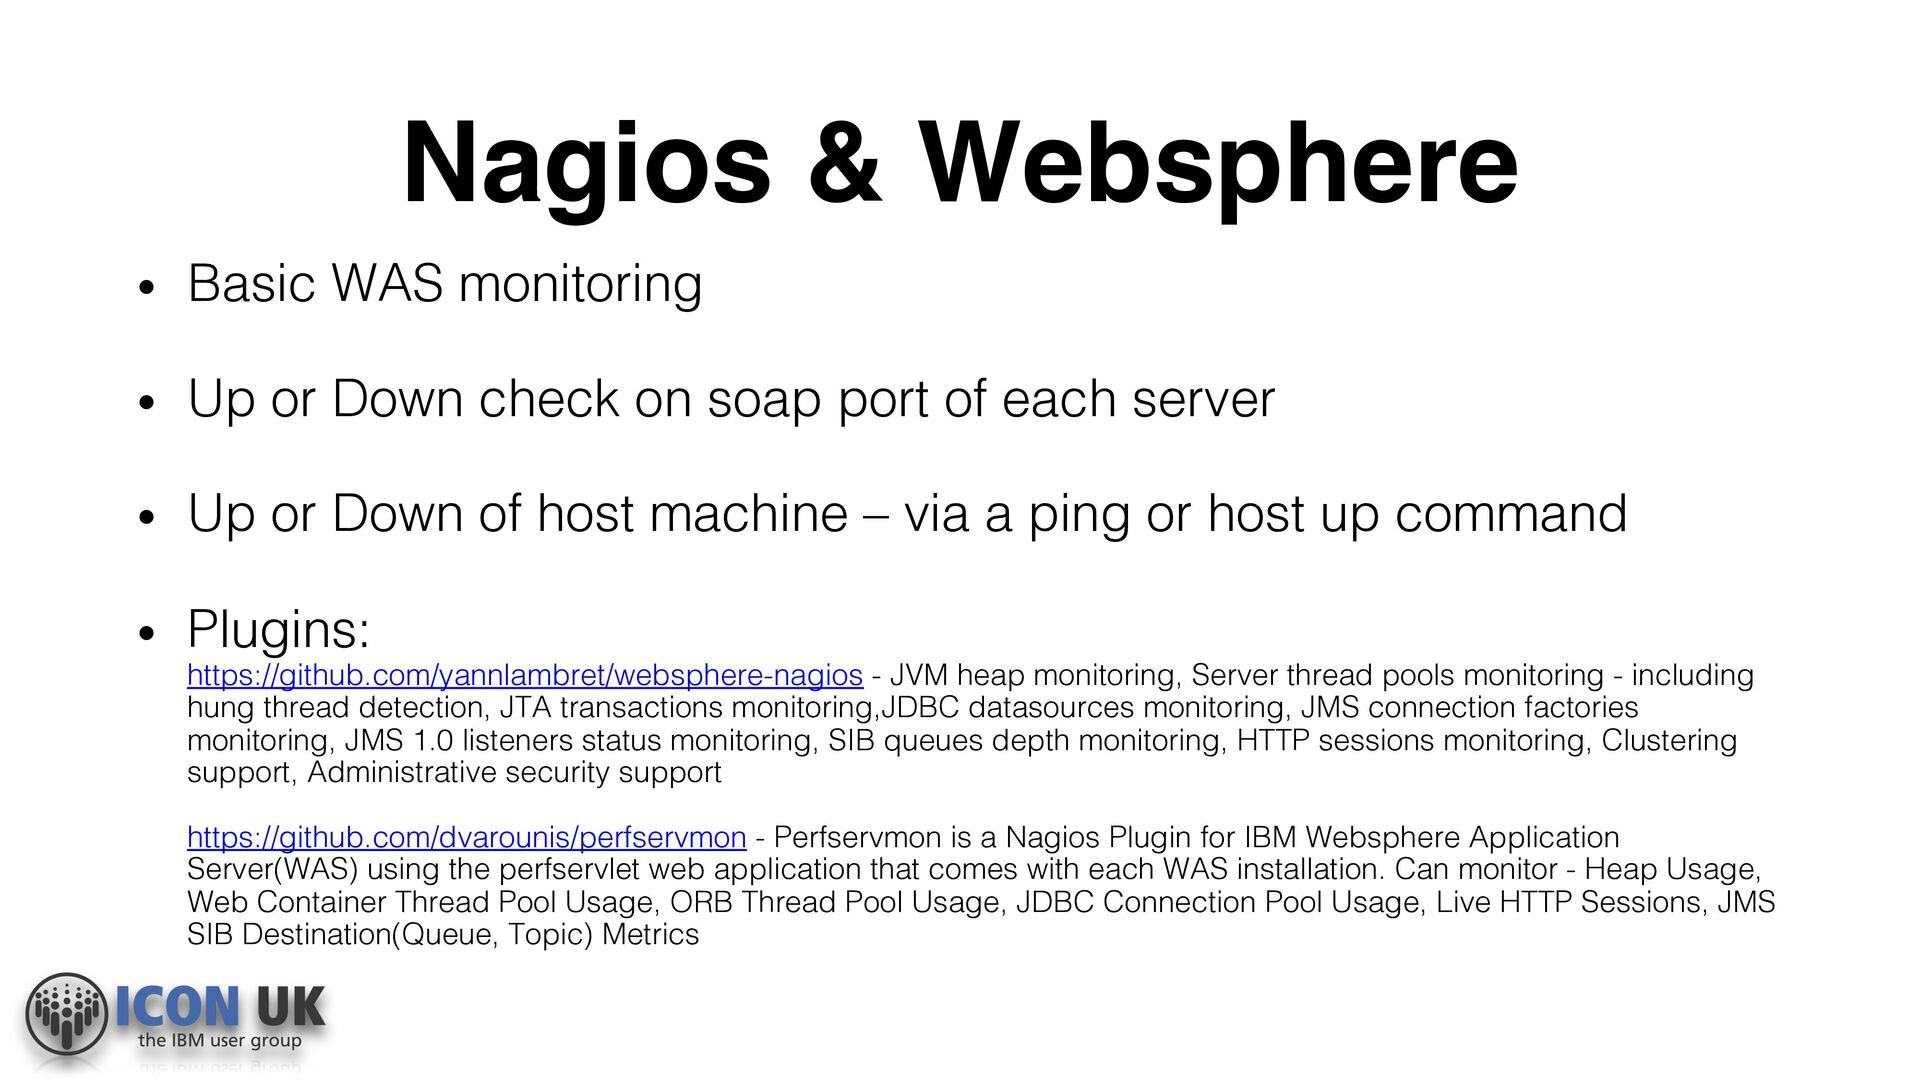
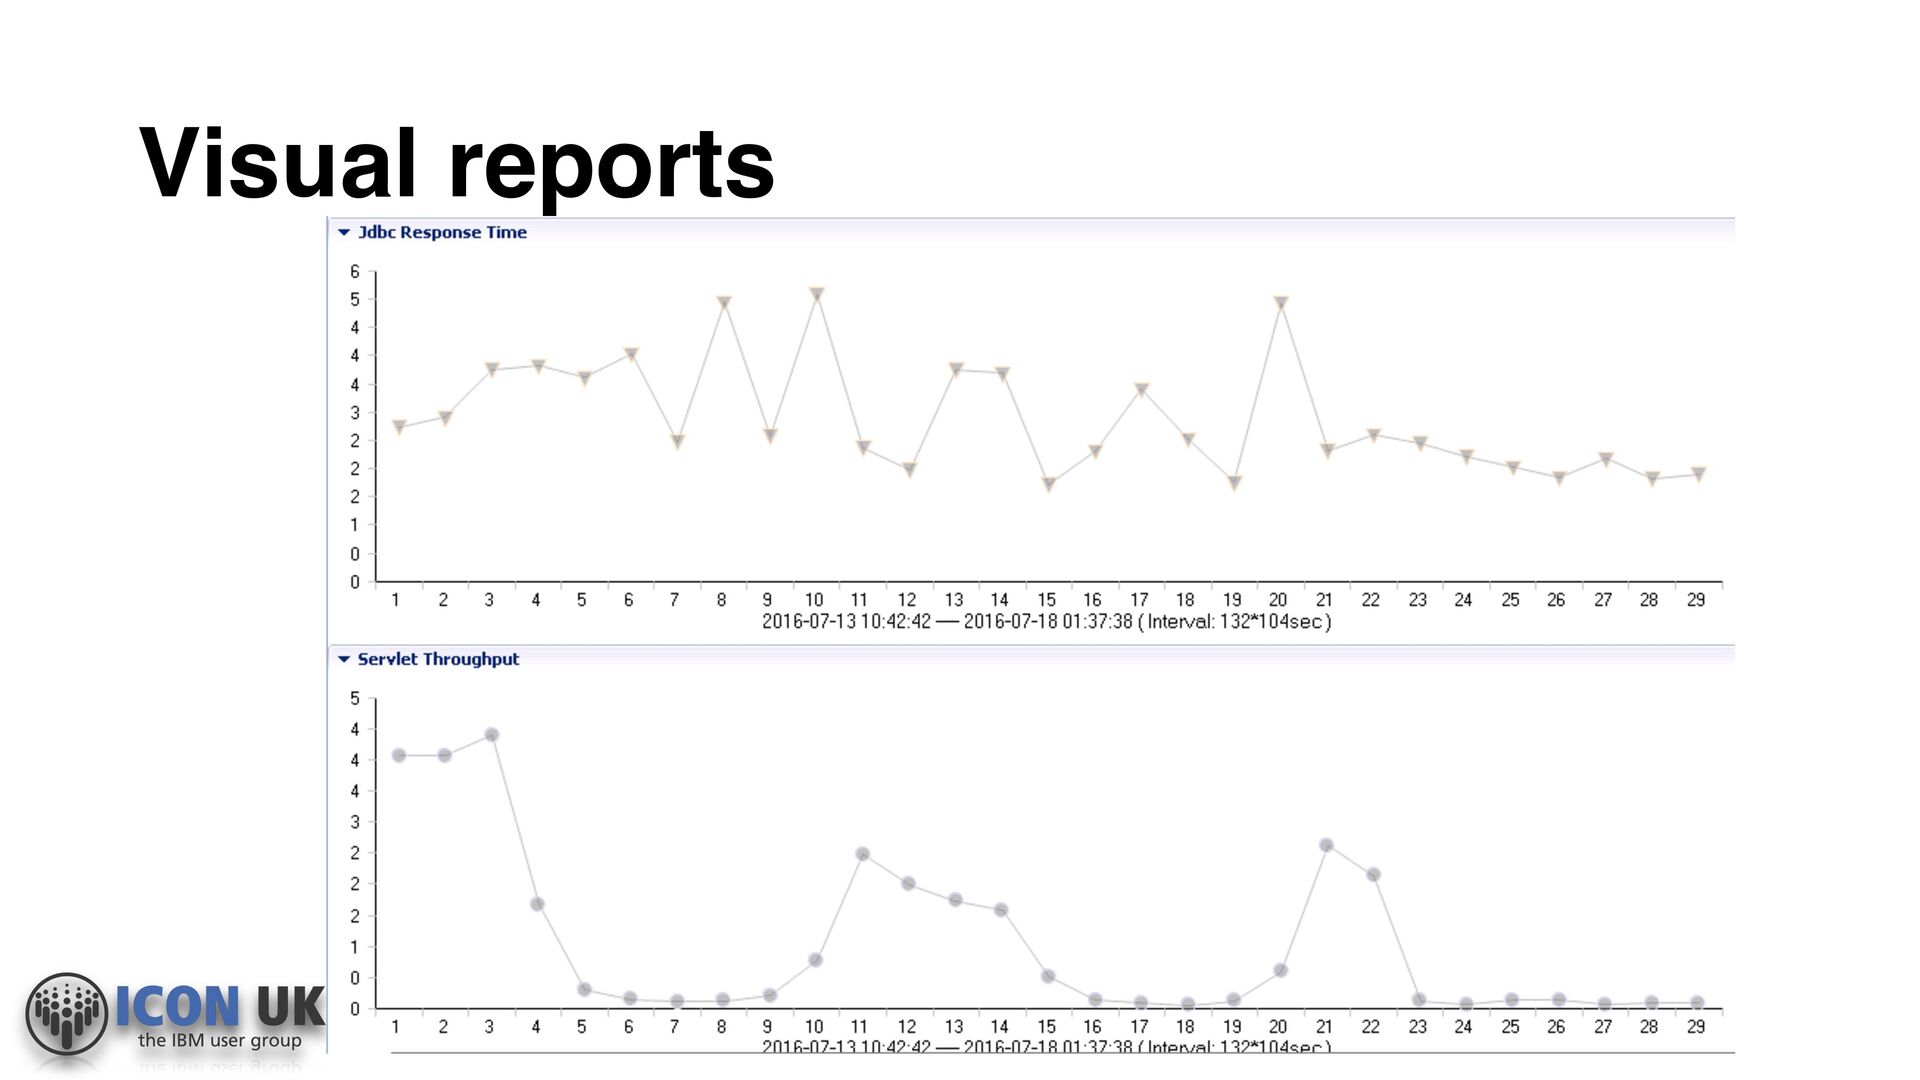
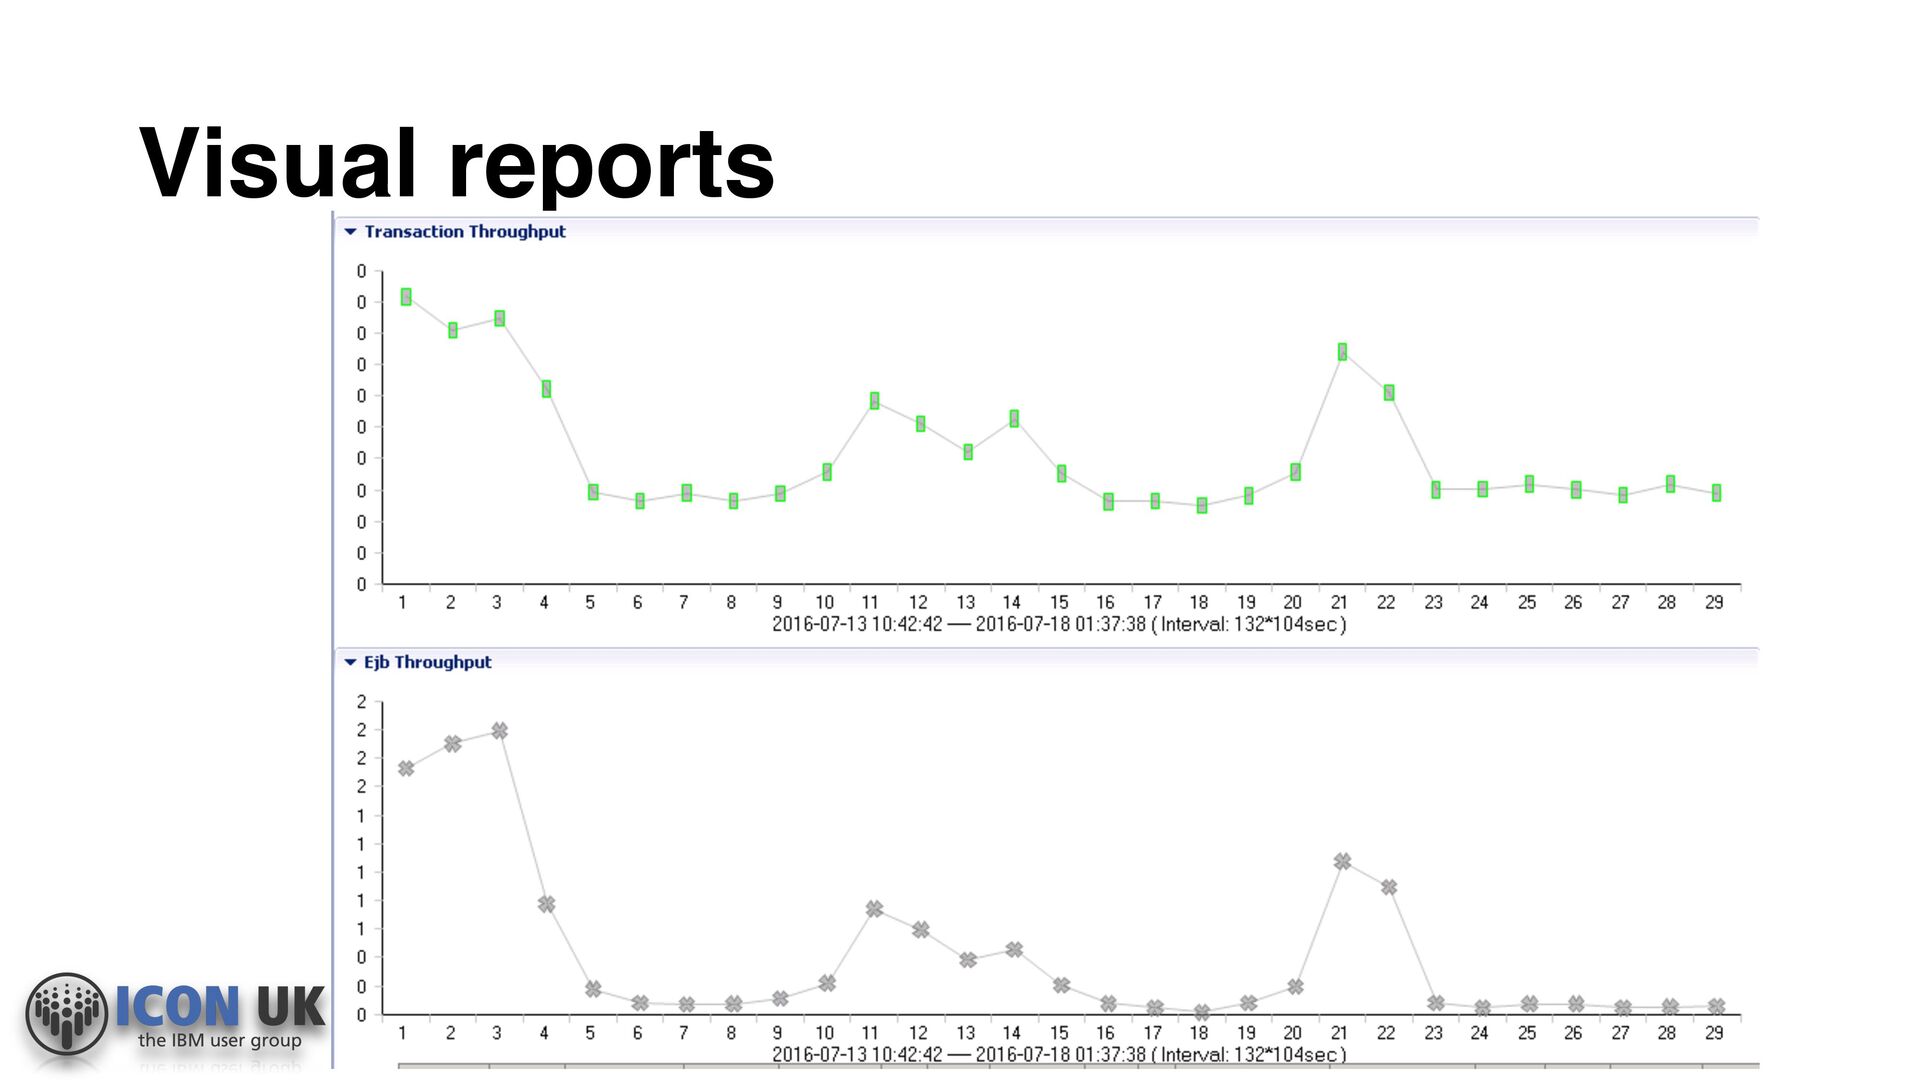
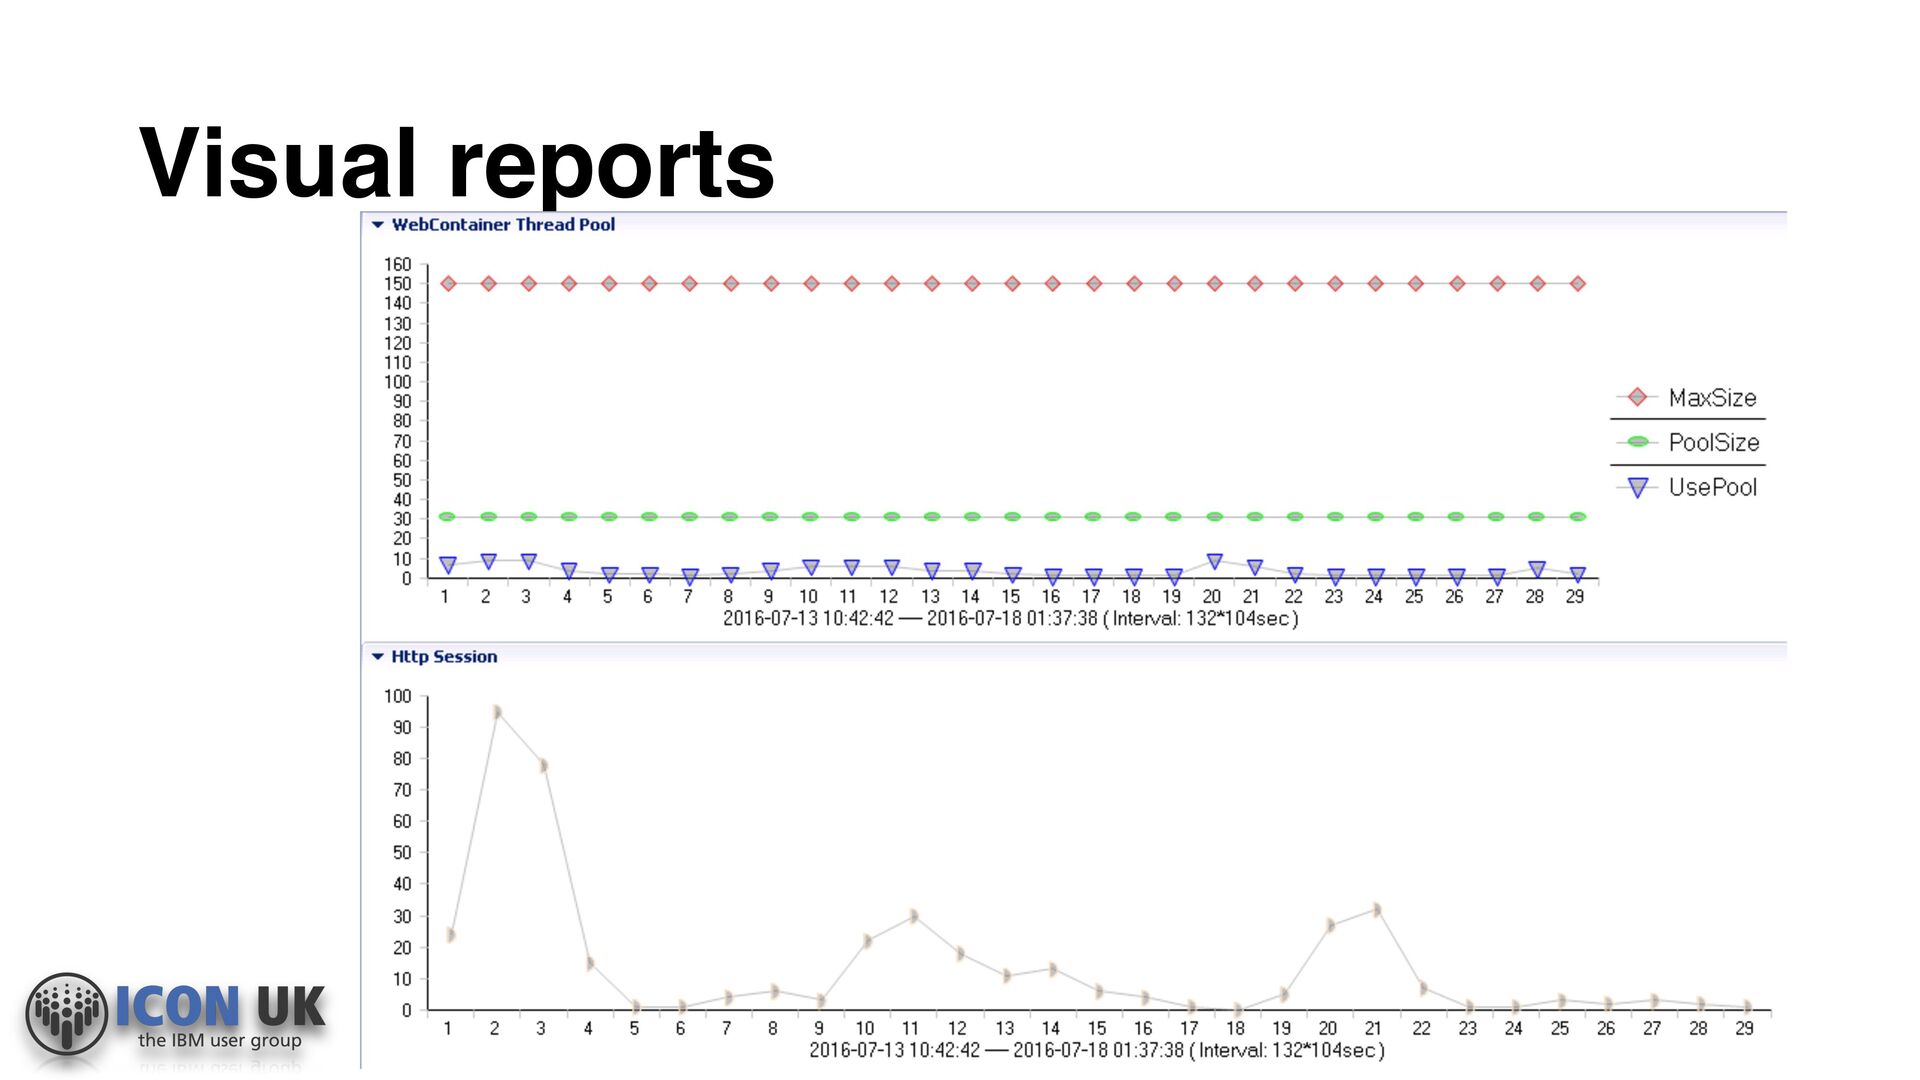
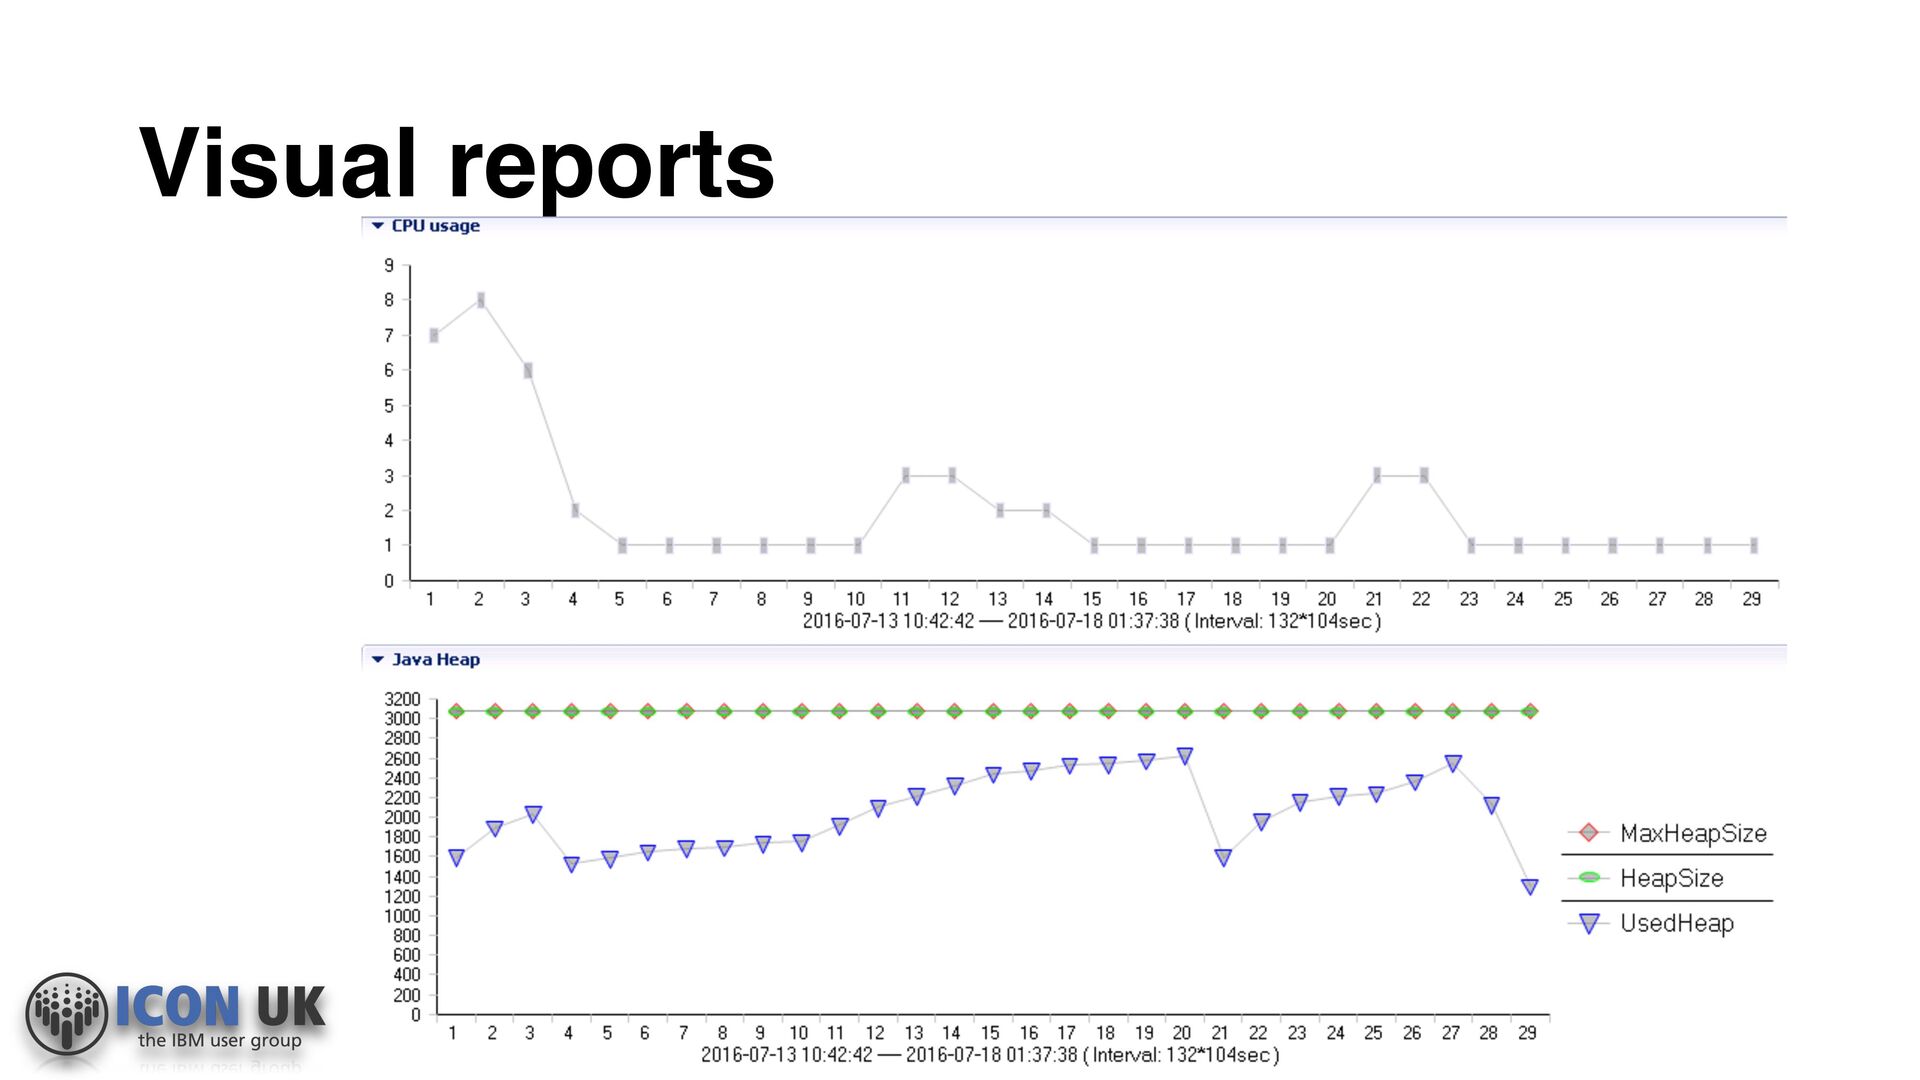
Down check on soap port of each server
    • Up or Down of host machine – via a ping or host up command
    • Plugins:
    https://github.com/yannlambret/websphere-nagios - JVM heap monitoring, Server thread pools monitoring - including
    hung thread detection, JTA transactions monitoring,JDBC datasources monitoring, JMS connection factories
    monitoring, JMS 1.0 listeners status monitoring, SIB queues depth monitoring, HTTP sessions monitoring, Clustering
    support, Administrative security support
    https://github.com/dvarounis/perfservmon - Perfservmon is a Nagios Plugin for IBM Websphere Application
    Server(WAS) using the perfservlet web application that comes with each WAS installation. Can monitor - Heap Usage,
    Web Container Thread Pool Usage, ORB Thread Pool Usage, JDBC Connection Pool Usage, Live HTTP Sessions, JMS
    SIB Destination(Queue, Topic) Metrics

    View Slide

  10. Nagios & HTTP
    • Basic HTTP monitoring
    • Ports up / down on 80, 443 and 8008
    • Can monitor for specific codes 500 / 404 etc.
    • WAS plugins in the previous slides also monitor HTTP sessions.

    View Slide

  11. Nagios & DB
    • Basic up and down check
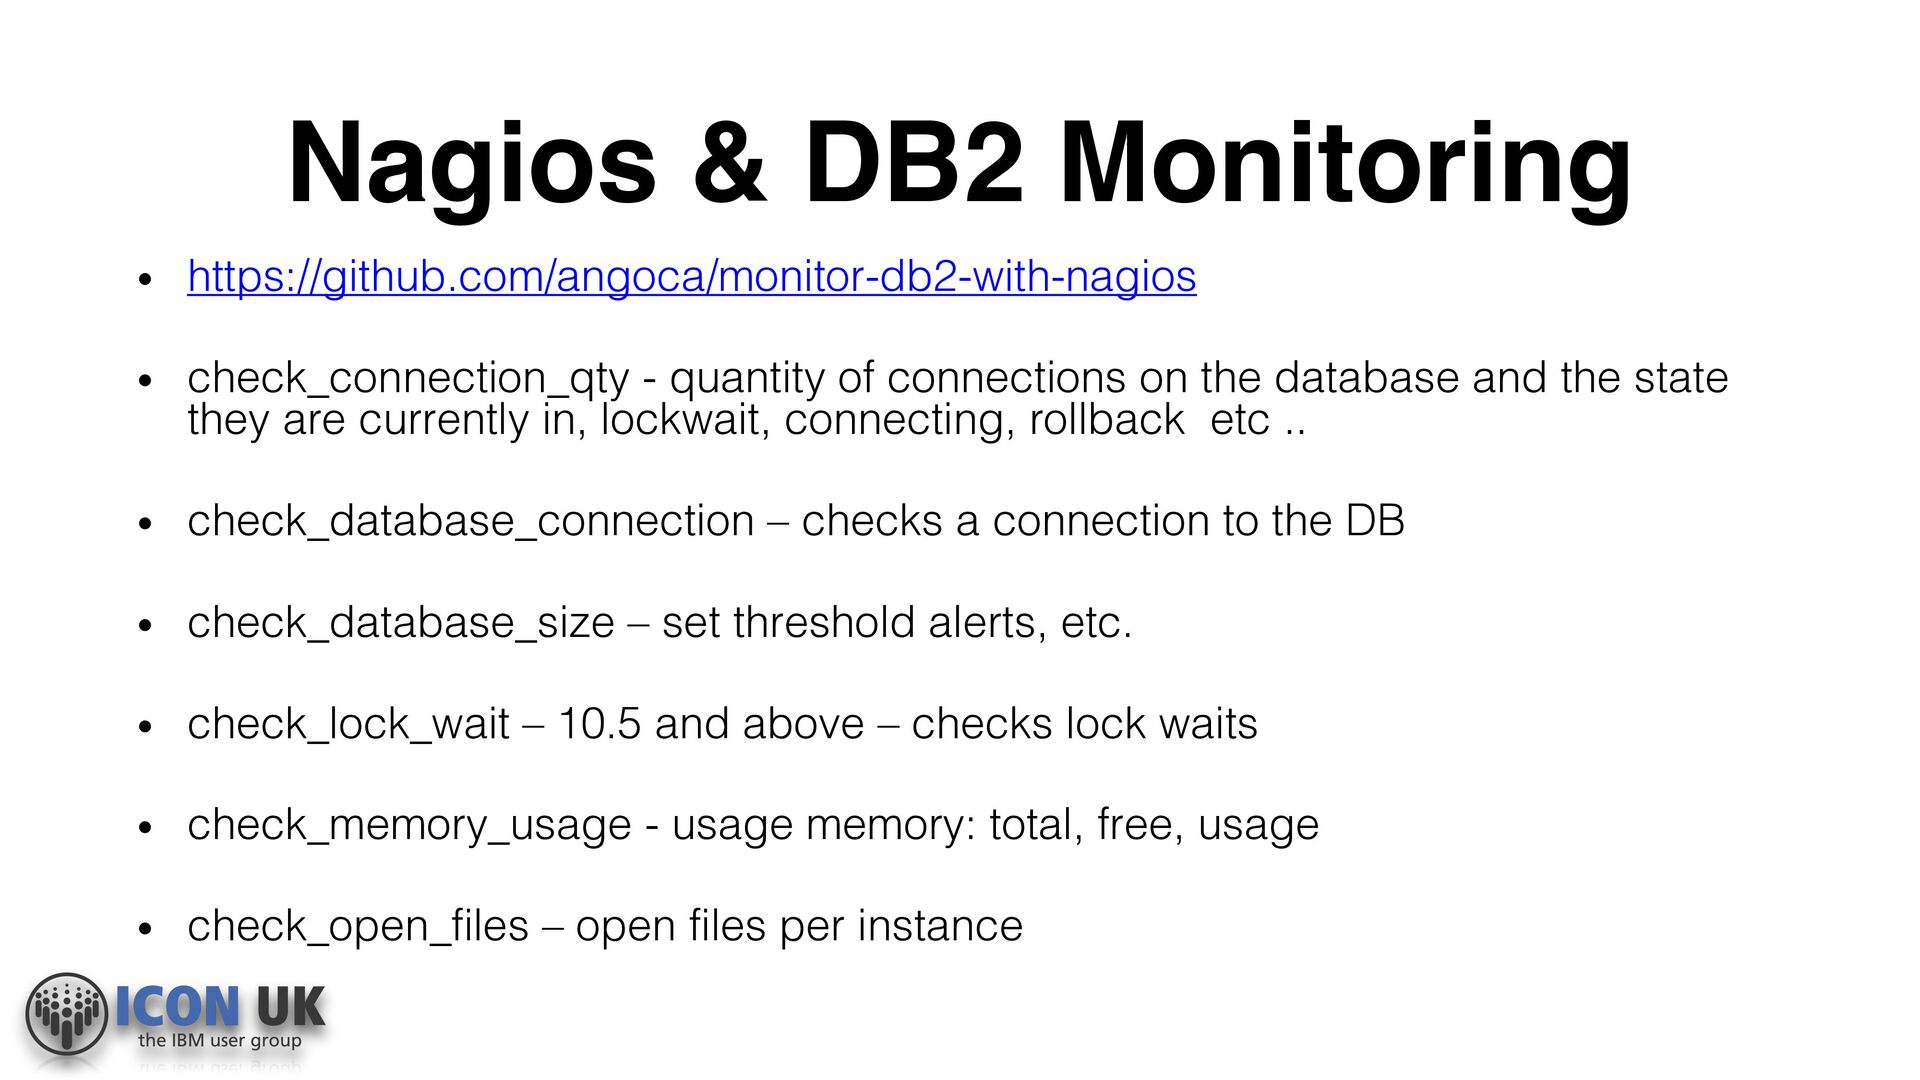
    • Lots of plugins for monitoring
    • https://github.com/angoca/monitor-db2-with-nagios - bunch of really useful stuff
    - check_hadr_status - works with V10.5
    - check_tablespace_size – 9.7 and up
    - check_db2diag –9.7 and up
    - check_instance_up – 9.7 and up
    - check_instance_memory – 9.7 and up
    - check_last_backup – 9.7 and up
    - check_log_consumption – 9.7 and up
    - check_log_usage – 9.7 and up

    View Slide

  12. Performance indicators WebSphere
    • WebSphere Application Server Performance Tuning Toolkit (PTT)
    • Free, Eclipse based tool provided by IBM
    • Yes, it’s free and from IBM and it works J

    View Slide

  13. WebSphere Application Server Performance
    Tuning Toolkit (WAS PTT)
    • Benefits:
    • No install on servers
    • Real time
    • Rule based
    • Easy to use interface

    View Slide

  14. WAS PTT
    • Install:
    • Download, unzip, run…
    • Configuration

    View Slide

  15. Data Collection

    View Slide

  16. Visual reports

    View Slide

  17. Visual reports

    View Slide

  18. Visual reports

    View Slide

  19. Visual reports

    View Slide

  20. Visual reports

    View Slide

  21. Visual reports

    View Slide

  22. Visual reports

    View Slide

  23. Reports
    • Ability to run reports (pdf, csv)

    View Slide

  24. WAS PTT
    • Ability to get tuning data (and update them)

    View Slide

  25. WAS PTT
    • Ability to generate:
    • Thread Dump
    • Heap Dump
    • Enable Trace
    • Show Connection Pool contents
    • Get Server Logs

    View Slide

  26. How to find performance indicators
    HTTP Server: mod_status
    • Apache module
    • HTML Interface:
    Ex. : http://www.apache.org/server-status

    View Slide

  27. How to find performance indicators
    HTTP Server: mod_status

    View Slide

  28. How to find performance indicators
    HTTP Server: mod_status
    • Easy to setup in httpd.conf

    View Slide

  29. Nmon Visualizer
    • Easier than the excel file
    • Open source tool
    • Developed by IBM to monitor Smartcloud
    • Apache 2.0 License
    • nmon files from Linux and AIX, IOStat files, IBM Verbose GC logs,
    Windows Perfmon & ESXTop csv data and JSON data

    View Slide

  30. Nmon Visualizer

    View Slide

  31. Nagios & DB2 Monitoring
    • Each script is individually configurable
    • Edit the script directly or use GUI config (nagiosQL)
    • Alerting settings are configured at
    Nagios level

    View Slide

  32. Nagios & DB2 Monitoring
    • https://github.com/angoca/monitor-db2-with-nagios
    • check_connection_qty - quantity 
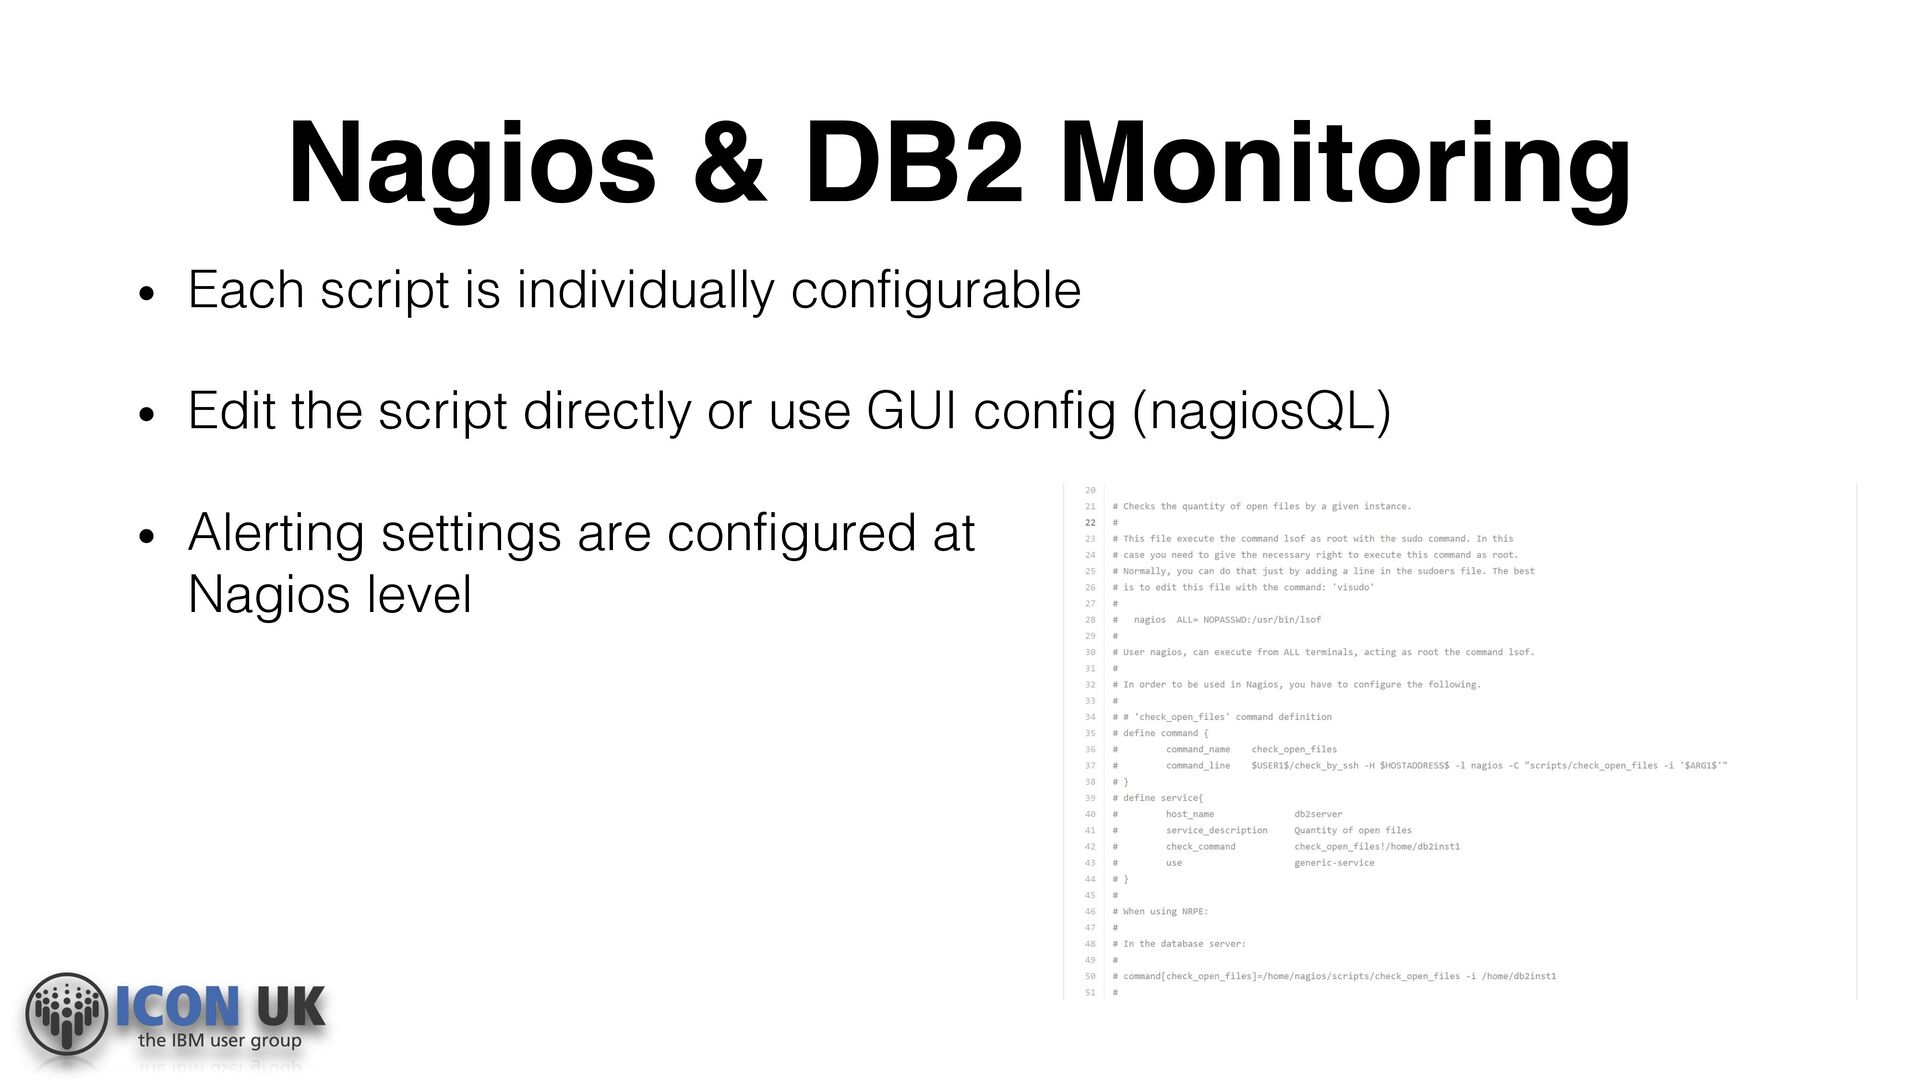
of connections on the database and the state
    they are currently in, lockwait, connecting, rollback etc ..
    • check_database_connection – checks a connection to the DB
    • check_database_size – set threshold alerts, etc.
    • check_lock_wait – 10.5 and above – checks lock waits
    • check_memory_usage - usage memory: total, free, usage
    • check_open_files – open files per instance

    View Slide

  33. References and links
    • Performance Tuning Toolkit
    • http://www.ibm.com/developerworks/websphere/downloads/performtuning.ht
    ml
    • Mod_status
    • http://www.tecmint.com/monitor-apache-web-server-load-and-page-statistics/
    • Nmon Visualizer
    • http://nmonvisualizer.github.io/nmonvisualizer/

    View Slide

  34. References and links
    • Nagios
    • Core Download - https://www.nagios.org/downloads/nagios-core/
    • Nagios Exchange - https://exchange.nagios.org
    • DB2 Plugins - https://github.com/angoca/monitor-db2-with-nagios
    http://www.dbatodba.com/db2/scripts-db2/nagios-plugins/
    • WebSphere Plugins - https://github.com/yannlambret/websphere-nagios
    https://github.com/dvarounis/perfservmon

    View Slide

  35. Any Questions?

    View Slide

  36. Thank you
    http://socialshazza.com
    dilftechnical
    @socialshazza
    http://ramsit.com/blog
    wannesrams
    @wannesrams

    View Slide