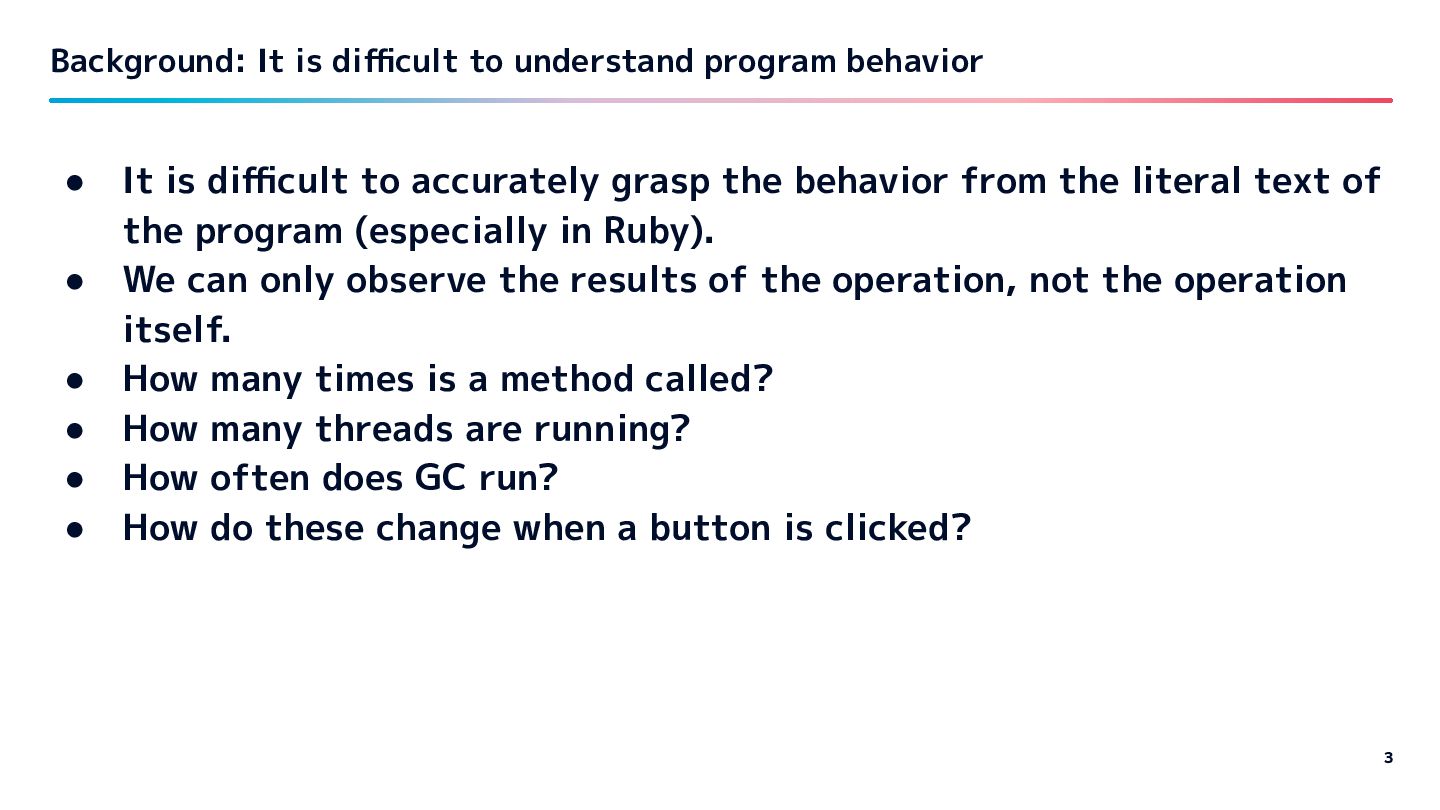
is difficult to accurately grasp the behavior from the literal text of the program (especially in Ruby). • We can only observe the results of the operation, not the operation itself. • How many times is a method called? • How many threads are running? • How often does GC run? • How do these change when a button is clicked? 3
Development machines has many (>=10) cores. • All cores other than the single core Ruby uses can be employed for analysis. • The z-axis we perceive is not being utilized. • CRuby is well-suited for creating such an observation tool. • Wouldn't it be fun to see CRuby's behavior in real-time? 5
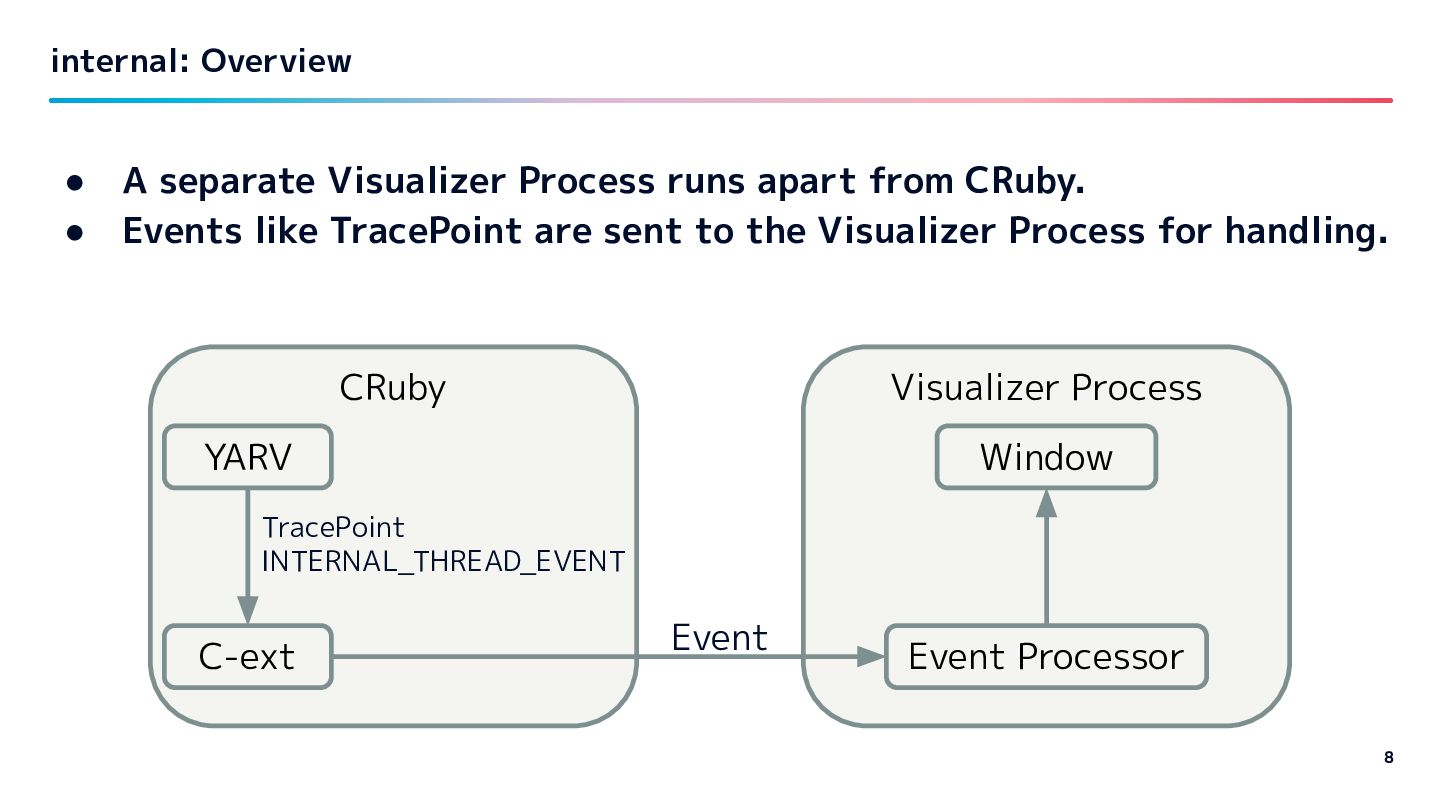
CRuby. • Events like TracePoint are sent to the Visualizer Process for handling. 8 CRuby YARV C-ext TracePoint INTERNAL_THREAD_EVENT Visualizer Process Event Processor Event Window
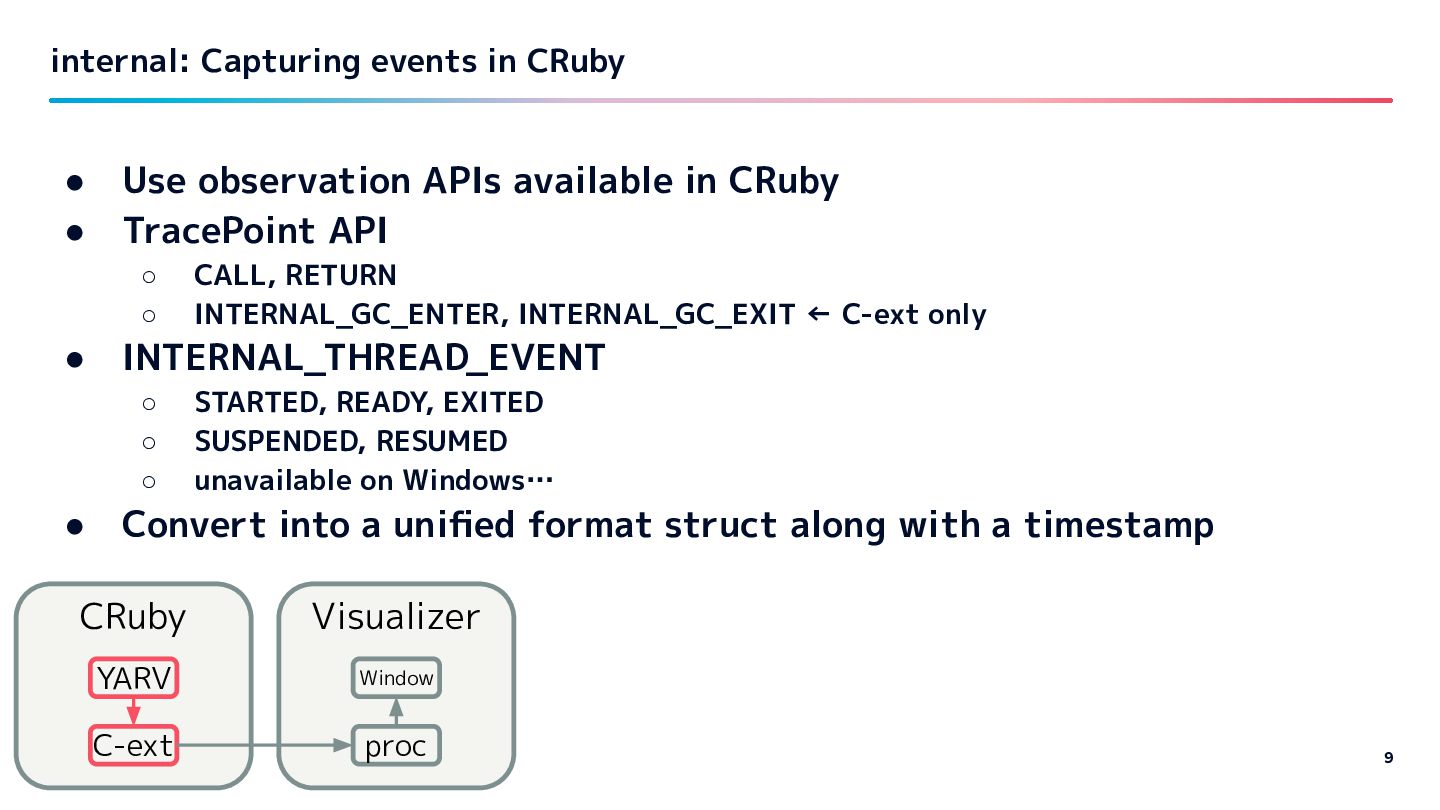
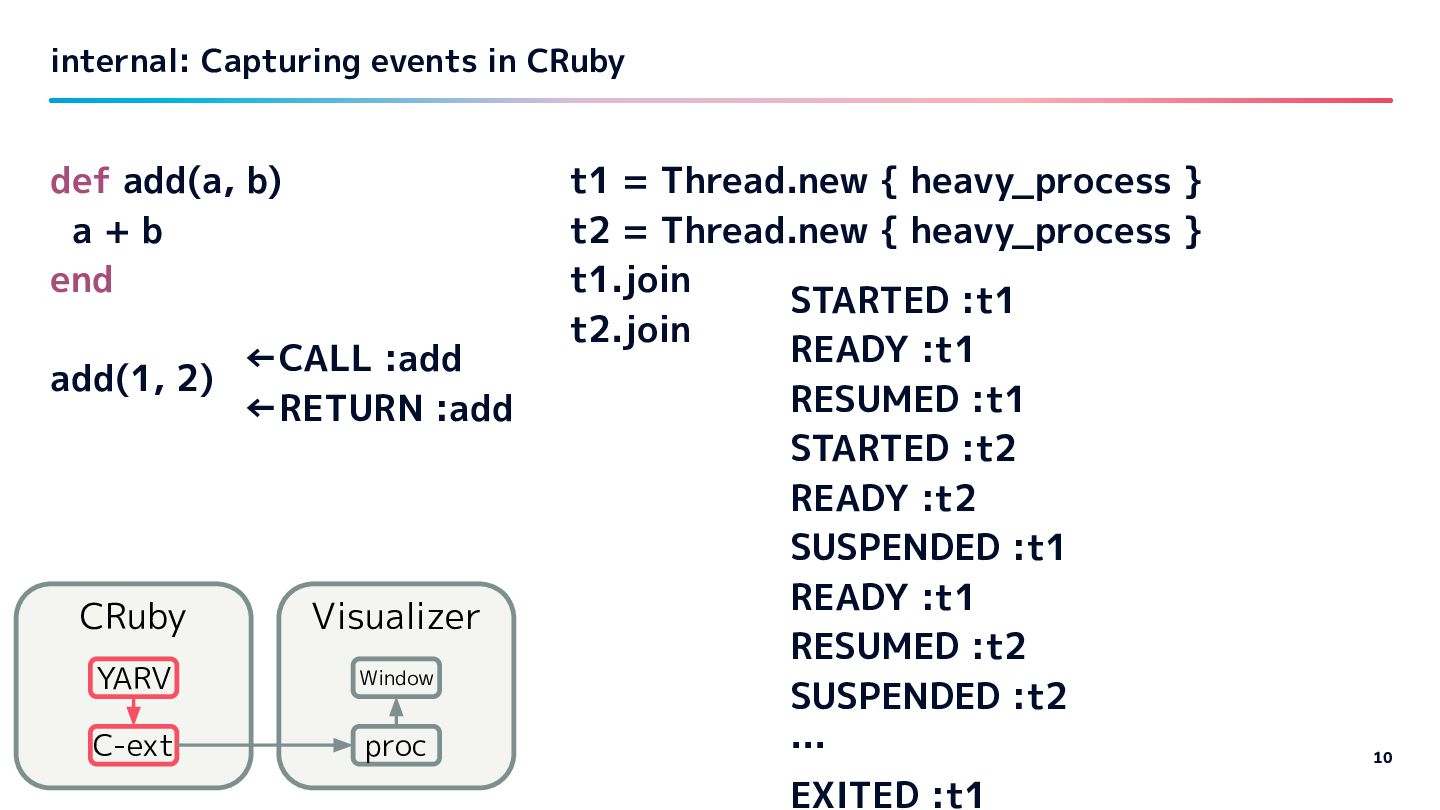
in CRuby • TracePoint API ◦ CALL, RETURN ◦ INTERNAL_GC_ENTER, INTERNAL_GC_EXIT ← C-ext only • INTERNAL_THREAD_EVENT ◦ STARTED, READY, EXITED ◦ SUSPENDED, RESUMED ◦ unavailable on Windows… • Convert into a unified format struct along with a timestamp 9 CRuby YARV C-ext Visualizer proc Window
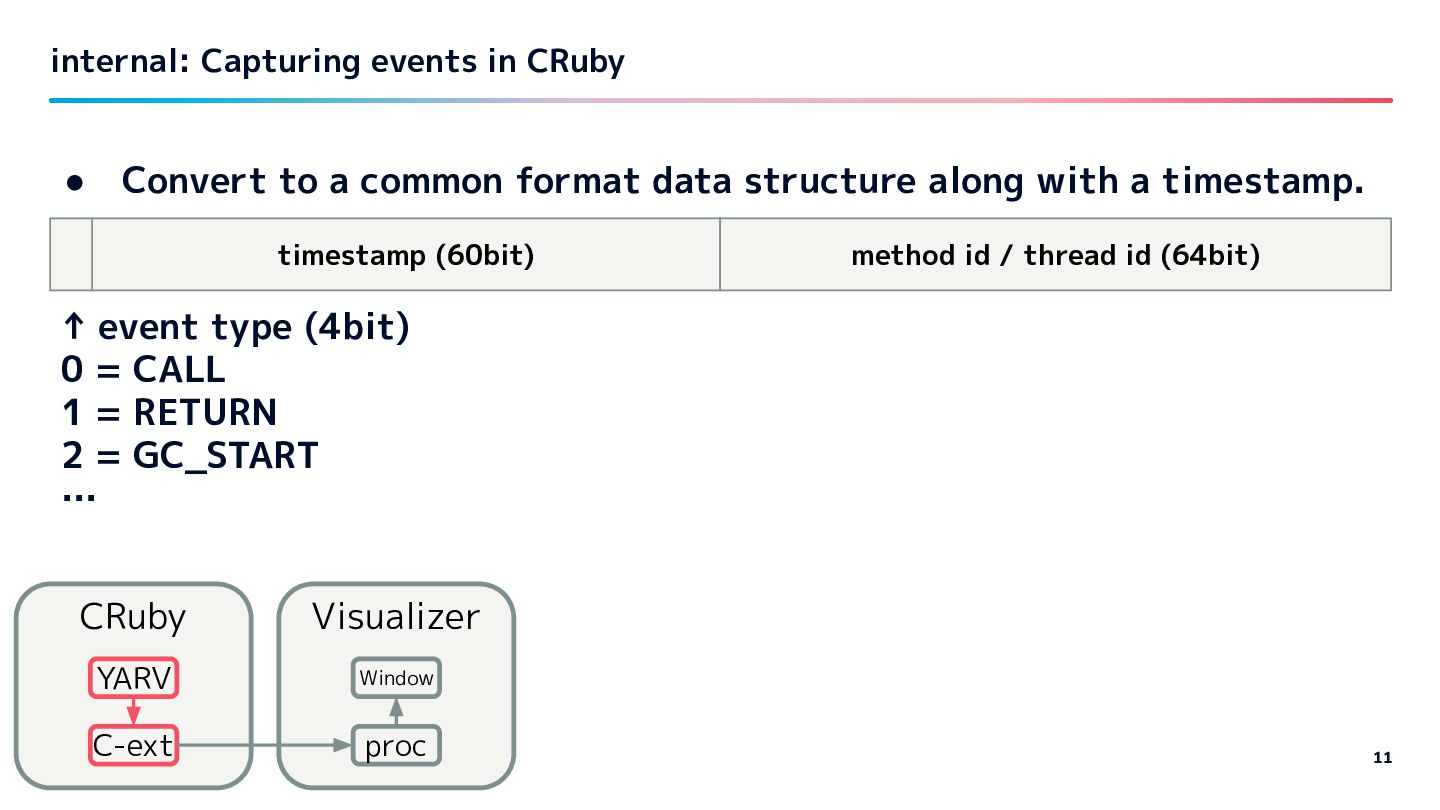
format data structure along with a timestamp. 11 CRuby YARV C-ext Visualizer proc Window timestamp (60bit) method id / thread id (64bit) ↑ event type (4bit) 0 = CALL 1 = RETURN 2 = GC_START …
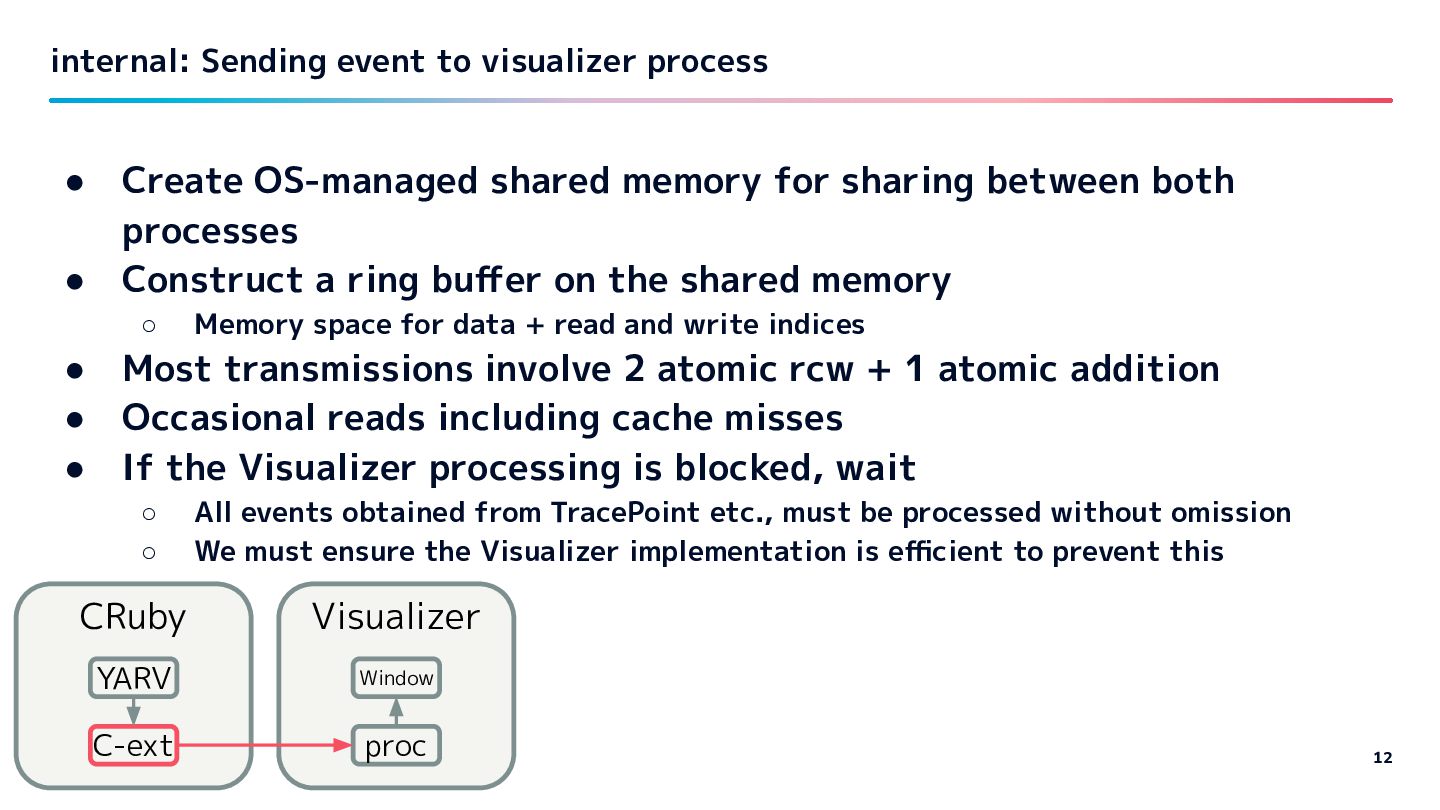
memory for sharing between both processes • Construct a ring buffer on the shared memory ◦ Memory space for data + read and write indices • Most transmissions involve 2 atomic rcw + 1 atomic addition • Occasional reads including cache misses • If the Visualizer processing is blocked, wait ◦ All events obtained from TracePoint etc., must be processed without omission ◦ We must ensure the Visualizer implementation is efficient to prevent this 12 CRuby YARV C-ext Visualizer proc Window
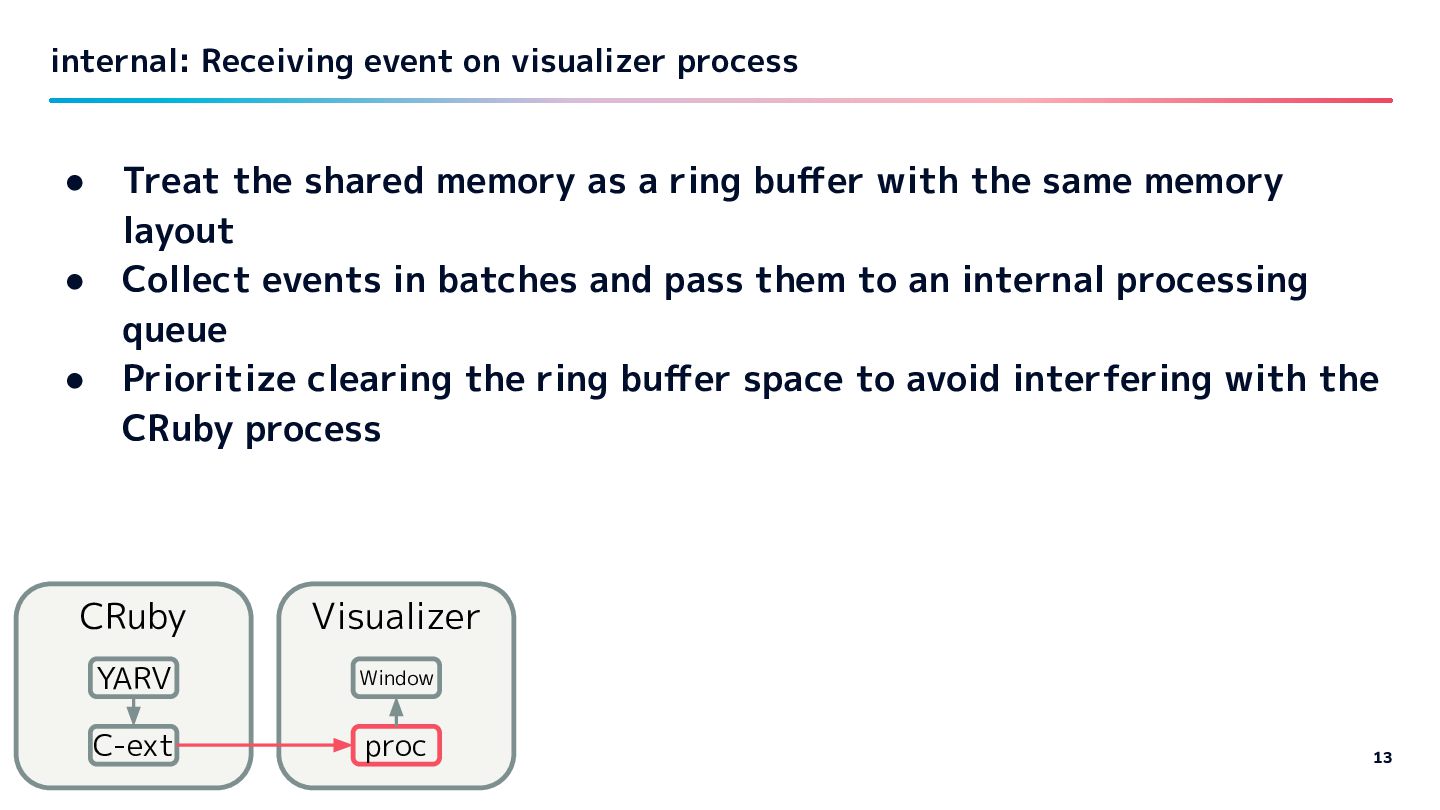
memory as a ring buffer with the same memory layout • Collect events in batches and pass them to an internal processing queue • Prioritize clearing the ring buffer space to avoid interfering with the CRuby process 13 CRuby YARV C-ext Visualizer proc Window
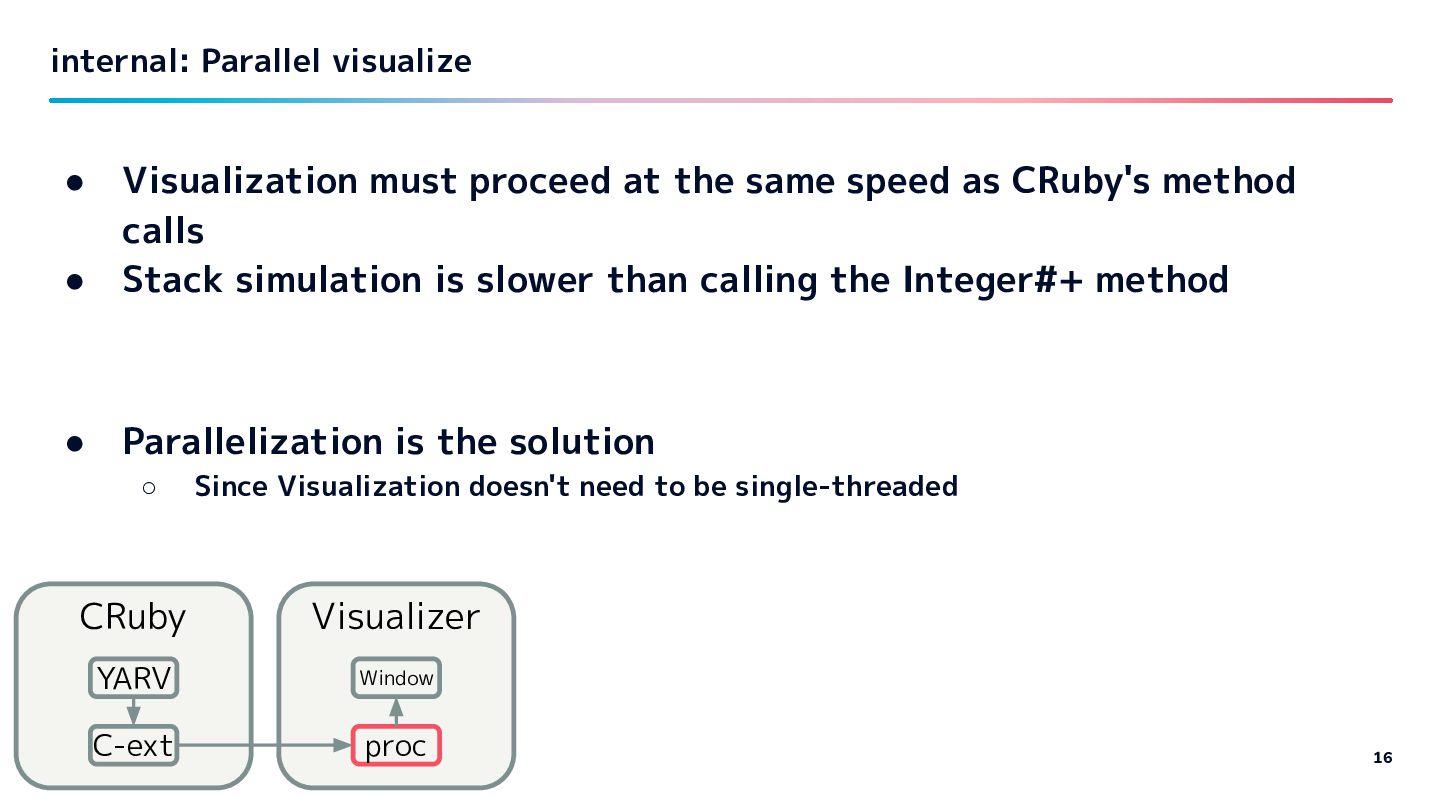
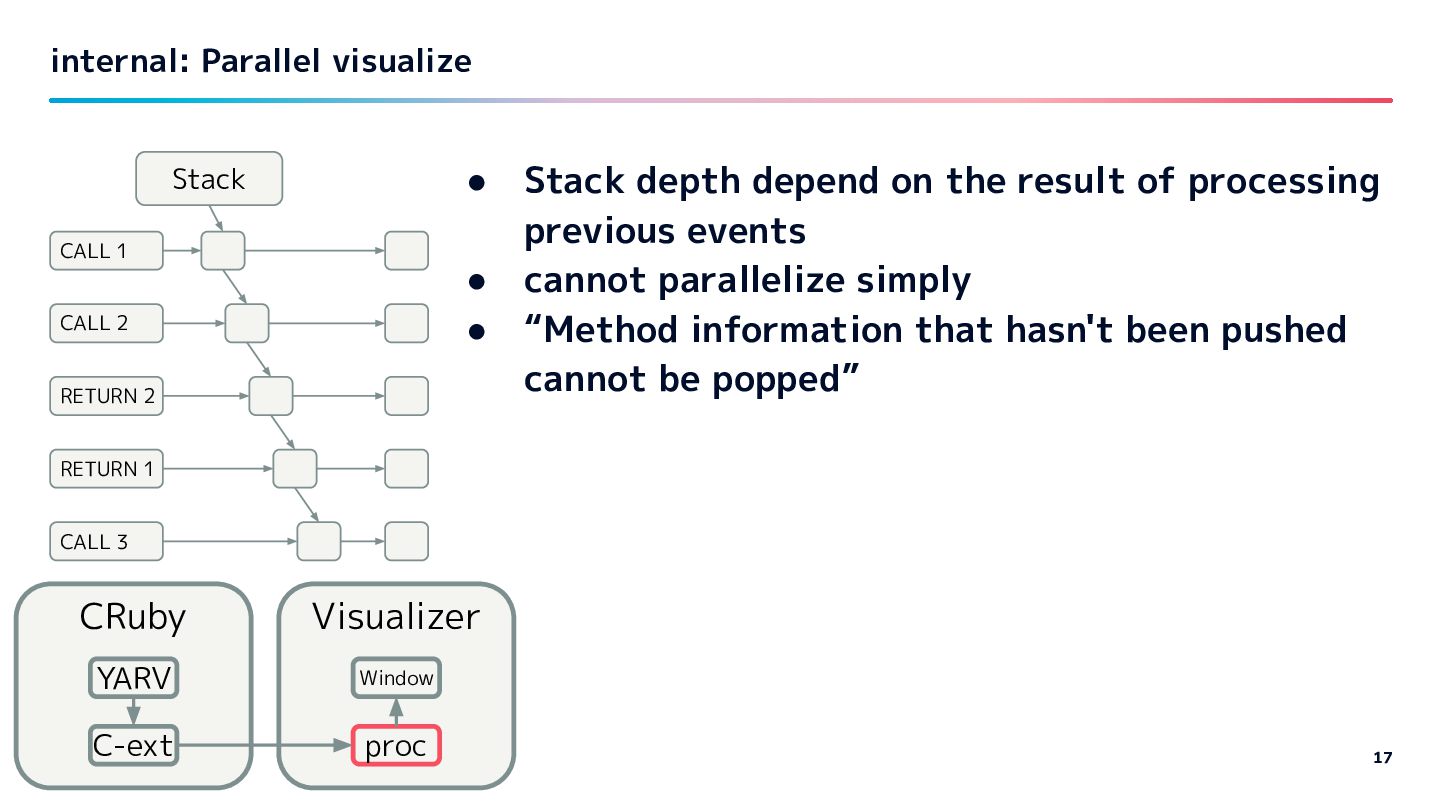
speed as CRuby's method calls • Stack simulation is slower than calling the Integer#+ method • Parallelization is the solution ◦ Since Visualization doesn't need to be single-threaded 16 CRuby YARV C-ext Visualizer proc Window
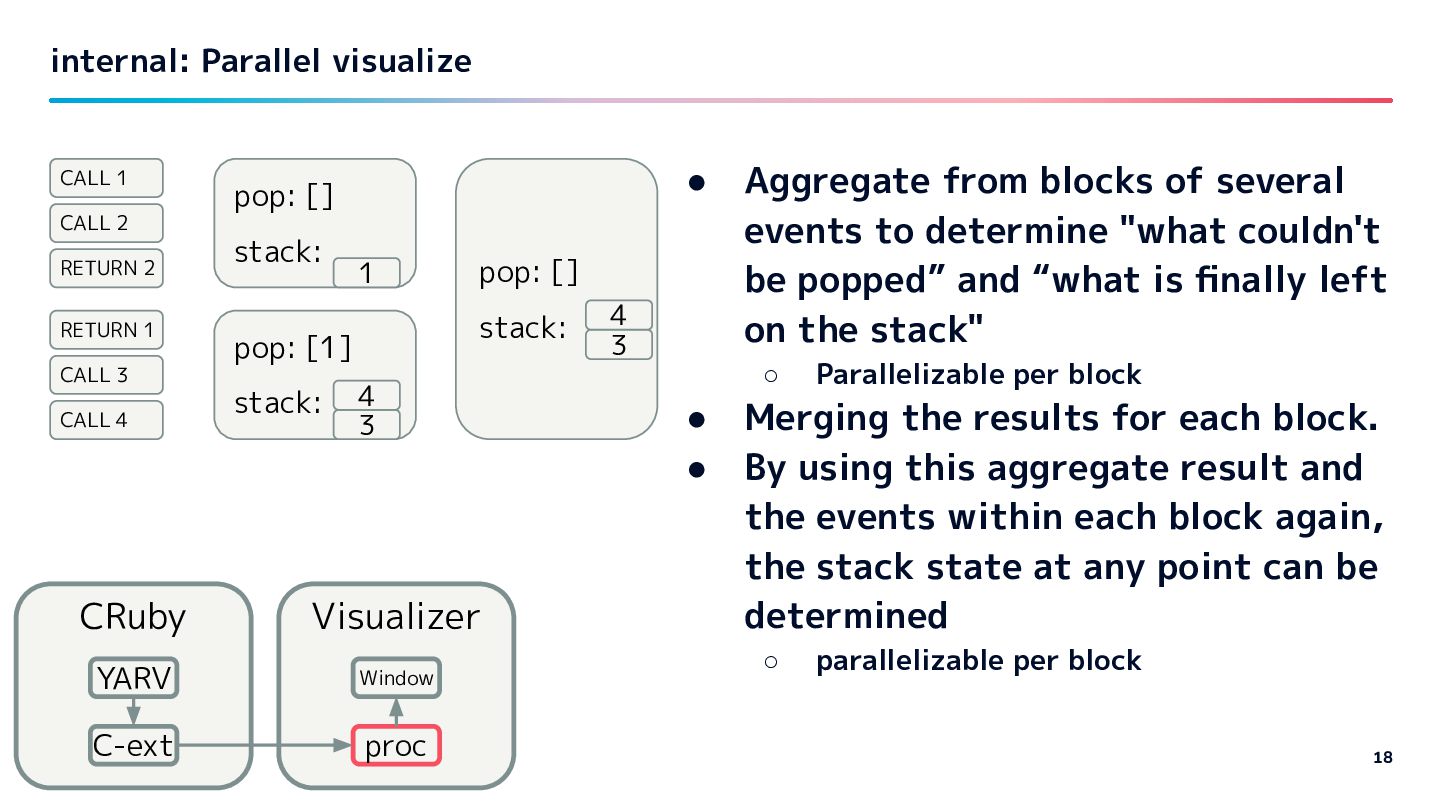
to determine "what couldn't be popped” and “what is finally left on the stack" ◦ Parallelizable per block • Merging the results for each block. • By using this aggregate result and the events within each block again, the stack state at any point can be determined ◦ parallelizable per block 18 CRuby YARV C-ext Visualizer proc Window CALL 1 CALL 2 RETURN 2 RETURN 1 CALL 3 CALL 4 pop: [1] stack: 3 4 pop: [] stack: 1 pop: [] stack: 3 4
of CRuby internals is possible with modern resources ◦ with not small performance overhead... • Open problems ◦ Multi-process/Ractor support ◦ GUI design 21