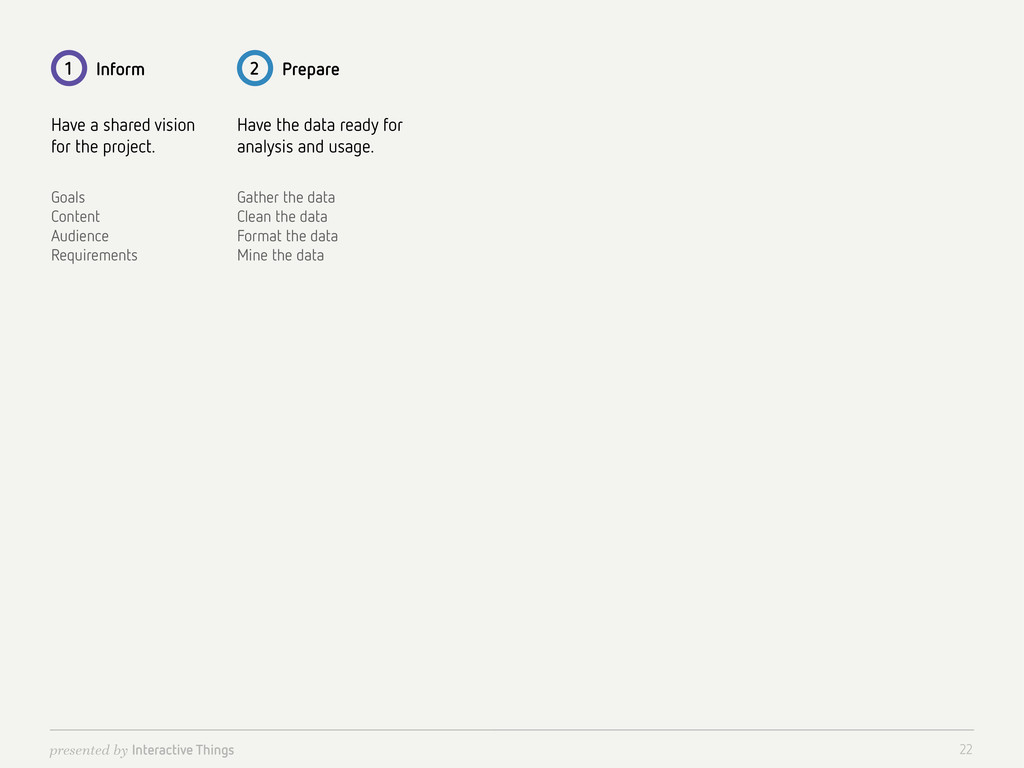
the project. Inform 1 Content Requirements Audience Goals Have the data ready for analysis and usage. Prepare 2 Gather the data Clean the data Format the data Mine the data
the project. Inform 1 Content Requirements Audience Goals Have the data ready for analysis and usage. Prepare 2 Gather the data Clean the data Format the data Mine the data Understand the texture of the data. Explore 3 Ask questions of the data Inspect the data Explore the data Analyze the data
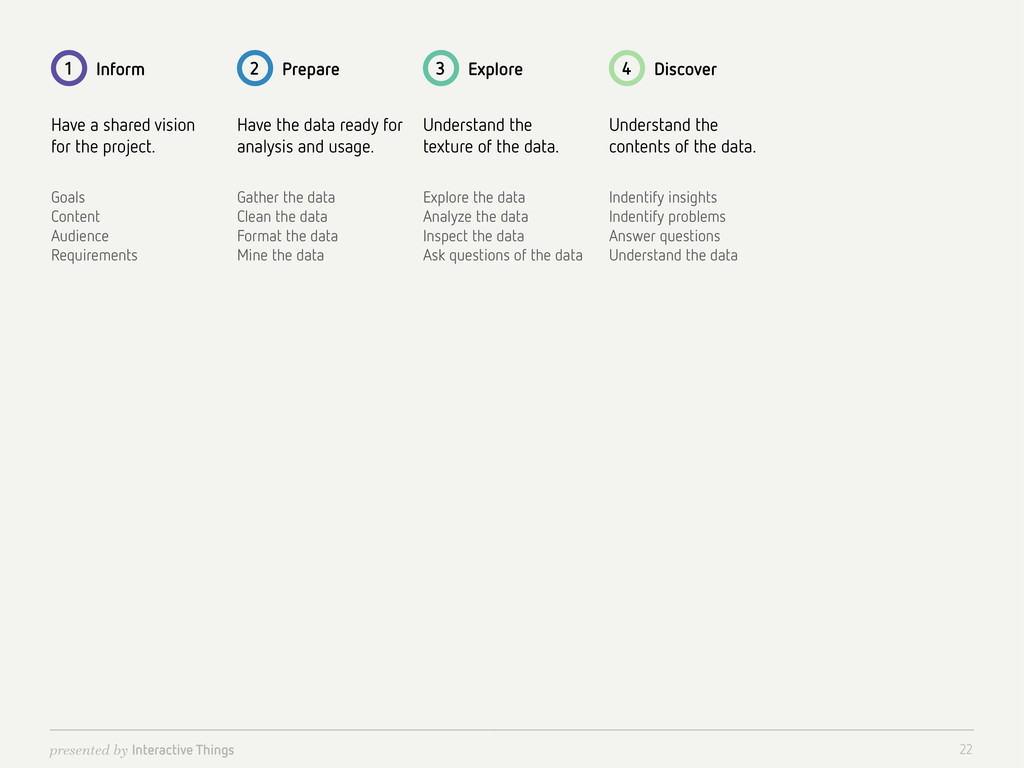
the project. Inform 1 Content Requirements Audience Goals Have the data ready for analysis and usage. Prepare 2 Gather the data Clean the data Format the data Mine the data Understand the texture of the data. Explore 3 Ask questions of the data Inspect the data Explore the data Analyze the data Understand the contents of the data. Discover 4 Indentify problems Answer questions Understand the data Indentify insights
the project. Inform 1 Content Requirements Audience Goals Have the data ready for analysis and usage. Prepare 2 Gather the data Clean the data Format the data Mine the data Understand the texture of the data. Explore 3 Ask questions of the data Inspect the data Explore the data Analyze the data Understand the contents of the data. Discover 4 Indentify problems Answer questions Understand the data Indentify insights Trying out and testing ideas visually. Sketch 5 Sketch on paper Sketch in code Explore range of concepts Draft visualization ideas
the project. Inform 1 Content Requirements Audience Goals Have the data ready for analysis and usage. Prepare 2 Gather the data Clean the data Format the data Mine the data Understand the texture of the data. Explore 3 Ask questions of the data Inspect the data Explore the data Analyze the data Understand the contents of the data. Discover 4 Indentify problems Answer questions Understand the data Indentify insights Trying out and testing ideas visually. Sketch 5 Sketch on paper Sketch in code Explore range of concepts Draft visualization ideas Verifiy the selected visualization method. Question 6 Review Ask questions Get feedback Get perspectives
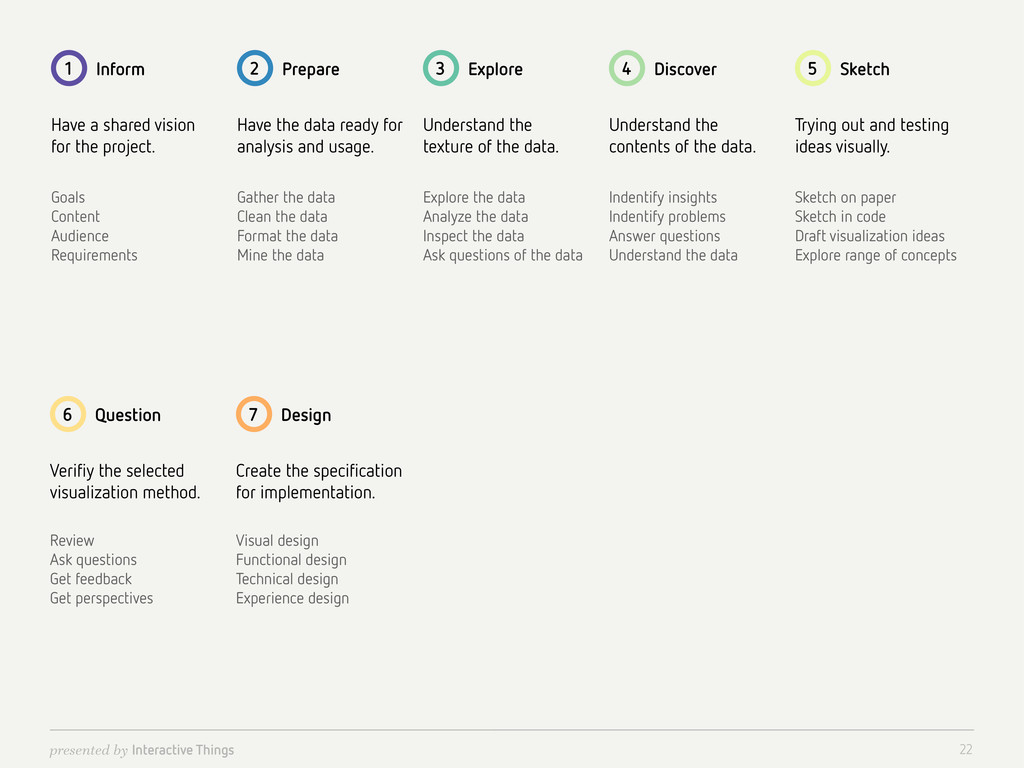
the project. Inform 1 Content Requirements Audience Goals Have the data ready for analysis and usage. Prepare 2 Gather the data Clean the data Format the data Mine the data Understand the texture of the data. Explore 3 Ask questions of the data Inspect the data Explore the data Analyze the data Understand the contents of the data. Discover 4 Indentify problems Answer questions Understand the data Indentify insights Trying out and testing ideas visually. Sketch 5 Sketch on paper Sketch in code Explore range of concepts Draft visualization ideas Verifiy the selected visualization method. Question 6 Review Ask questions Get feedback Get perspectives Create the specification for implementation. Design 7 Visual design Functional design Technical design Experience design
the project. Inform 1 Content Requirements Audience Goals Have the data ready for analysis and usage. Prepare 2 Gather the data Clean the data Format the data Mine the data Understand the texture of the data. Explore 3 Ask questions of the data Inspect the data Explore the data Analyze the data Understand the contents of the data. Discover 4 Indentify problems Answer questions Understand the data Indentify insights Trying out and testing ideas visually. Sketch 5 Sketch on paper Sketch in code Explore range of concepts Draft visualization ideas Verifiy the selected visualization method. Question 6 Review Ask questions Get feedback Get perspectives Create the specification for implementation. Design 7 Visual design Functional design Technical design Experience design Build a flawlessly working application. Develop 8 Refine Polish Build Iterate
the project. Inform 1 Content Requirements Audience Goals Have the data ready for analysis and usage. Prepare 2 Gather the data Clean the data Format the data Mine the data Understand the texture of the data. Explore 3 Ask questions of the data Inspect the data Explore the data Analyze the data Understand the contents of the data. Discover 4 Indentify problems Answer questions Understand the data Indentify insights Trying out and testing ideas visually. Sketch 5 Sketch on paper Sketch in code Explore range of concepts Draft visualization ideas Verifiy the selected visualization method. Question 6 Review Ask questions Get feedback Get perspectives Create the specification for implementation. Design 7 Visual design Functional design Technical design Experience design Build a flawlessly working application. Develop 8 Refine Polish Build Iterate Ensure the result is readable and usable. Evaluate 9 Usability testing Design evaluation Expert review Usage observation
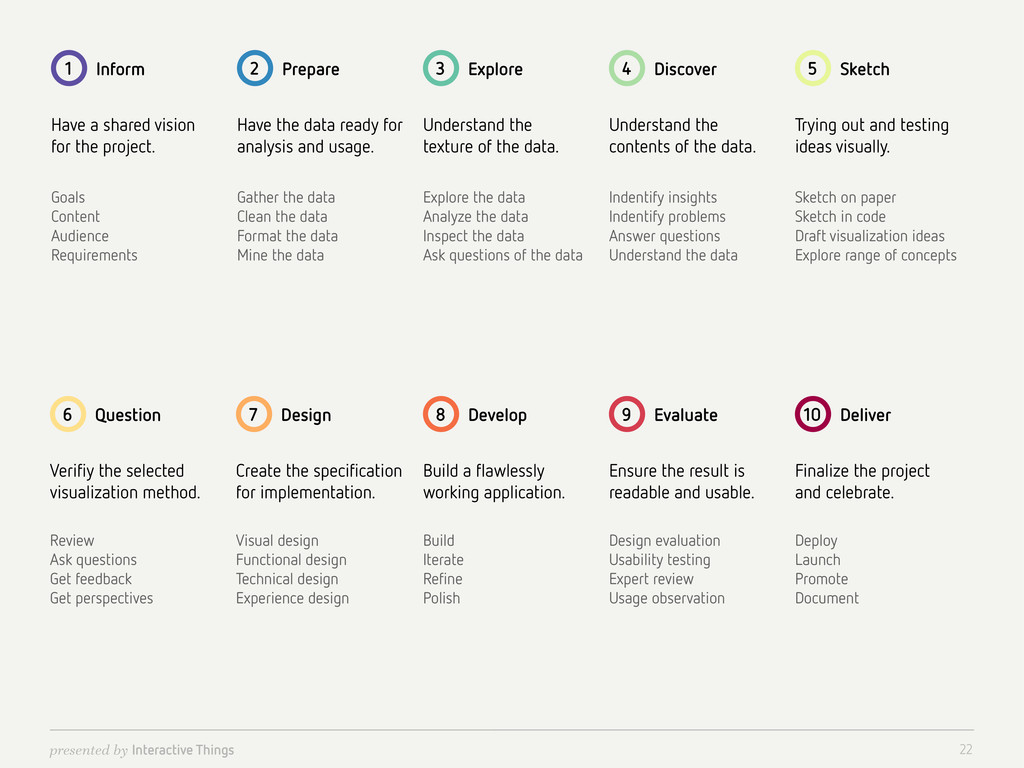
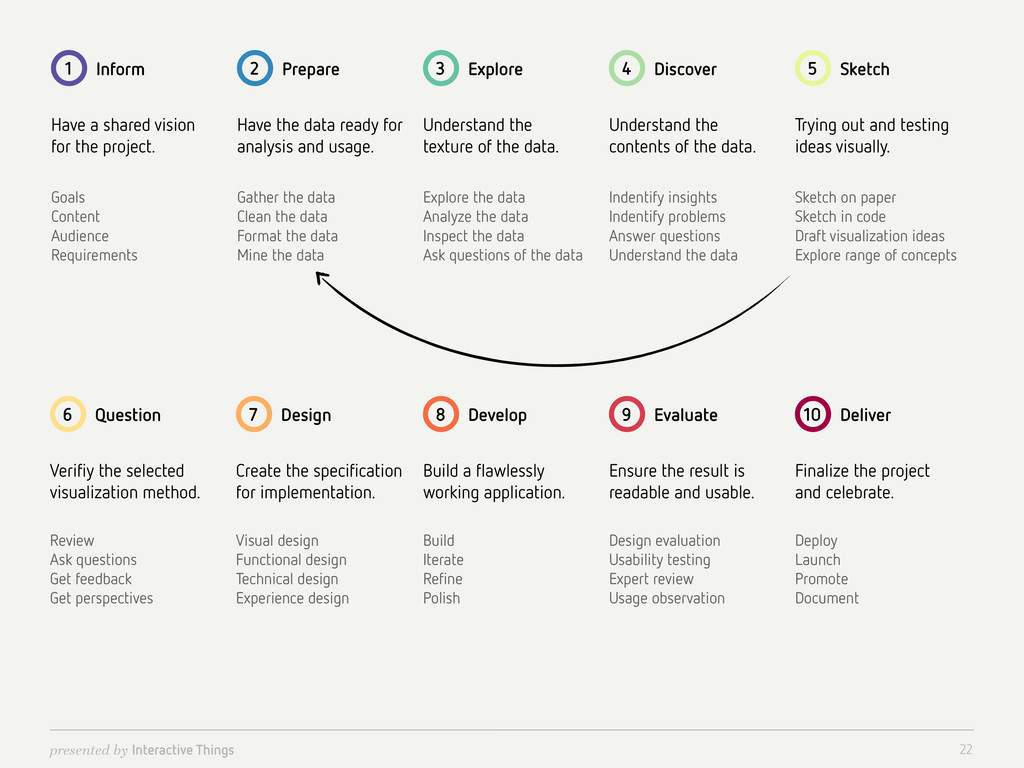
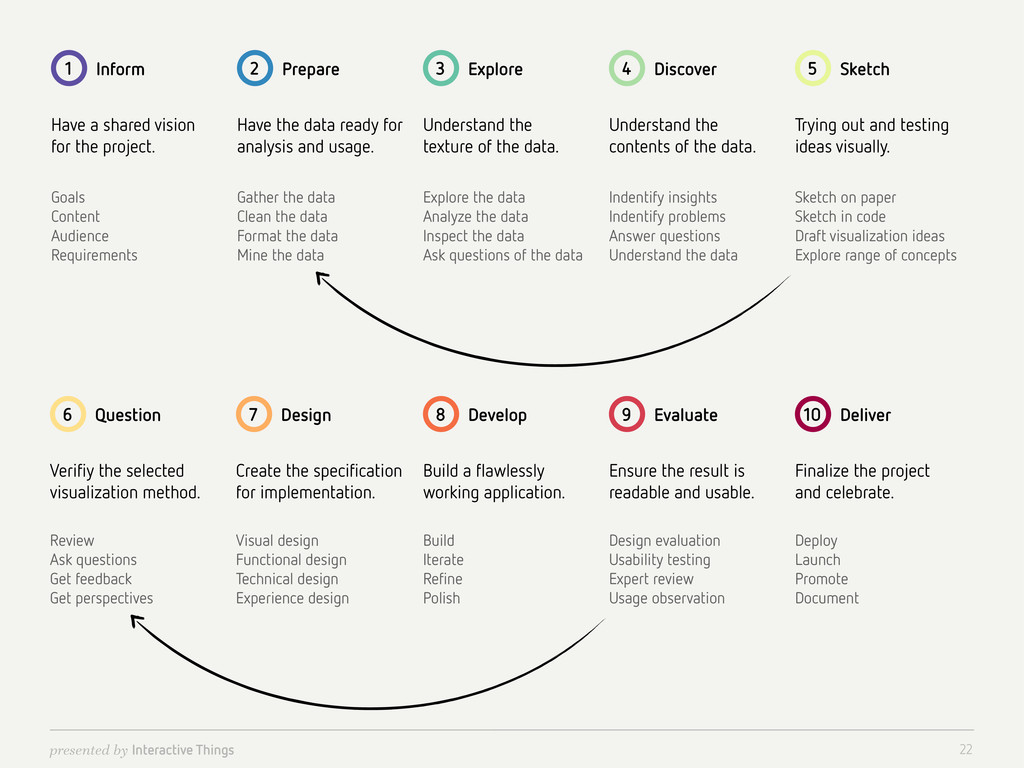
the project. Inform 1 Content Requirements Audience Goals Have the data ready for analysis and usage. Prepare 2 Gather the data Clean the data Format the data Mine the data Understand the texture of the data. Explore 3 Ask questions of the data Inspect the data Explore the data Analyze the data Understand the contents of the data. Discover 4 Indentify problems Answer questions Understand the data Indentify insights Trying out and testing ideas visually. Sketch 5 Sketch on paper Sketch in code Explore range of concepts Draft visualization ideas Verifiy the selected visualization method. Question 6 Review Ask questions Get feedback Get perspectives Create the specification for implementation. Design 7 Visual design Functional design Technical design Experience design Build a flawlessly working application. Develop 8 Refine Polish Build Iterate Ensure the result is readable and usable. Evaluate 9 Usability testing Design evaluation Expert review Usage observation Finalize the project and celebrate. Deliver 10 Launch Promote Deploy Document
the project. Inform 1 Content Requirements Audience Goals Have the data ready for analysis and usage. Prepare 2 Gather the data Clean the data Format the data Mine the data Understand the texture of the data. Explore 3 Ask questions of the data Inspect the data Explore the data Analyze the data Understand the contents of the data. Discover 4 Indentify problems Answer questions Understand the data Indentify insights Trying out and testing ideas visually. Sketch 5 Sketch on paper Sketch in code Explore range of concepts Draft visualization ideas Verifiy the selected visualization method. Question 6 Review Ask questions Get feedback Get perspectives Create the specification for implementation. Design 7 Visual design Functional design Technical design Experience design Build a flawlessly working application. Develop 8 Refine Polish Build Iterate Ensure the result is readable and usable. Evaluate 9 Usability testing Design evaluation Expert review Usage observation Finalize the project and celebrate. Deliver 10 Launch Promote Deploy Document
the project. Inform 1 Content Requirements Audience Goals Have the data ready for analysis and usage. Prepare 2 Gather the data Clean the data Format the data Mine the data Understand the texture of the data. Explore 3 Ask questions of the data Inspect the data Explore the data Analyze the data Understand the contents of the data. Discover 4 Indentify problems Answer questions Understand the data Indentify insights Trying out and testing ideas visually. Sketch 5 Sketch on paper Sketch in code Explore range of concepts Draft visualization ideas Verifiy the selected visualization method. Question 6 Review Ask questions Get feedback Get perspectives Create the specification for implementation. Design 7 Visual design Functional design Technical design Experience design Build a flawlessly working application. Develop 8 Refine Polish Build Iterate Ensure the result is readable and usable. Evaluate 9 Usability testing Design evaluation Expert review Usage observation Finalize the project and celebrate. Deliver 10 Launch Promote Deploy Document