Upgrade to Pro — share decks privately, control downloads, hide ads and more …

Designing User-Centered Visualizations

Designing User-Centered Visualizations

Approaching user-centered visualizations from three different human perspectives: anatomy and cognition, behavior, and emotion.

Benjamin Wiederkehr

January 31, 2013
Tweet

More Decks by Benjamin Wiederkehr

Other Decks in Design

Transcript

  1. presented by Interactive Things Visual Practices 3 Information Design Information

    Visualization Data Visualization Scientific Visualization Visual Analytics
  2. presented by Interactive Things Visual Practices 4 Information Design Information

    Visualization Data Visualization Scientific Visualization Visual Analytics
  3. presented by Interactive Things Visual Practices 6 Information Design Information

    Visualization Data Visualization Scientific Visualization Visual Analytics
  4. presented by Interactive Things Visual Practices 8 Information Design Information

    Visualization Data Visualization Scientific Visualization Visual Analytics
  5. presented by Interactive Things Visual Practices 10 Information Design Information

    Visualization Data Visualization Scientific Visualization Visual Analytics
  6. presented by Interactive Things Visual Practices 12 Information Design Information

    Visualization Data Visualization Scientific Visualization Visual Analytics
  7. L.B. Finer and S.K. Henshaw, "Estimates of U.S. abortion incidence

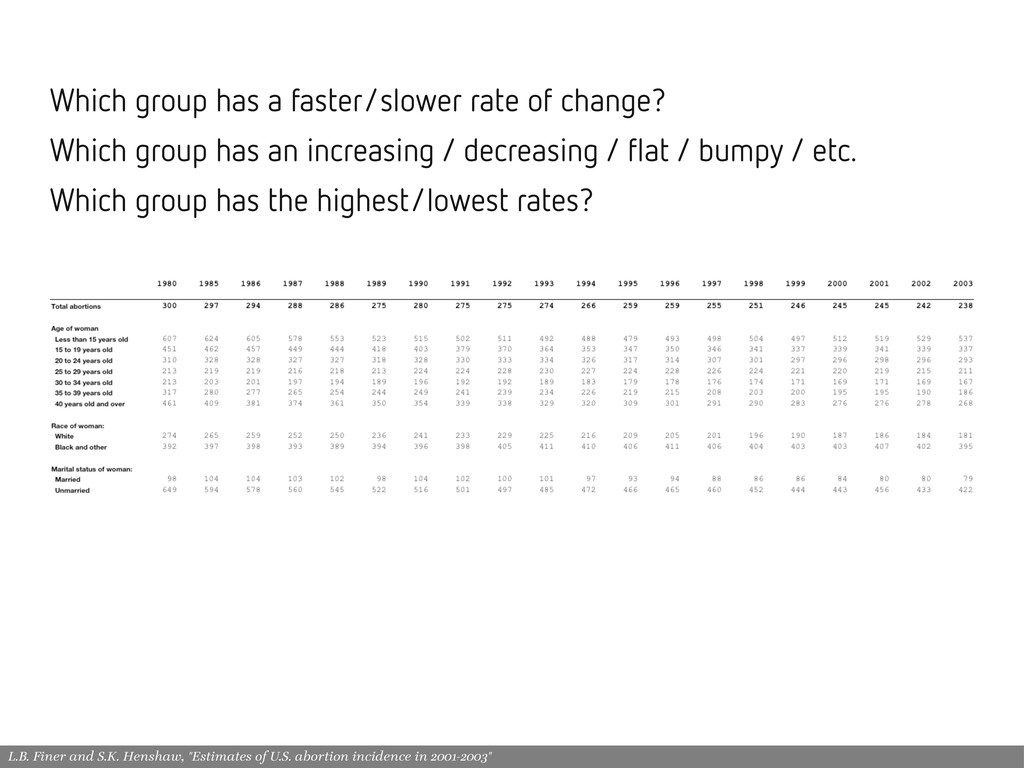
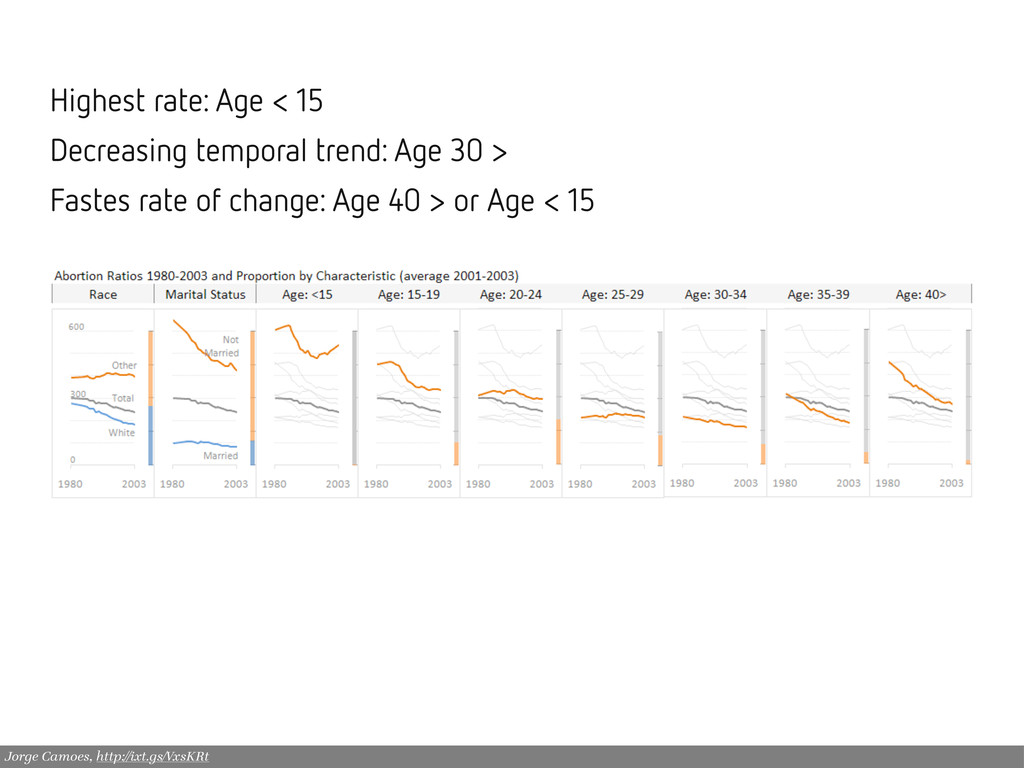
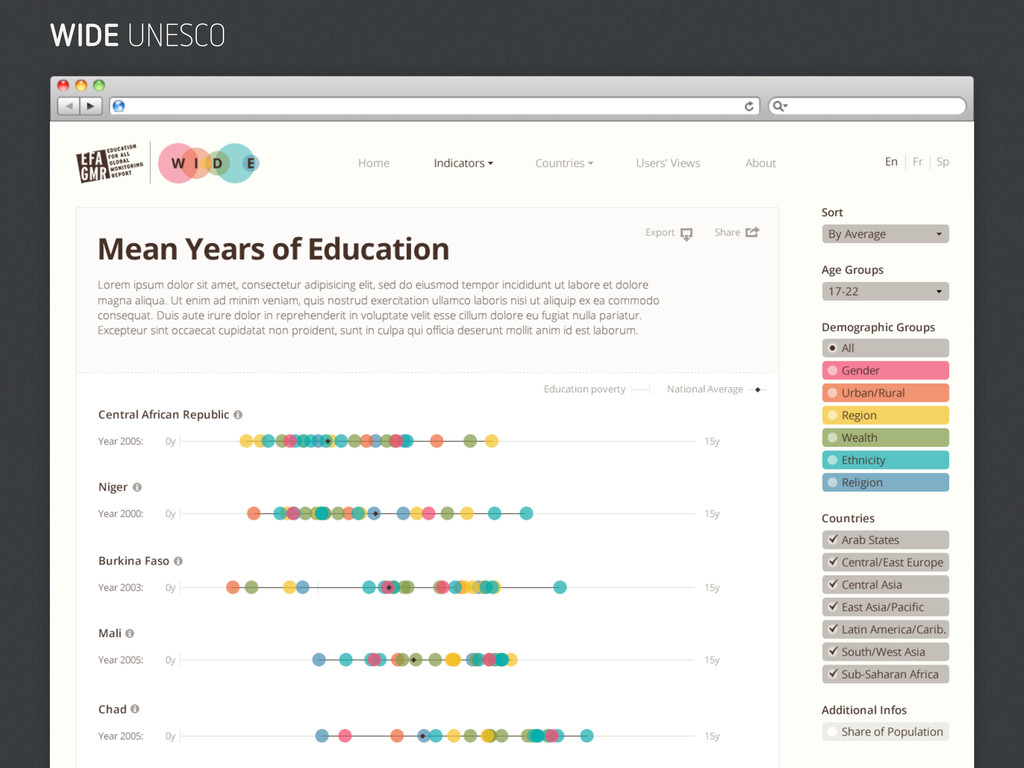
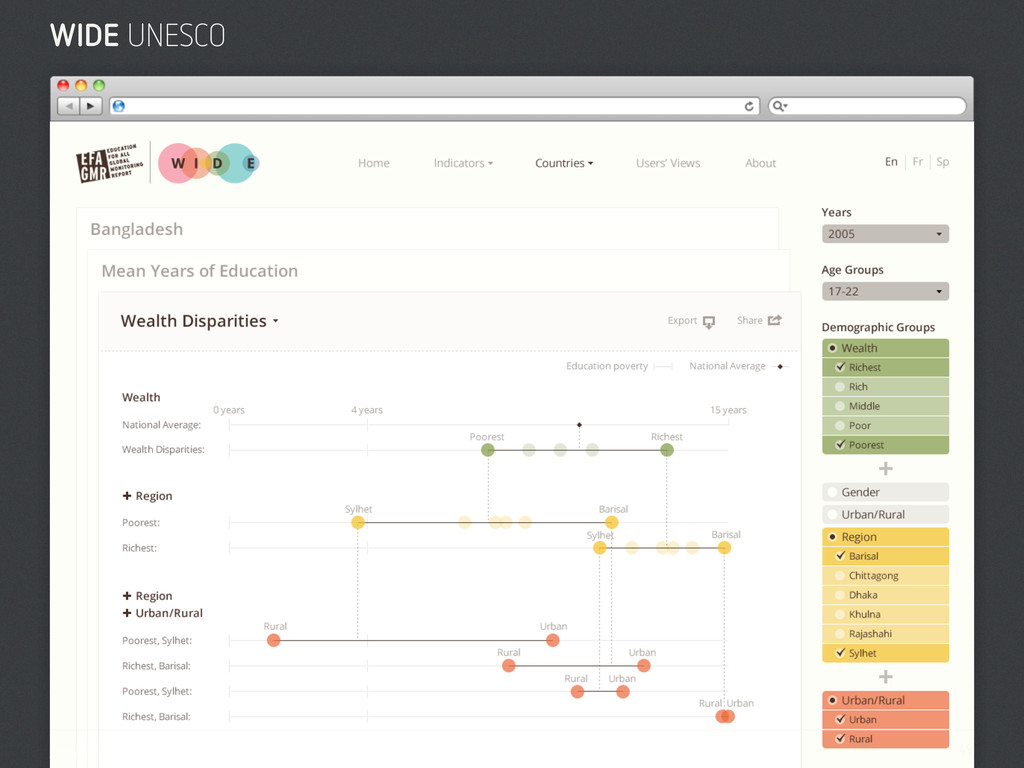
    in 2001-2003" Which group has the highest/lowest rates? Which group has an increasing / decreasing / flat / bumpy / etc. Which group has a faster/slower rate of change?
  8. Jorge Camoes, http://ixt.gs/VxsKRt Fastes rate of change: Age 40 >

    or Age < 15 Decreasing temporal trend: Age 30 > Highest rate: Age < 15
  9. presented by Interactive Things 22 Ordinal Nominal Temperature Velocity Duration

    Medals Ratings Satisfaction Categories Countries Names Data Types Quantitative
  10. presented by Interactive Things Best Practices 1. Remove the obvious,

    focus on the meaningful. 2. Data to ink ratio. 24
  11. presented by Interactive Things Best Practices 1. Remove the obvious,

    focus on the meaningful. 2. Data to ink ratio. 3. Data to action ratio. 30
  12. presented by Interactive Things Best Practices 1. Remove the obvious,

    focus on the meaningful. 2. Data to ink ratio. 3. Data to action ratio. 4. Avoid chart junk. 32
  13. presented by Interactive Things Best Practices 1. Remove the obvious,

    focus on the meaningful. 2. Data to ink ratio. 3. Data to action ratio. 4. Avoid chart junk. 5. Please, just don’t lie. 34
  14. presented by Interactive Things The idea for information design is:

    Don't get it original, get it right. 36 Edward Tufte “
  15. presented by Interactive Things Ben Fry Computational Information Design 40

    acquire parse filter mine represent refine interact COMPUTER SCIENCE STATISTICS INFORMATION & INTERACTION DESIGN
  16. presented by Interactive Things Ville Vivante City of Geneva 46

    Conception Research Design Implementation
  17. presented by Interactive Things 52 design questions testing user visual

    ask story find sketches create develop make question get identify research ideas iterate define different explore set wireframe side iteration start refine interesting finding use technical sketch requirements structure goals look sketching form gathering board interface adjustments server foundations client technology level public traditional new facts clean organize draft prototype early figure visualizations evaluate standard changes later points ways key build review insights interaction translate processing tableau patterns away exploration visually support narrative process hierarchy project representation refinement know feel hand one graphics combination tweak analysis strategic idea concepting white ideation experience scenarios drawings assessments flow diagrams lot font color studies mechanics tests layered compositions interactivity motion copywriting audio communication perform alpha quality assurance performance beta usability surveys promotion relation campaigns ambassador outreach relations methods social media channels curious discover passionate investigate inspect retrieve models execute solutions improve deliver present final document describe main findings insight rapid exploratory minimalist instantiations quickly cycle big smaller feedback fresh perspectives evaluation talk audience deployment environment involve stakeholder play analyze learn view draw possible visualizing answers evolve frames functionality method meet expected useful offer tell craft deploy launch celebrate enjoy remind love parse normalize properties latent structures massage tendency encode known methodologies visualize r relationships something break tools represent experiment algorithms apply inspiration areas colors fonts alignment interviewing views asking thumbnail test composition answering gather additional sources reading everything spot holes unique intent clarifying complex explaining highlighting trend supporting argument great identifying problems reality check collaborative reworking discovering accurate narratives creating solidify hierarchical mood building understandable important information choosing format determining approach phase releasing world personally attached vague ready attempts problem worth publishing counting words sorting themes illustrator high contents raw preliminary grip explorations tools, excel produce many highlight individual parts sense texture throw tweaking comes understand getting touch progress custom made functional prototypes mostly adobe flash playing java html 5 techniques, frameworks d3 raphaël puzzle solving arrange imagining certain things several versions dialogue come quick conclusion conversation leads options sophistication cleaning, reformatting, fixing, calculating visible prototyping answer stories basic approaches care details definition acquisition sets, mining hotspots focuses data, interactions looking prior examples paper code mockups range concepts development delivery archive engagement iterations
  18. presented by Interactive Things 54 Inform Content Requirements Audience Goals

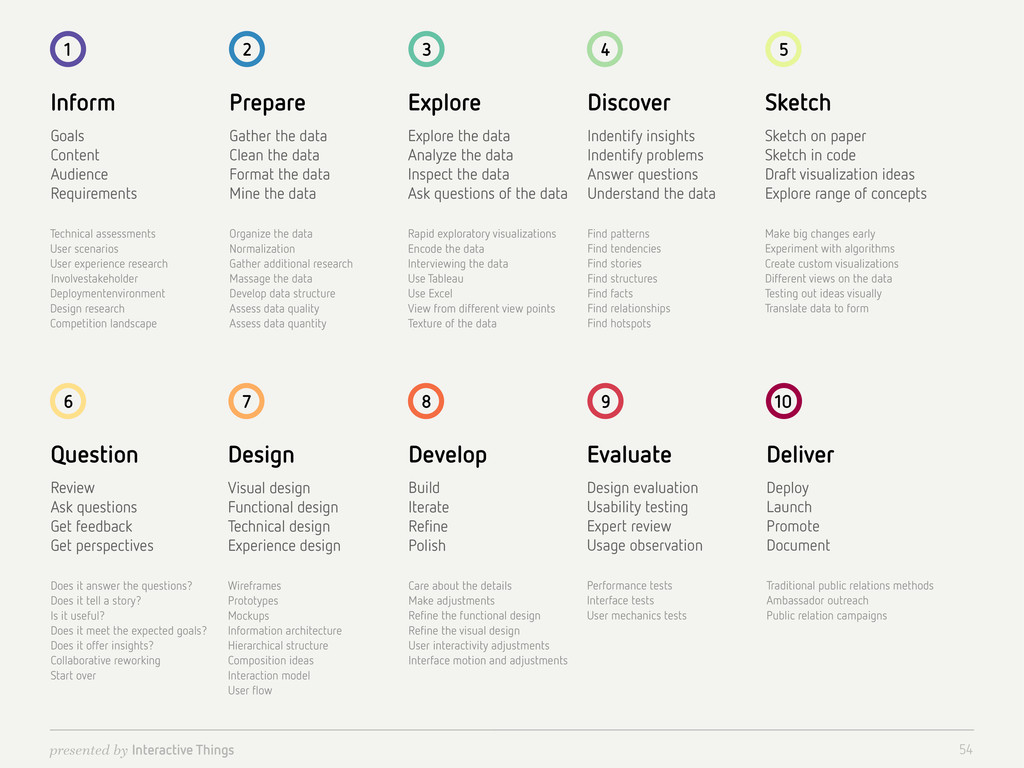
    Technical assessments Design research Deploymentenvironment Involvestakeholder Competition landscape User experience research User scenarios 1 Prepare Gather the data Clean the data Format the data Mine the data Organize the data Normalization Massage the data Gather additional research Develop data structure Assess data quality Assess data quantity 2 Explore Ask questions of the data Inspect the data Explore the data Analyze the data Rapid exploratory visualizations View from different view points Encode the data Use Tableau Use Excel Interviewing the data Texture of the data 3 Discover Find tendencies Find stories Find relationships Find hotspots Find structures Find facts Find patterns Indentify problems Answer questions Understand the data Indentify insights 4 Sketch Sketch on paper Sketch in code Explore range of concepts Draft visualization ideas Make big changes early Translate data to form Experiment with algorithms Different views on the data Testing out ideas visually Create custom visualizations 5 Question Review Ask questions Get feedback Get perspectives Does it answer the questions? Does it meet the expected goals? Is it useful? Does it tell a story? Collaborative reworking Start over Does it offer insights? 6 Design Visual design Functional design Technical design Experience design Wireframes Prototypes Composition ideas Interaction model User flow Information architecture Hierarchical structure Mockups 7 Develop Refine Polish Build Iterate User interactivity adjustments Interface motion and adjustments Make adjustments Refine the functional design Refine the visual design Care about the details 8 Evaluate Usability testing Design evaluation Expert review Usage observation Interface tests User mechanics tests Performance tests 9 Deliver Launch Promote Deploy Document Public relation campaigns Ambassador outreach Traditional public relations methods 10
  19. presented by Interactive Things Stories are important cognitive events, for

    they encapsulate, into one compact package, information, knowledge, context, & emotion. 59 Donald Norman “