It's taken me a while but I have finally embraced Little's Law as a means of project forecasting.
These slides are from the Lightning Talk I gave at Lean Kanban United Kingdom 2014. They show the steps we went through at We Are Friday to plan a new project with a new team for a new client.
They bring together two powerful tools:
David Anderson's Kanban Method for forecasting projects - http://www.djaa.com/project-management-kanban-part-3-forecasting
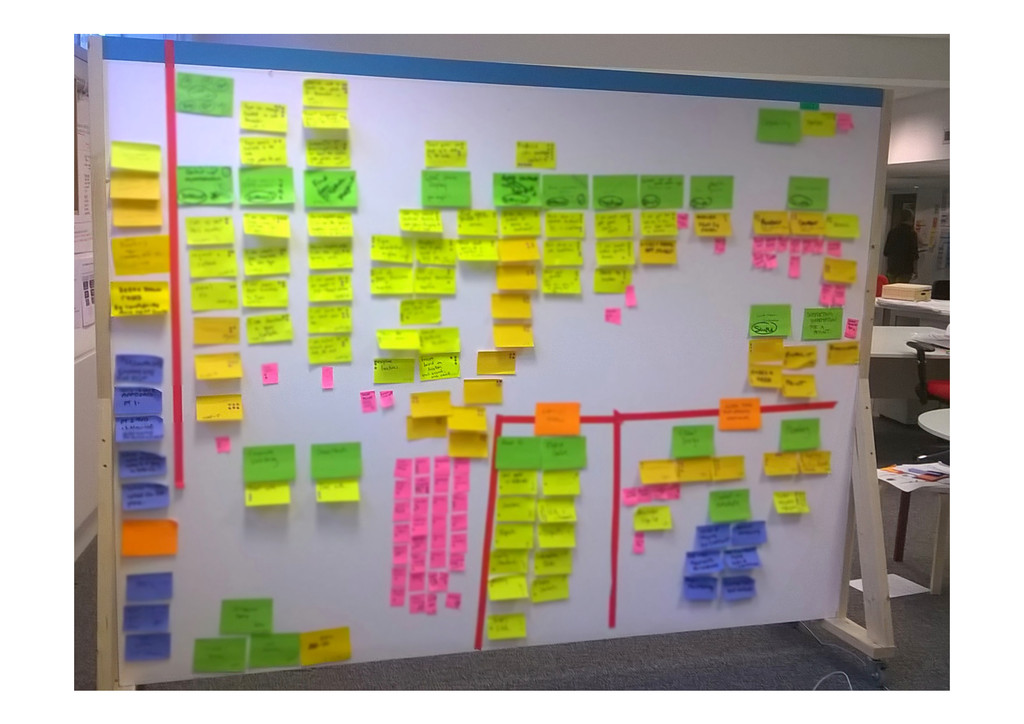
Jeff Patton's Story Mapping - http://www.agileproductdesign.com/blog/the_new_backlog.html
Our work at Friday is about the capabilities of our clients, either working with them to improve existing ones or creating new ones.
We package our work on these capabilities into projects. This gives us the initial scope of the project.
We don’t estimate time for individual disciplines for each feature. This is because we don’t know enough at this stage to make an accurate estimation.
Instead we size the relative complexity of each story on a point scale of 1,2,3,5 and 10.
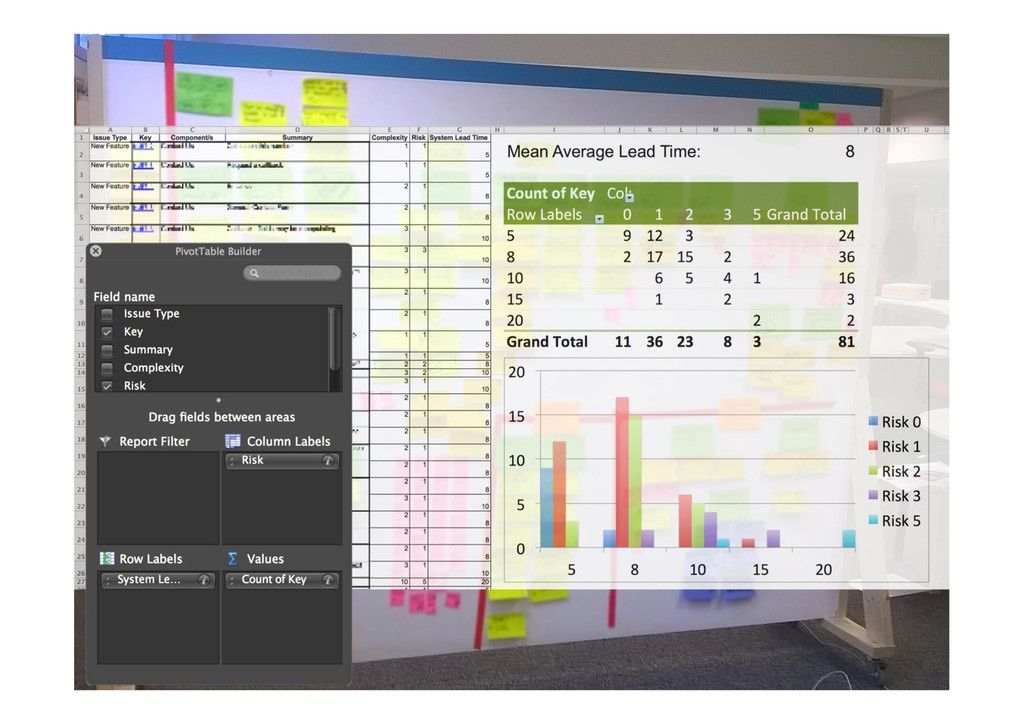
We use a simple heuristic to map these to lead time.
We score the relative risk of each feature on the same scale. Risk as defined by Douglas Hubbard is:
“A state of uncertainty where some of the possibilities involve an undesirable outcome”
We then look at the distribution of lead time and risk to see whether we have the single modal data we need for our forecast. In this case the stories were clustered around the eight day mark.
If the quality of our input data were higher then it might be worth making the model more complicated and modelling these risk level three and five stories separately.
In the interests of simplicity we kept to a single model. We also looked at how we might be able to break these high complexity / high risk stories into smaller, lower risk stories.
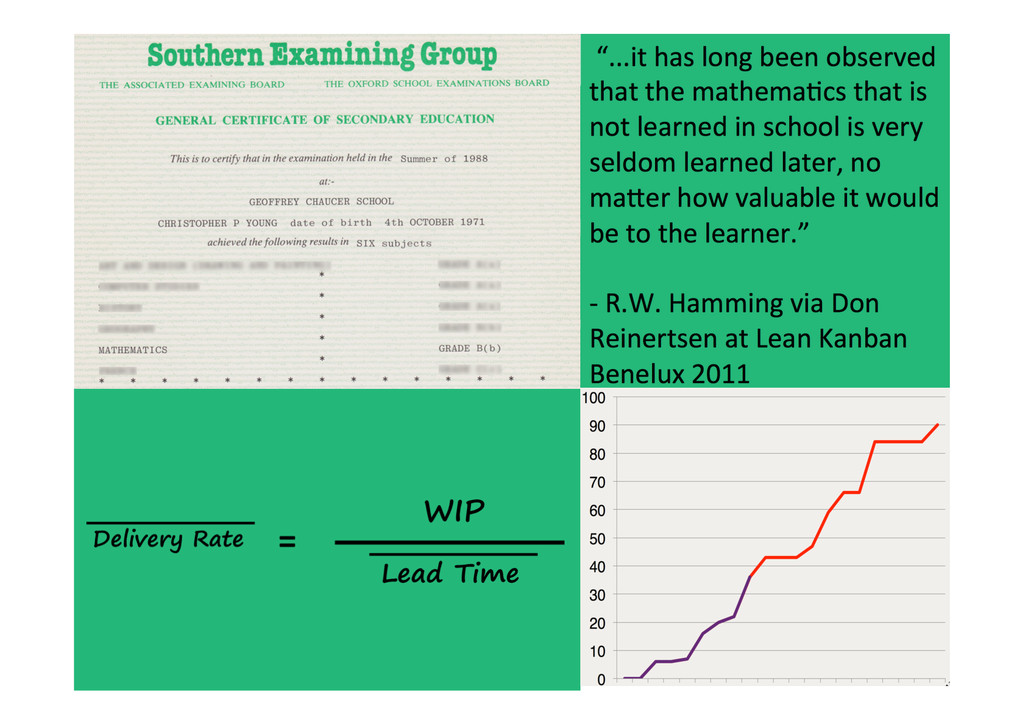
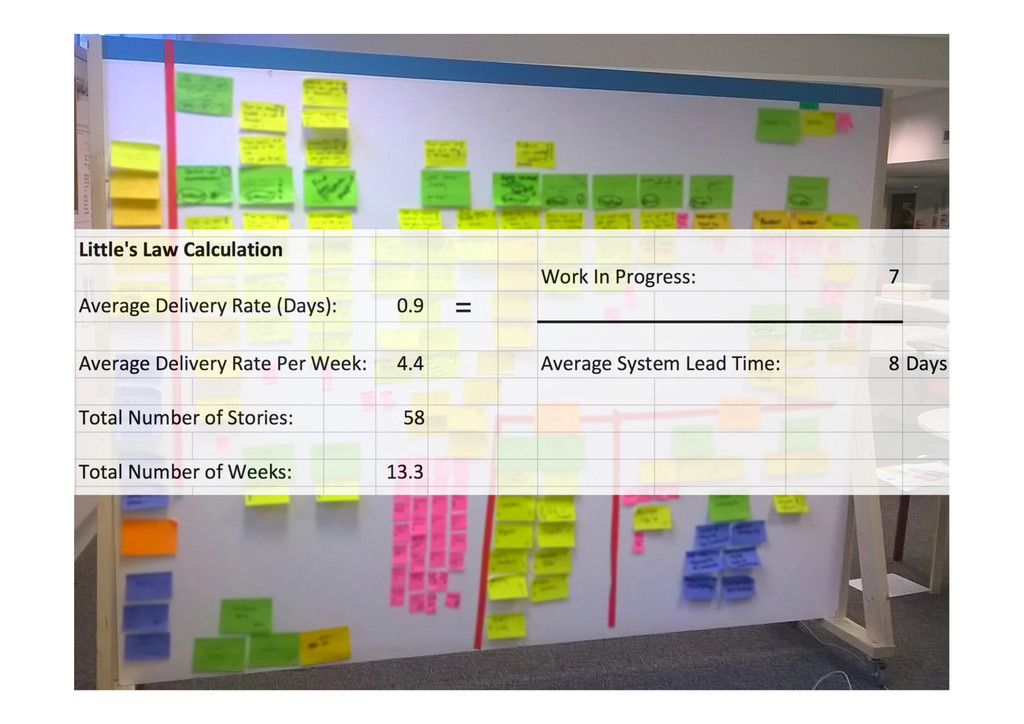
Having done all this we take the Average of the system lead time, at which point we are ready to bring in Little’s Law.
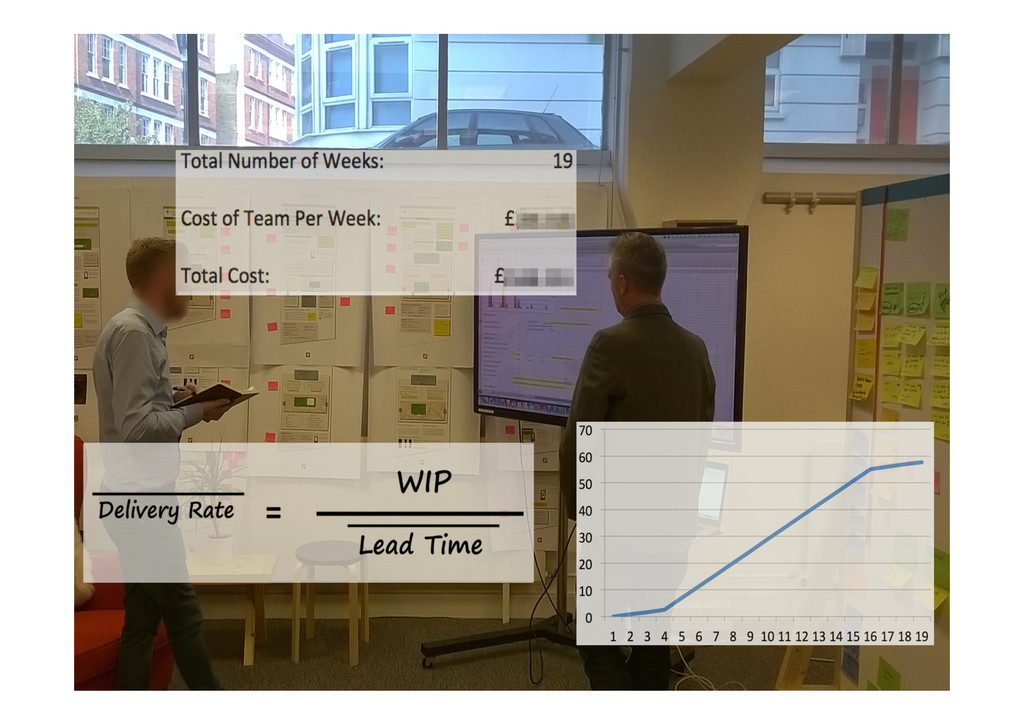
Little’s Law states that the average delivery rate is equal to the work in progress divided by the average system lead time.
So if we have seven stories in flight at once we should be done in just over 13 weeks.
But how do we know what our WIP is going to be?
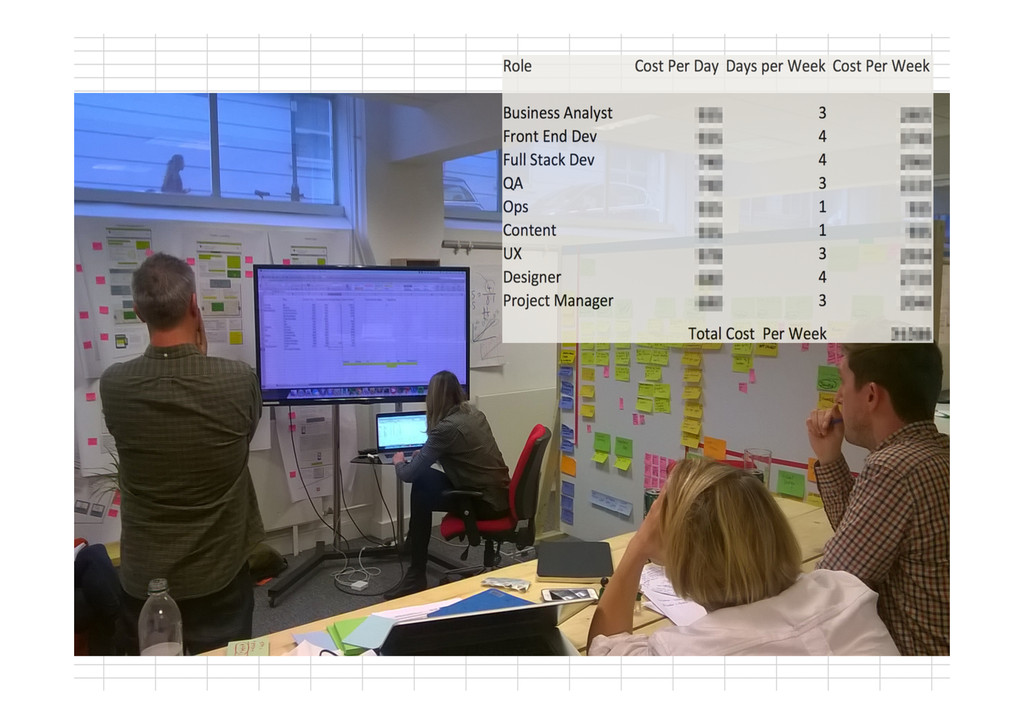
We need to know what shape and size team we’re going to have.
This for me was the real power of Little’s Law. It was enabling a discussion about WIP with everyone in the value chain at the beginning of the project.
WIP wasn’t just some abstract concept that engineering were talking about.
We were able to talk about where bottlenecks might be, how much WIP our level of client engagement would be able to support. We were talking systemically.
One more thing...
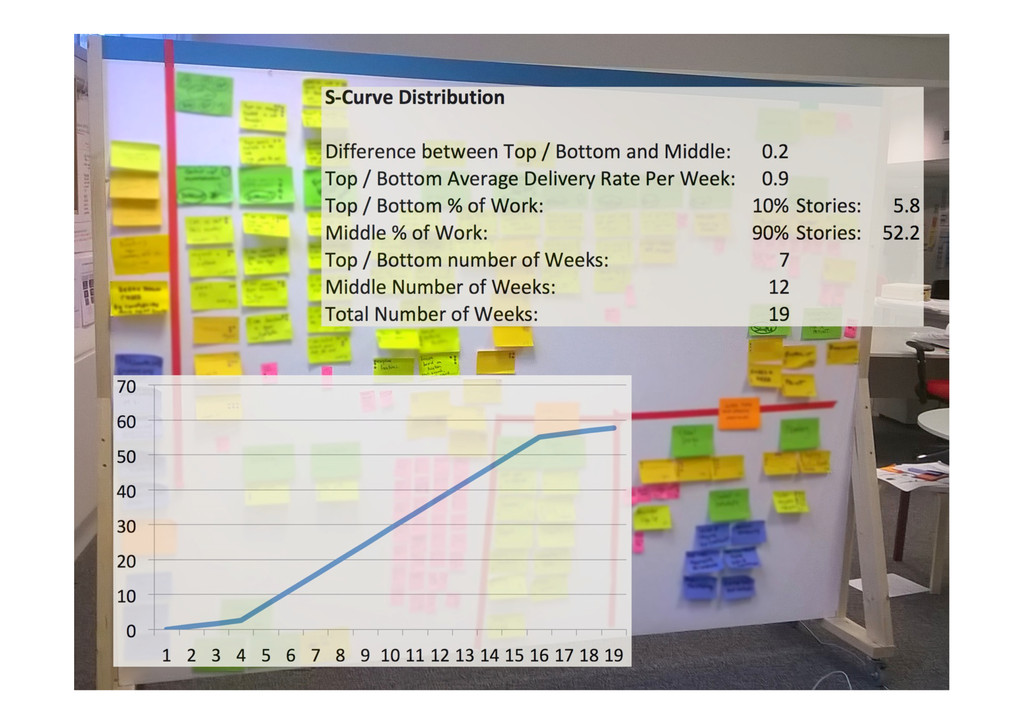
The average Delivery Rate will not be the same across the whole of the project.
We know from experience and historic data that teams do not start or end at the same speed at which they deliver once they’ve got going.
Using the S-Curve distribution to determine how long you will need this team for.
So now we do know how long we need the team for, and how much they cost and we can present this to the customer.
But this is really the end of the beginning. We have forecast based on what we know, we need to keep in mind what we don't know, the 'dark matter' which will emerge as we learn more over the course of the project.
What we do know is that by limiting our WIP and maintaining a consistent flow of work through the system we have a predictable, measurable way of delivering the work.