The title of this talk was originally “Kanban meets Design Thinking” but as we worked on it and presented it to our colleagues it became known as “Making the Best Thing” It’s about using Kanban and Design Thinking to do just that.
It was presented at the British Computer Society London Lean Kanban Day 2015.
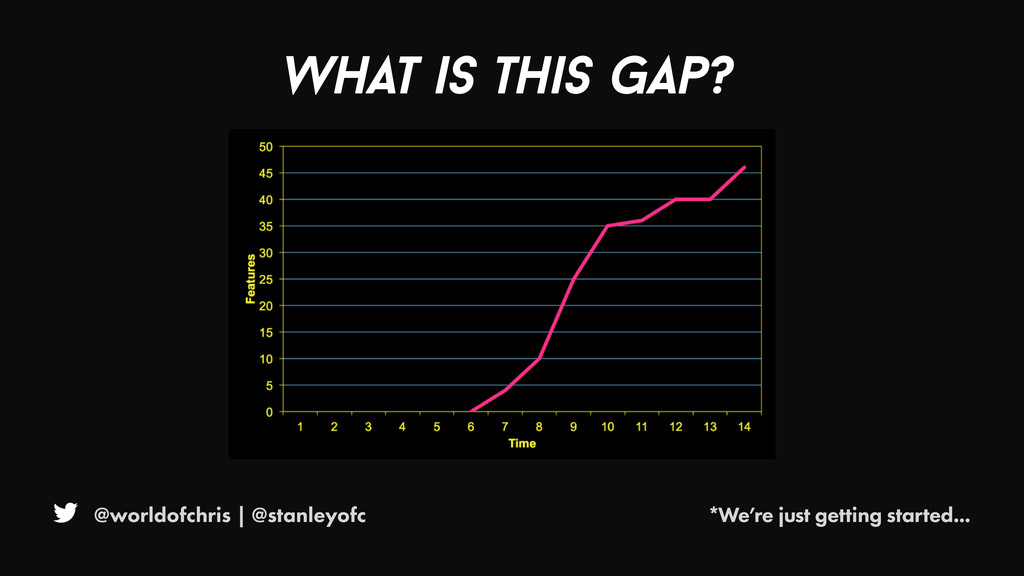
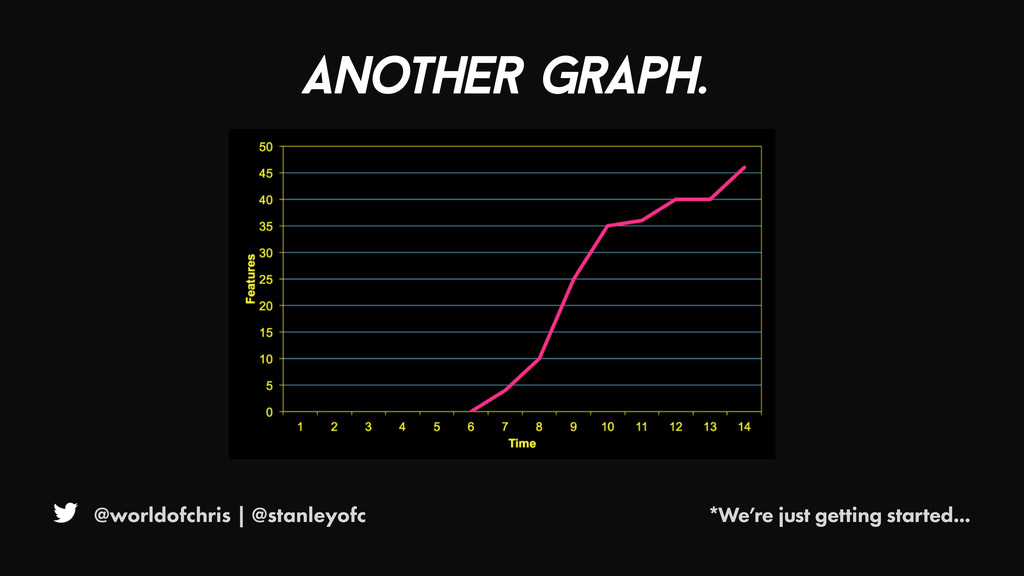
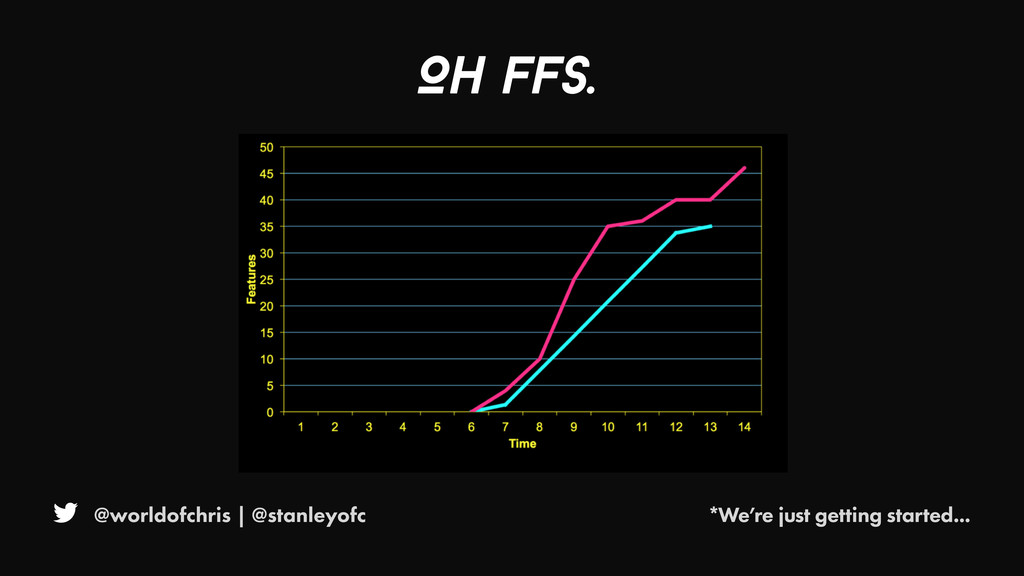
We start with a question; What is the gap on this cumulative throughput graph? Or putting it another way, why do we only start to see output from week six? We’ll go on to answer this below.
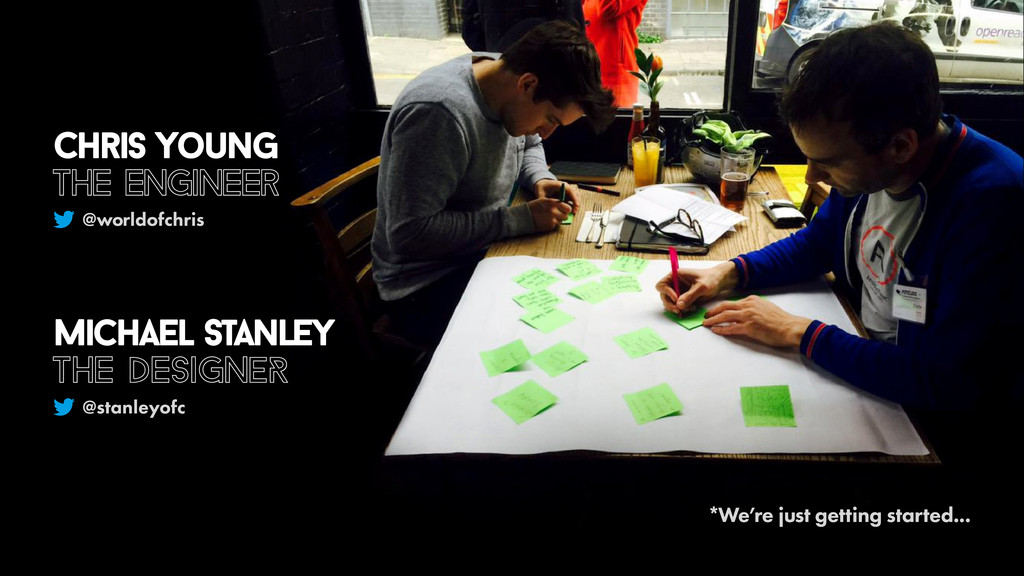
The two protagonists in this story are Chris Young and Michael Stanley - co-author's of this deck.
Chris is an engineer who’s been leading software development teams for the last fifteen years, working with the likes of the BBC, ITV, Deutsche Telekom, YouView and for the past year, Digital Agency Friday.
Michael, the designer, works with Chris at Friday. Originally training as an industrial product designer he’s been making interactive digital products for 5 years for the likes of Vodafone, HSBC, Nuffield Heath and Williams F1.
Friday, or ‘We Are Friday’ as they are also known, is a full service digital agency whose clients include HSBC, EDF and Nuffield Health.
Friday provide Digital strategy consultancy; product and service design and enterprise-grade engineering. Friday’s clients ask them to work on service-delivery challenges—the ones that make or break their high-touch customer relationships.
They have sky-high ambitions. They are in sectors highly disrupted by digital. They ask Friday to understand their organisation, their customers, and to guide them in the opportunities that digital presents.
It was at Friday where the data shown on the Cumulative Throughput Graph comes from.
To answer the question we posed above, “What is the gap?”, we need to tell the story of a journey. It’s a journey that we went on, starting from the different perspectives of an engineer and a designer. By working together and understanding each other’s point of view we resolved the tensions and differences we started with and found not only a better way of working together but a way of working that meant we created a better outcome.
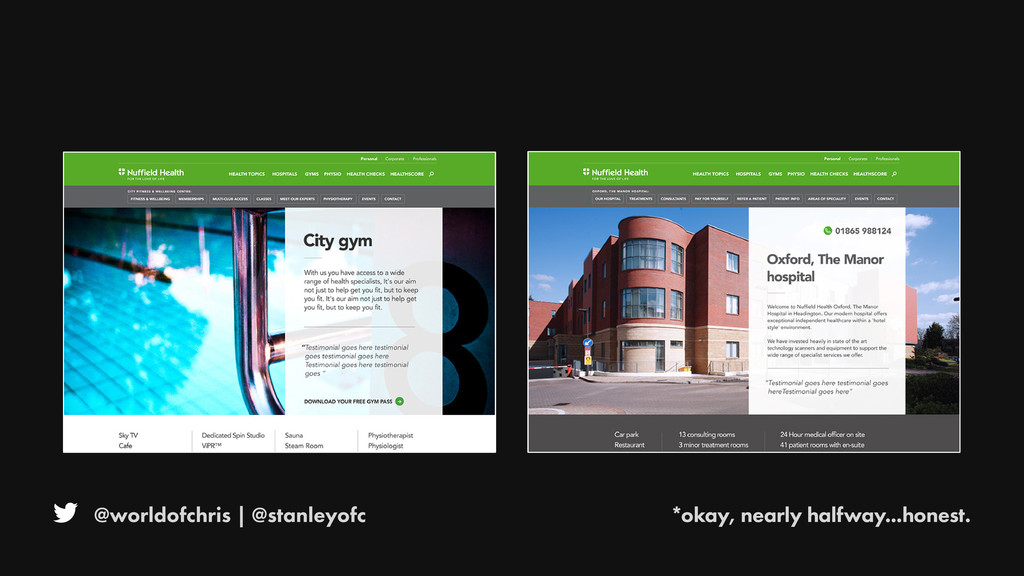
The journey took place against the background of delivering a website re-design project for Nuffield Health. The goal was to deliver a rebranded website and a new Free Gym Pass system for them to a fixed delivery date.
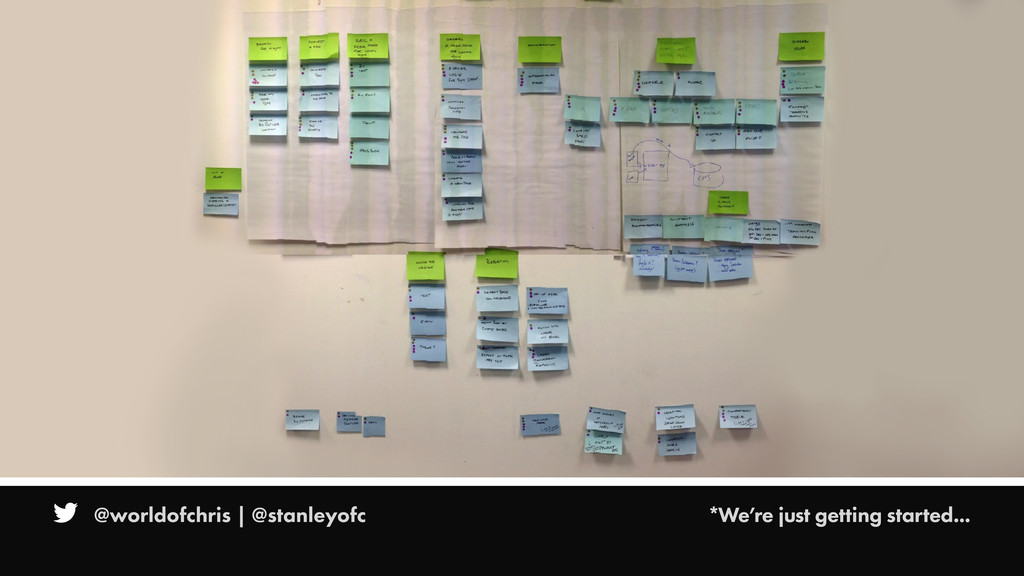
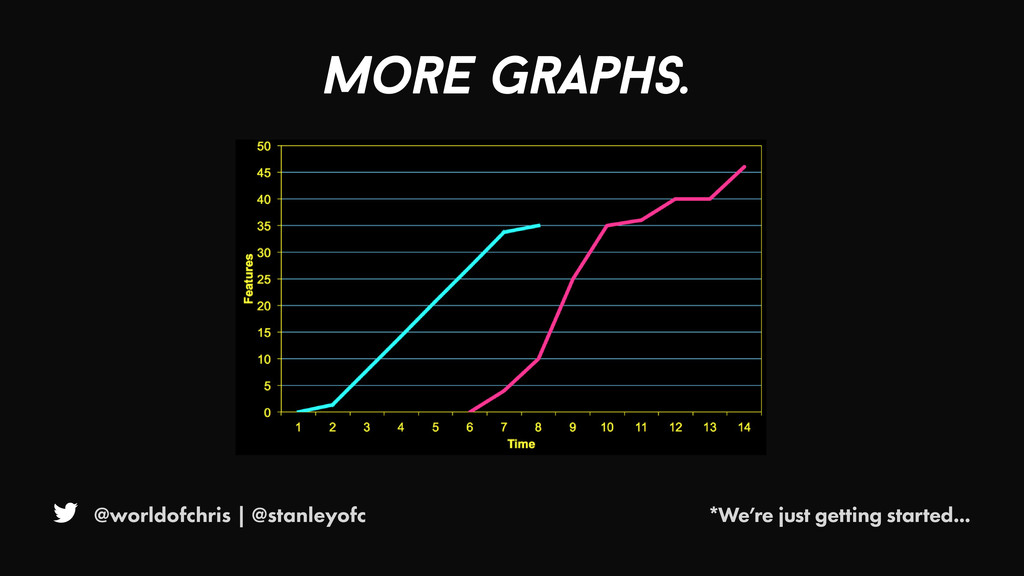
We started by working with the customer to identify the scope of the project using a Story Map. From this we produced a forecast of how long this would take to deliver by using Little’s Law and an ’S-Curve’ distribution of throughput.
When we looked at the actual throughput we saw two things. First that output did not start until six weeks into the project, and second that the actuals and the forecast were not all that far off.
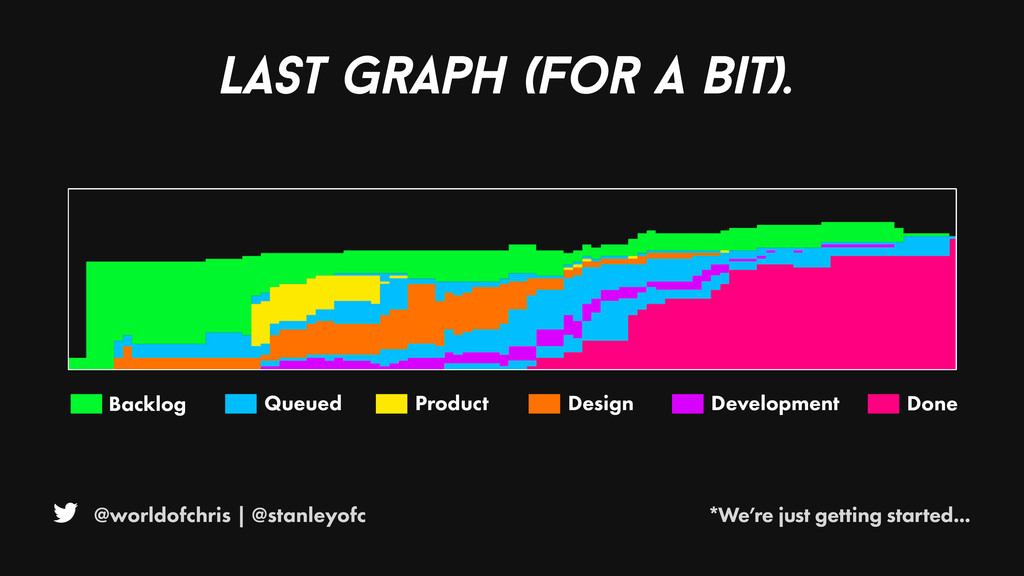
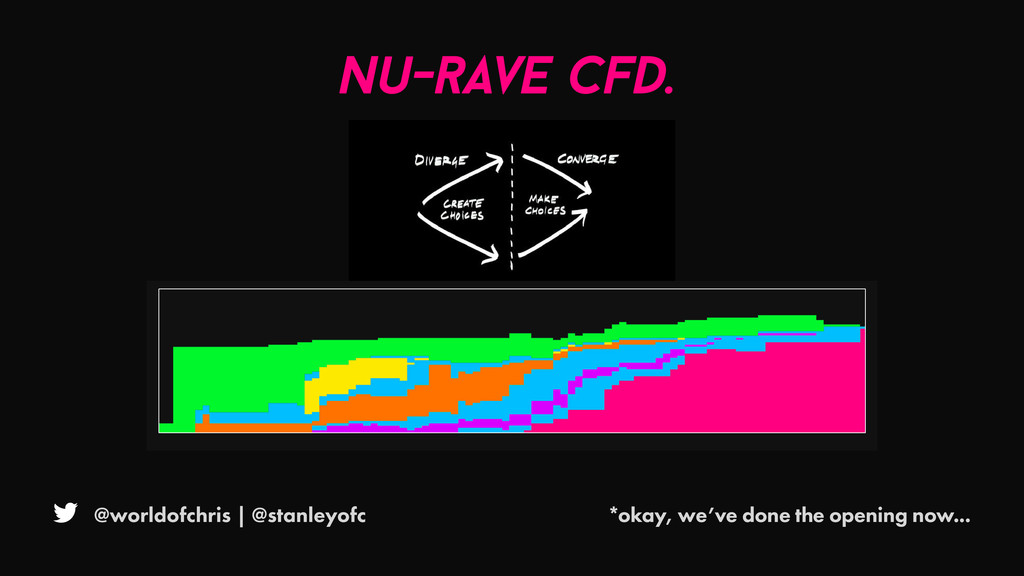
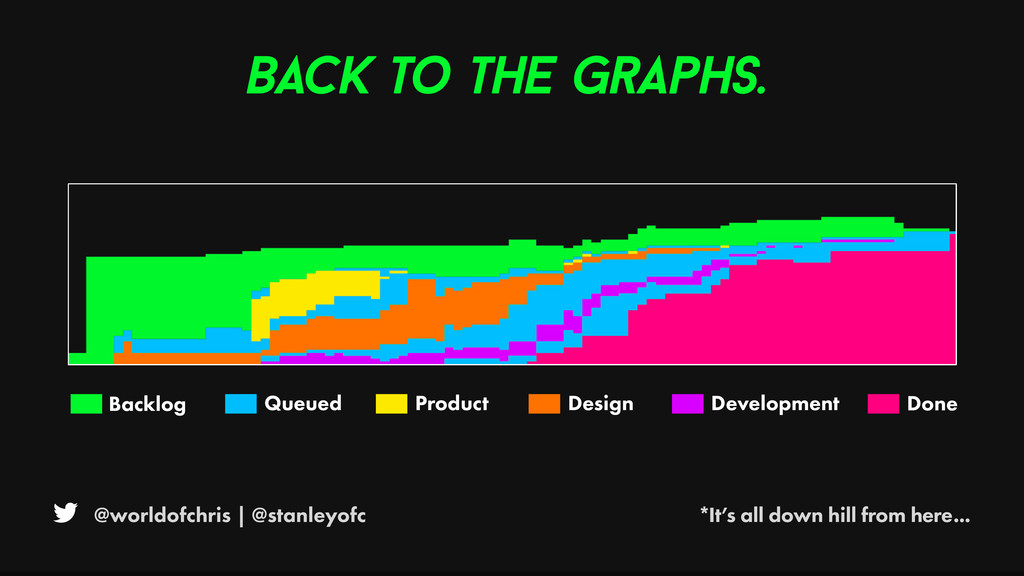
To find out why output started later than forecast you need to look at the Cumulative Flow Diagram.
What this shows is a lot of work, and a lot of WIP, with the Product and Design teams working on things that were not producing output but were affecting outcome.
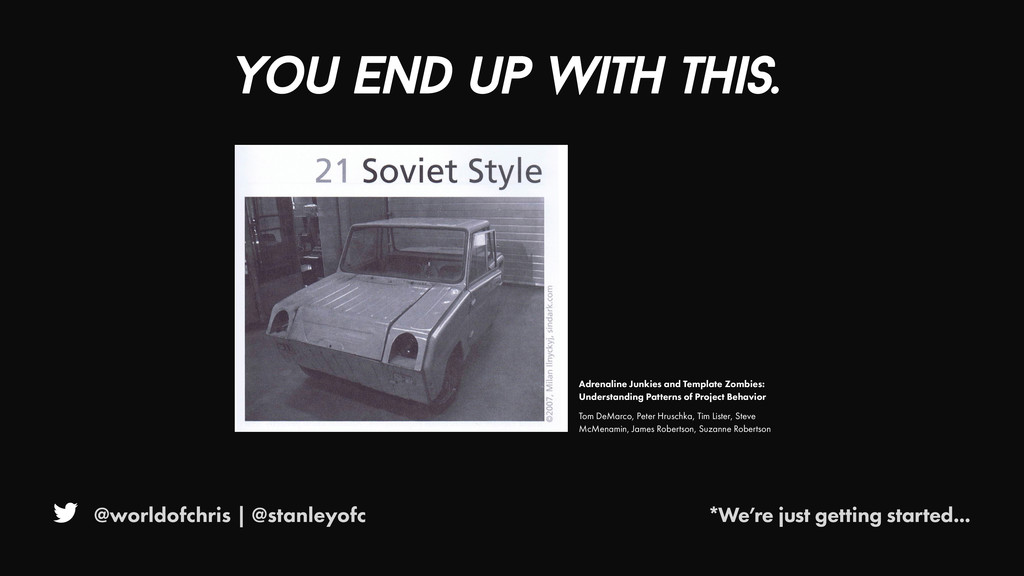
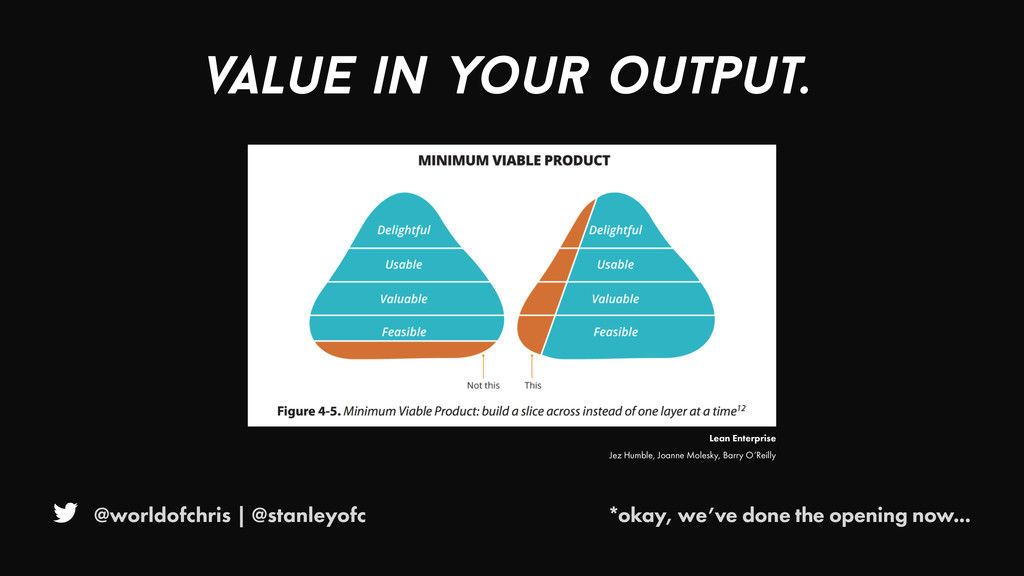
If all you are interested in is output then you end up with DeMarco et al’s ‘Soviet Style’ Anti Pattern, where what is produced is what was asked for but is unloved, unused and soon discarded.
And this is sh1t. This is what happens when you go through feature driven development with no value lens.
You have to prioritise features based on the experience.
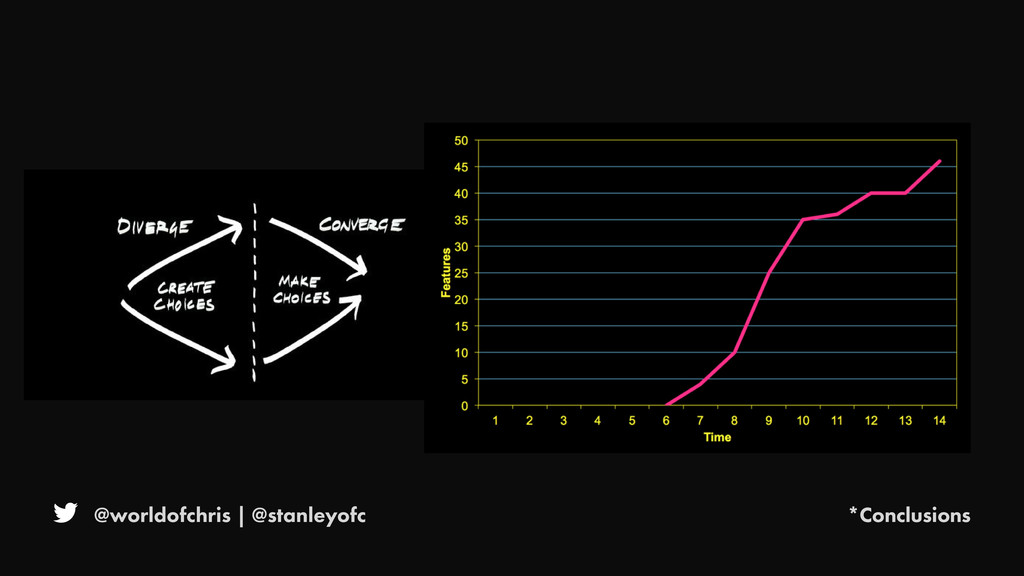
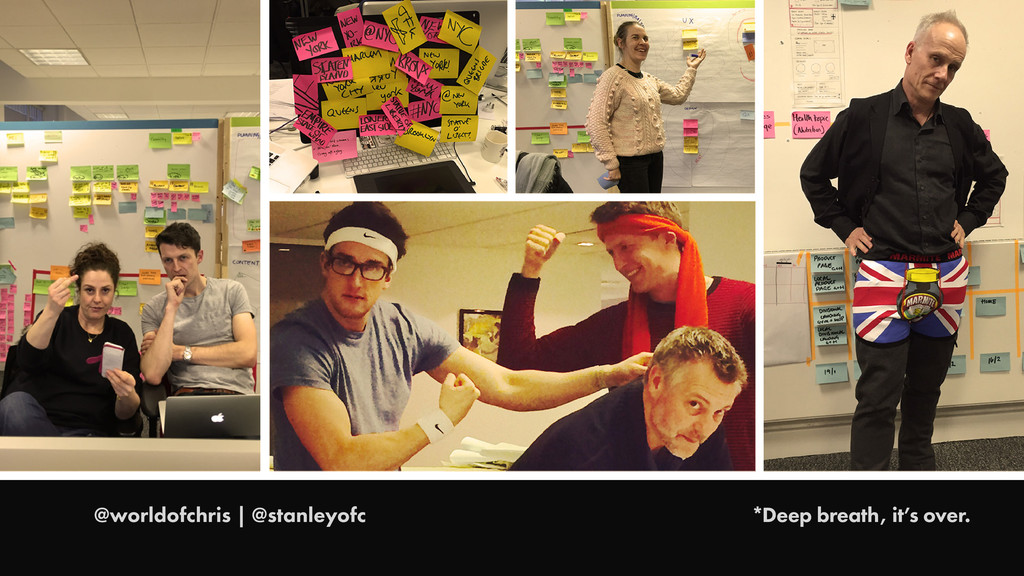
When designing experiences you begin to unpack the problem or issue you are trying to solve. In this divergent stage you find out one problem is actually forty seven problems plus eleven more and some that you can’t even affect. You’re trying to establish the edges of these problems to ensure whatever solutions or ideas you come up with solve the problem in a cohesive and coherent manor.
And this terrifies Chis, the engineer, because it means Michael, the designer, want’s to see everything. He wants everything in WIP. Having everything in WIP forever is the designer’s dream. Michael would love to sit and ideate forever but at some point you have to converge and start making choices.
So what you’re probably looking for is enough problems to get started, enough problems to start making choices and enter the convergent stage of the process.
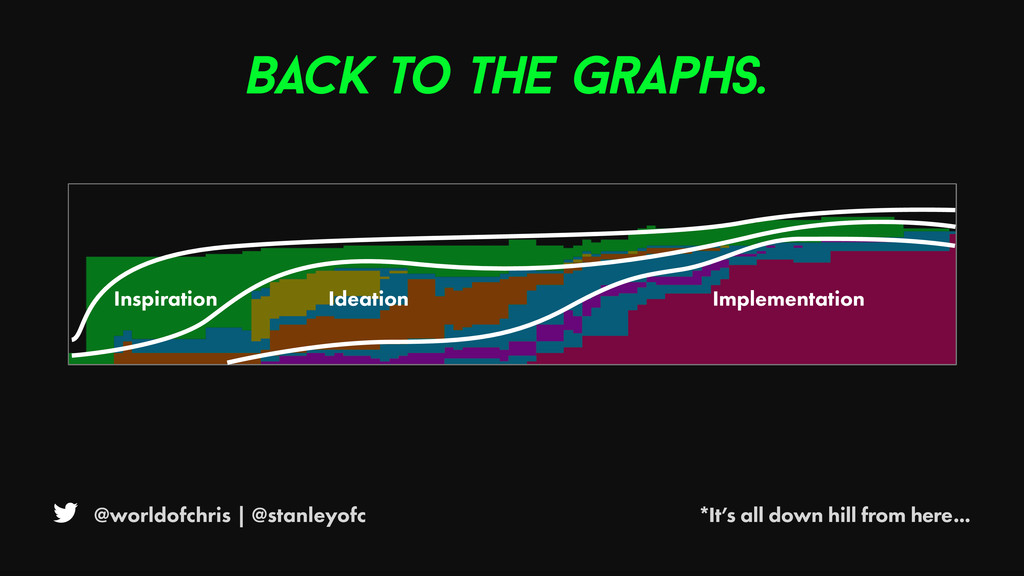
We’re not talking about Waterfall. This is not designing a load of stuff upfront and then throwing it over to Engineering to implement. Rather it is what Design Thinking describes as “overlapping spaces” We can see the three overlapping spaces of Inspiration, Ideation and Implementation in the Cumulative Flow Diagram.
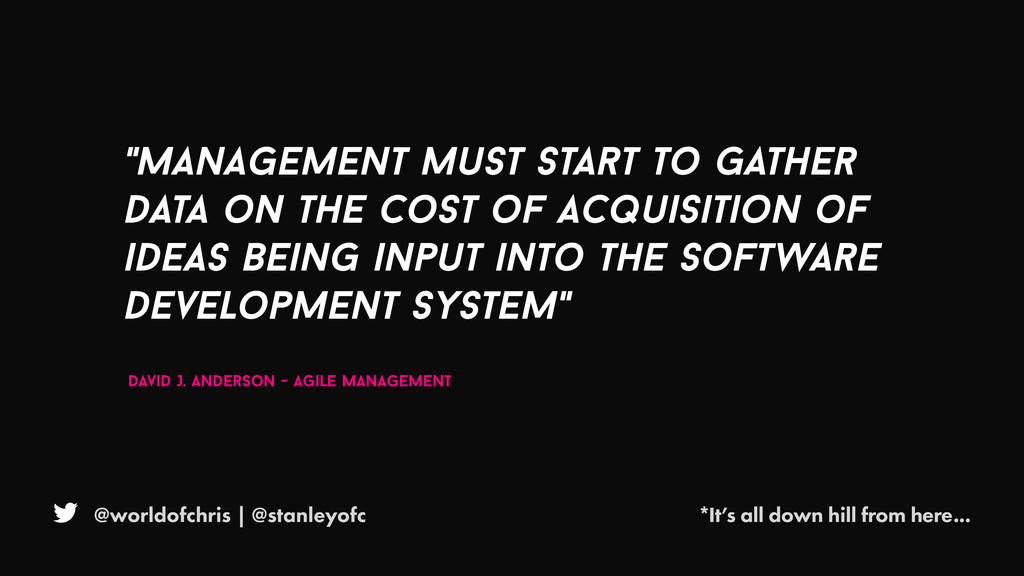
Whilst we had done a pretty good job of forecasting Implementation we had not done so for Ideation. The need to gather data on the cost of this acquisition of ideas was called out by David Anderson in his book “Agile Management”.
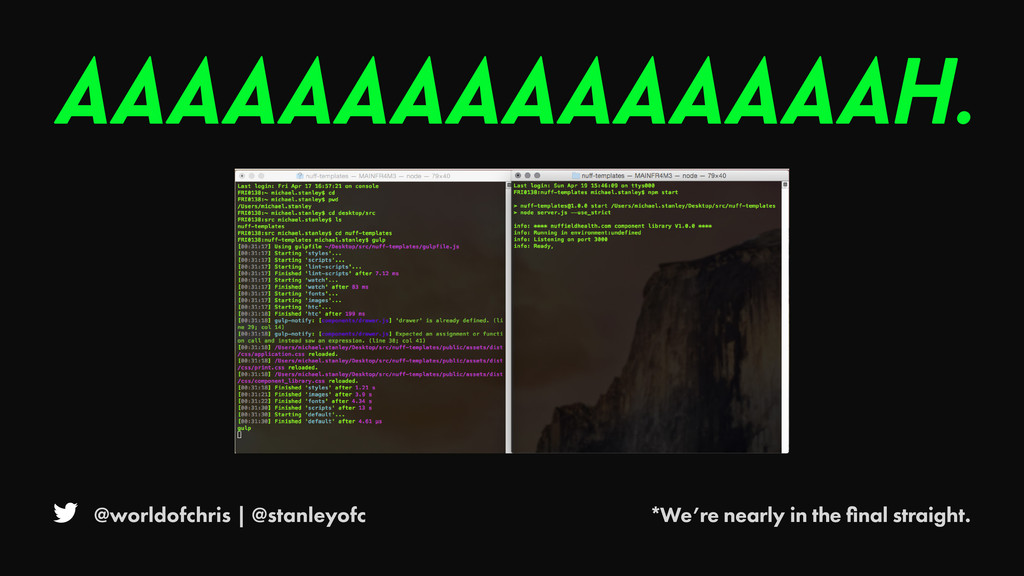
To enable overlapping spaces you need to create mechanism to facilitate this. A great example is The Living Style guide. The Living Style guide is the front end build in a componentised library, brought together in a simple node.js app.
It shows designers responsive components that they’ve designed and allows for in browser collaboration between engineering and design.
Now this means designers need to get to grips with some of the tools of engineering, namely git. As a designer git is difficult, but it’s necessary for designers like Michael to be able to affect the code base. Designers shouldn’t be designing pictures of software. They should design the code base itself.
Michael says he looks forward to the day when design request is in a pull request.
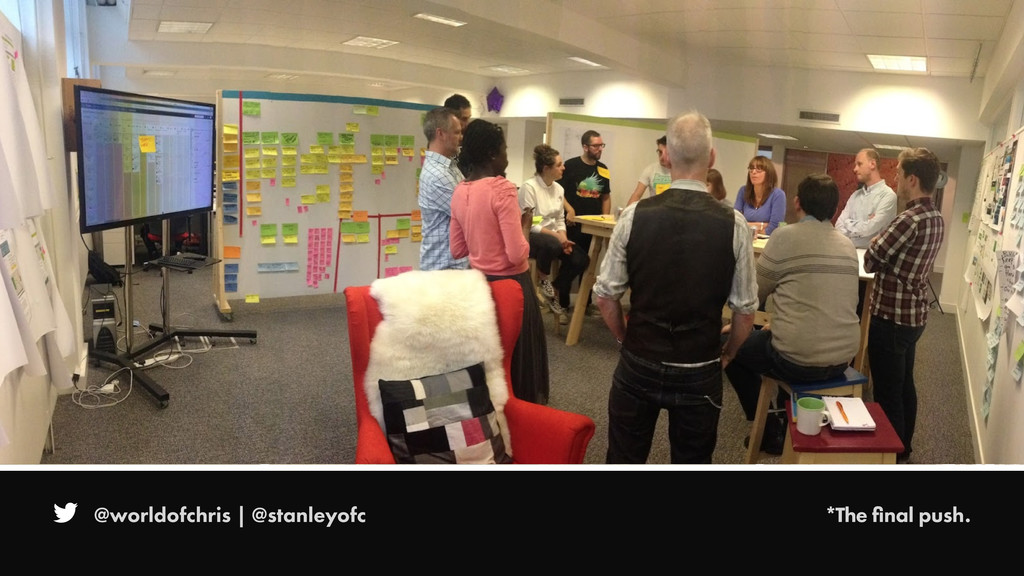
The Living Style Guide is one way that we enabled the overlapping of Ideation and Implementation, Discovery and Delivery. Another was the way we organised our stand ups. To begin with these were the familiar Scrum ‘three questions’ style. Chris found these challenging as it gave him little visibility of the state of the work. He ‘engineered’ a move to a ‘walk the board’ stand up using an electronic board.
After the successful delivery of the project it became clear that whilst Chris was getting value from these others were not
“Those stand ups where sh1t” said Michael. They’re often lifeless, uninspiring. A standup should set the pace and rhythm for the day. It needs to be human.
Michael asked Chris “What is it that engineering need to get out of the stand ups?, Lets change it so it works for both of us”
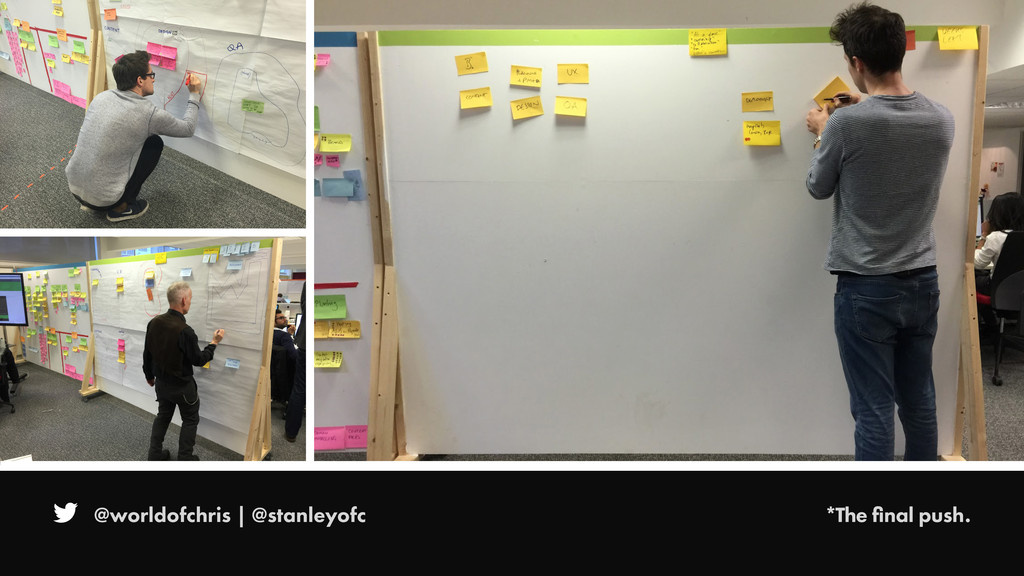
The result of this was for the next project that the team went on to do, also for the same client, we took a different approach. We still walked the board but the board itself was designed by the team, was physical and themed around parts of the body, our client being a health care provider.
So we had the ‘Heart of Design’, the Ear of ‘Engine-ear-ing’, the client brain and so on. Each station on the board had a space for work that was queued and one for work that was in progress. Colour coding distinguished different types of work; value, operational overhead and defects.
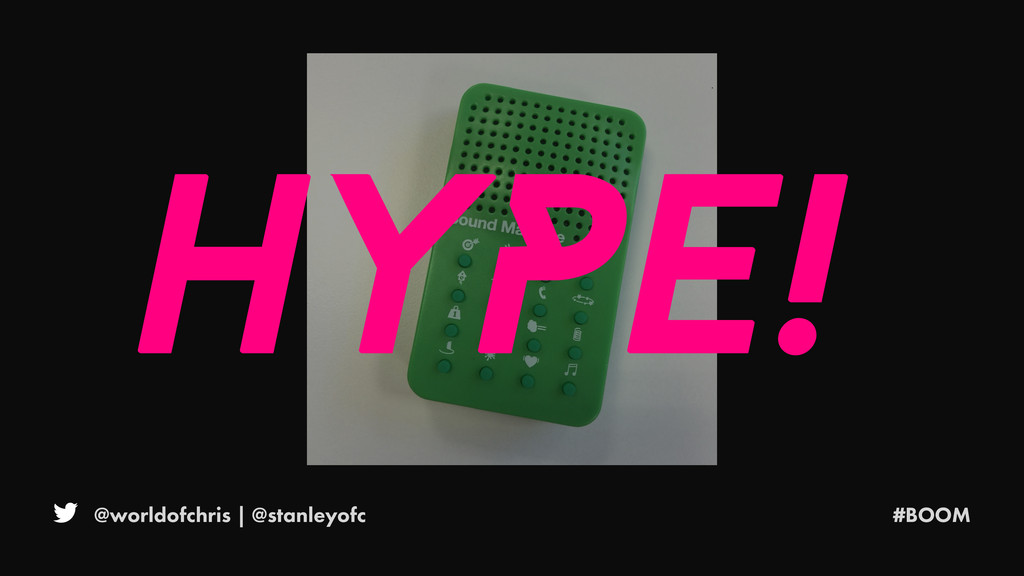
HYPE. Know that during a project teams will have bad days. Things will go wrong and that’s okay. Adding levity and humour to a team builds momentum and helps them move through this. Understanding the power of in jokes and the momentum it brings to a team will mean you have more good days than bad.
It’s better to light a candle than curse the darkness as someone once said.
Over the course of these two projects, Chris learned from Michael and Michael learned from Chris. For Chris the big learning was to embrace Michael’s optimism as something that needed to be at the heart of the work, not an optional extra as he had hitherto seen it.
Without that optimism, as Tim Brown has observed, “the will to experiment will be continually frustrated until it withers”. Without experimentation there is no divergence, no exploration of options and no creation of value.
Trust the process. As a designer, Michael learned the value of tracking the work, and showed Chris how to do this without a deadening overhead.
Designers must Invest in the development process. If you’re going to make the best thing you need to understand how it’s built. Conversely those doing the building, the engineers, need to understand that you don’t jump straight to output. Design is about experimentation and creation of choices. Without this the outcome is very poor indeed.
Stay Human. Trust each other.
Make the best thing.