Upgrade to Pro — share decks privately, control downloads, hide ads and more …

Distributed Systems - Pearson Correlation Algorithm

Distributed Systems - Pearson Correlation Algorithm

Presentation for Distributed Systems Course, regarding the PCAM analysis and MPI/Parallel implementation of the Pearson Correlation Algorithms for a movie recommendation system.
Repo for code and projects: https://github.com/zubie7a/Distributed_Systems

Santiago Zubieta

October 27, 2014
Tweet

More Decks by Santiago Zubieta

Other Decks in Programming

Transcript

  1. Distributed Systems
    Pearson Correlation Algorithm
    Juan David Castillo 201110006010
    Mateo Carvajal 201110031010
    Jose Cortés 201110045010
    Julian Restrepo 201319400010
    Santiago Zubieta 201110032010
    EAFIT University / 2014-2

    View Slide

  2. Context
    A ‘Recommendation System’ is a functionality of an Information
    System that allows to make recommendations of products,
    contents, objects, or many other things to users within that
    system (depending of the type of application or system). The
    pioneer in this approach is Amazon. When someone browses
    Amazon, the system will recommend or make suggestions of
    products based on the users’ previous purchases, the history
    of other users with similar behavior, preferences, etc.
    http://www.amazon.com/dp/0131103628/
    The C Programming Language - 2nd Edition

    View Slide

  3. Context
    There are many techniques or methods to implement ‘Recommendation Systems’, specially in movies, but the
    one we’re going to use its based on the historical behavior of all registered users in a movie website, finding
    potential similar users (and movies to watch) by comparing the ratings they’ve given to the same movies.
    Movie 1
    Movie 2
    Movie 3
    Movie 4
    Movie 5
    Movie 6
    Movie 7
    Movie j
    Movie M
    User 1
    User 2
    User 3
    User 4
    User 5
    User 6
    User 7
    User i
    User U
    0 1 2 1 0 1 4 2 2
    4 0 4 2 4 3 0 4 0
    3 2 5 0 2 0 5 4 0
    5 3 2 1 1 0 3 0 1
    2 0 1 2 0 4 4 4 5
    5 1 2 1 4 0 0 3 1
    2 2 1 4 4 0 5 2 4
    5 0 1 3 4 2 5 5 2
    1 1 2 1 0 4 4 4 4
    5 : Rating that User i has given to Movie j
    M: Total Amount of Available Movies
    U: Total Amount of Registered Users
    0 : Haven’t watched Movie
    1
    2
    3
    4
    5
    Worst
    Best
    Rating Scale
    Ideally, what those ‘Recommendation Systems’ do, is once
    the most suitable ~ compatible users are found, then
    suggestions are made to the current user, where such
    suggestions are the things the user haven’t watched, but
    that the compatible user(s) did and liked the most.
    B: Total Amount of most correlated Users we want
    to find for each given User.

    View Slide

  4. Correlation
    How can we find such Compatibility between users? We’re going to find the Correlation between them. In
    Statistics, Correlation refers to statistical relationships in random variables, measuring how similar or non
    deviated are them. In this case, our random variables will be the ratings each user give to a set of movies.
    0 1 2 1 0 1 4 2 2
    4 0 4 2 4 3 0 4 0
    3 2 5 0 2 0 5 4 0
    5 3 2 1 1 0 3 0 1
    2 0 1 2 0 4 4 4 5
    5 1 2 1 4 0 0 3 1
    2 2 1 4 4 0 5 2 4
    5 0 1 3 4 2 5 5 2
    1 1 2 1 0 4 4 4 4
    Finding the Correlation between 3’s & 7’s ratings.
    Personalization Techniques and Recommender Systems
    By G. Uchyigit, Matthew, M. Y. Ma
    http://books.google.com.co/books?id=tKWJArCo7msC&pg=PA172
    Covariance
    Standard Deviations
    (n - 1) cancels out
    Resulting Formula: Pearson Correlation
    for x for y
    Xi / Yi each element
    X / Y ratings’ mean
    ∆ i - ∆ distance to mean
    This aims to find similar ratings in movies and similar means.
    Movie 1
    Movie 2
    Movie 3
    Movie 4
    Movie 5
    Movie 6
    Movie 7
    Movie j
    Movie M
    User 1
    User 2
    User 3
    User 4
    User 5
    User 6
    User 7
    User i
    User U

    View Slide

  5. Result ~ Issues
    The result will be a value between -1 and 1. -1 or 1 means a very strong correlation, and closer to 0 means that
    there’s a very weak correlation, or nothing can be inferred from the current set. The sign shows if its a positive
    or a negative correlation, being 1 a direct relationship, and -1 an inverse relationship (anti-correlation).
    Personalization Techniques and Recommender Systems
    By G. Uchyigit, Matthew, M. Y. Ma
    http://books.google.com.co/books?id=tKWJArCo7msC&pg=PA172
    Covariance
    Standard Deviations
    (n - 1) cancels out
    Resulting Formula: Pearson Correlation
    for x for y
    Xi / Yi each element
    X / Y ratings’ mean
    ∆ i - ∆ distance to mean
    This aims to find similar ratings in movies and similar means.
    Edge case:
    The variance of a user’s ratings is 0. Nothing can be inferred.
    How is it possible? When a user has rated ALL the available
    movies with the same value, so distance to mean is ALWAYS 0.
    Or a user hasn’t watched ANY single movie, so all ratings are 0,
    therefore implying what was said, mean is 0, distances are 0,
    then Standard Deviation is 0, so corr(X,Y) divides by 0.
    If we find such a case, we’ll simply return a correlation of 0.
    https://en.wikipedia.org/wiki/Correlation_and_dependence

    View Slide

  6. Multiprocessing
    Using OpenMPI, design with PCAM
    Given a Ratings Matrix with the Ratings U
    Users have given to M Movies, we want to
    obtain a Recommendation Matrix with the B
    Users all U users are the most correlated with.
    M 1
    U 1
    U 2
    U 3
    U 4
    U 5
    U 6
    U 7
    U i
    U U
    0 1 2 1 0 1 4 2 2
    4 0 4 2 4 3 0 4 0
    3 2 5 0 2 0 5 4 0
    5 3 2 1 1 0 3 0 1
    2 0 1 2 0 4 4 4 5
    5 1 2 1 4 0 0 3 1
    2 2 1 4 4 0 5 2 4
    5 0 1 3 4 2 5 5 2
    1 1 2 1 0 4 4 4 4
    M 2
    M 3
    M 4
    M 5
    M 6
    M 7
    M j
    M U
    0 : Haven’t watched Movie
    1
    2
    3
    4
    5
    Worst
    Best
    Rating Scale
    B 1
    U 1
    U 2
    U 3
    U 4
    U 5
    U 6
    U 7
    U i
    U U
    3
    5 2
    4
    B 2
    B 3
    B B
    5
    1 8
    3
    9
    4 5
    1
    5
    2 6
    3
    1
    7 2
    3
    3
    8 2
    4
    3
    9 1
    5
    3
    2 4
    1
    9
    3 5
    2
    B
    3
    2
    1
    Correlation
    Order
    Values: Movie Ratings
    Values: User Indices
    Ratings Matrix Recommendation Matrix

    View Slide

  7. PCAM - Partition
    Motion Vector Finding Project
    Only the blocks
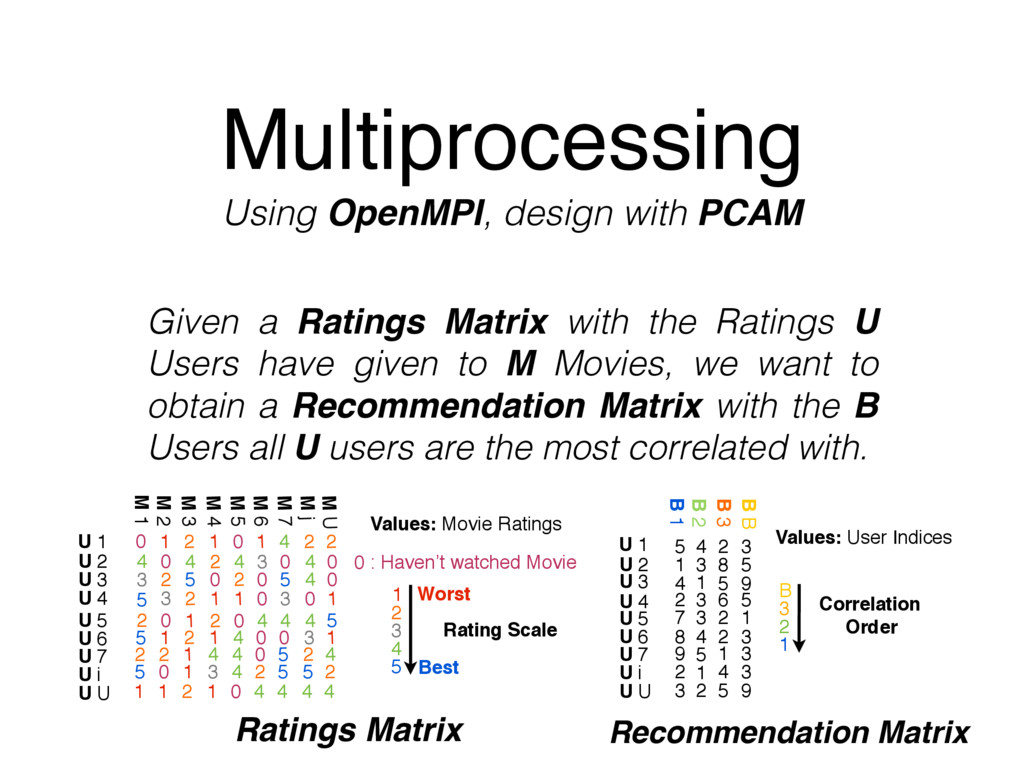
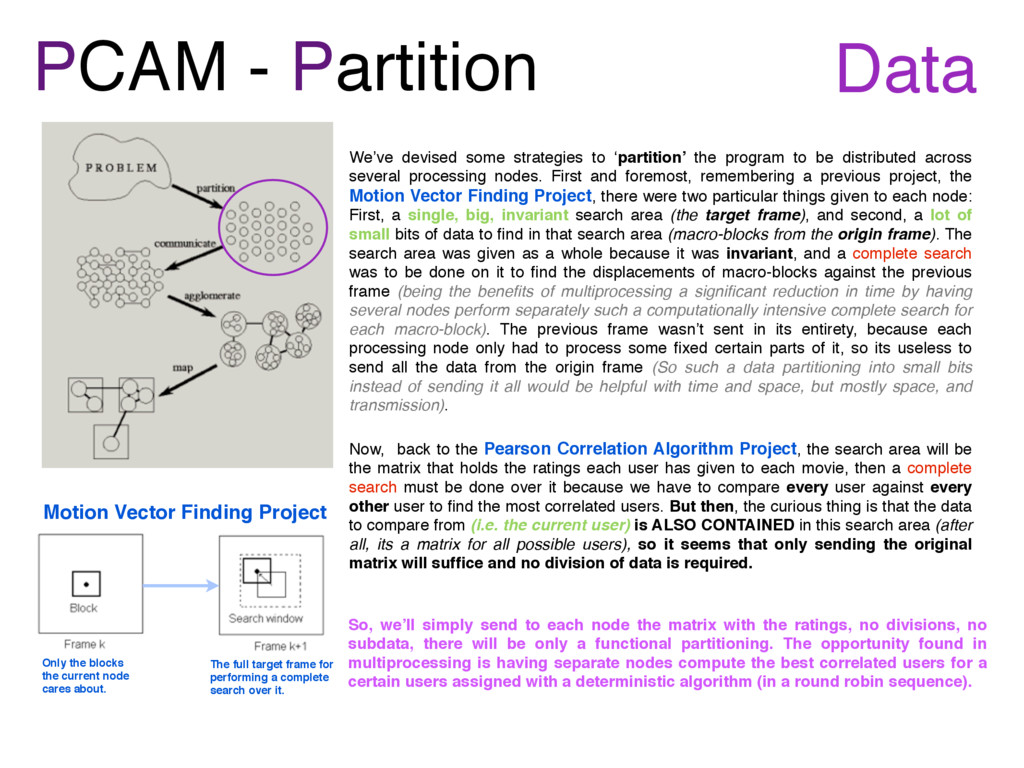
    the current node
    cares about.
    The full target frame for
    performing a complete
    search over it.
    We’ve devised some strategies to ‘partition’ the program to be distributed across
    several processing nodes. First and foremost, remembering a previous project, the
    Motion Vector Finding Project, there were two particular things given to each node:
    First, a single, big, invariant search area (the target frame), and second, a lot of
    small bits of data to find in that search area (macro-blocks from the origin frame). The
    search area was given as a whole because it was invariant, and a complete search
    was to be done on it to find the displacements of macro-blocks against the previous
    frame (being the benefits of multiprocessing a significant reduction in time by having
    several nodes perform separately such a computationally intensive complete search for
    each macro-block). The previous frame wasn’t sent in its entirety, because each
    processing node only had to process some fixed certain parts of it, so its useless to
    send all the data from the origin frame (So such a data partitioning into small bits
    instead of sending it all would be helpful with time and space, but mostly space, and
    transmission).
    Now, back to the Pearson Correlation Algorithm Project, the search area will be
    the matrix that holds the ratings each user has given to each movie, then a complete
    search must be done over it because we have to compare every user against every
    other user to find the most correlated users. But then, the curious thing is that the data
    to compare from (i.e. the current user) is ALSO CONTAINED in this search area (after
    all, its a matrix for all possible users), so it seems that only sending the original
    matrix will suffice and no division of data is required.
    So, we’ll simply send to each node the matrix with the ratings, no divisions, no
    subdata, there will be only a functional partitioning. The opportunity found in
    multiprocessing is having separate nodes compute the best correlated users for a
    certain users assigned with a deterministic algorithm (in a round robin sequence).
    Data

    View Slide

  8. PCAM - Partition
    A division of data CAN be done, though it would be very complex, as in:
    1. The Master has to load the whole data into its memory
    2. The Master sends to each Node the rows (users) they care about
    3. The Master sends to each Node just a part (half?) of the dataset to perform
    the correlation algorithm (full search) in with the given rows (users).
    4. The Nodes process that part (half?) of the dataset against the rows (users)
    that were sent to them.
    5. The Master sends to each Node another part (remaining half?) of data.
    6. The Nodes process this new part (half?) with the rows (users) they already
    were assigned with previously, and then merge internally in each block the
    results with the results of the previous part (half?) retaining only the best.
    Node A Users/Rows
    M 1
    U 1
    U 2
    U 3
    U 4
    U 5
    U 6
    U 7
    U i
    U U
    0 1 2 1 0 1 4 2 2
    3 2 5 0 2 0 5 4 0
    2 0 1 2 0 4 4 4 5
    2 2 1 4 4 0 5 2 4
    1 1 2 1 0 4 4 4 4
    M 2
    M 3
    M 4
    M 5
    M 6
    M 7
    M j
    M U
    M 1
    U 1
    U 2
    U 3
    U 4
    U 5
    U 6
    U 7
    U i
    U U
    4 0 4 2 4 3 0 4 0
    5 3 2 1 1 0 3 0 1
    5 1 2 1 4 0 0 3 1
    5 0 1 3 4 2 5 5 2
    M 2
    M 3
    M 4
    M 5
    M 6
    M 7
    M j
    M U
    Node B Users/Rows
    M 1
    U 1
    U 2
    U 3
    U 4
    U 5
    U 6
    U 7
    U i
    U U
    0 1 2 1 0 1 4 2 2
    4 0 4 2 4 3 0 4 0
    3 2 5 0 2 0 5 4 0
    5 3 2 1 1 0 3 0 1
    2 0 1 2 0 4 4 4 5
    5 1 2 1 4 0 0 3 1
    2 2 1 4 4 0 5 2 4
    5 0 1 3 4 2 5 5 2
    1 1 2 1 0 4 4 4 4
    M 2
    M 3
    M 4
    M 5
    M 6
    M 7
    M j
    M U
    First
    Part
    Last
    Part
    ... (n/2 size of data) ...
    Data
    Such a division is only helpful in case the nodes have very limited memory, but being the case plain text
    files, we won’t worry about such a case. Also would be slower because an increased number of
    connections to be opened across the network. Also we are assuming multiprocessing on Machine
    level, if we were to go a level deeper (In each Machine’s Processors) this could be applied, each
    Machine has the whole dataset, only a certain Users to calculate, and then, give each available
    Processor a part of the Dataset, to find independently within the Machine the best correlated
    Users, and then perform a Merge at the end. Such a Merge would be the Agglomeration
    part of PCAM.

    View Slide

  9. PCAM - Partition Functionality
    In terms of functionality the program consists of 3 parts:
    TASK_ID + (i * NUM_PROCS)
    ID of the current task,
    acting like an offset.
    Total number of
    processes given
    MPI was run with.
    increasing
    iterator
    U1
    User to
    process
    Do this until U1 is a
    value that exceeds the
    total amount of users.
    Then, a non-conditional block of code, which all Nodes, be it the Master or a Worker, will run, and its
    calculating the correlation of a given user against all other users, and storing just the best B users.
    To determine the current user a node will process, a deterministic algorithm will be applied in a loop. Then
    compare such an user with everyone, of course, excluding itself ;-)
    Equivalent
    function each Node calls for all users it deals with:
    Now, for all other users, as said, designed as U2:
    Returning only the NUM_BEST most correlated.
    findCorrelation is the application of the Pearson Correlation Algorithm that was handed to us.
    An initial conditional block where the Master loads the file and starts sending it to all other Nodes (Master
    already counts as a Node), and where Workers will listen to such incoming data.
    Then comes the third block of the program, which is again a conditional block, where the Workers will send back to the Master the
    Recommendation Lists they made for their respective Users. The Master, will merge all these Recommendation Lists from the
    Workers (and the Recommendations Lists it calculated itself) into a final Recommendation Matrix. The Recommendation
    Matrix is the final output of the program, and its a U * B matrix, where the first dimension is the number of Users
    (U) and the second dimension is the amount of Best Matches we wanted to find (B). For each User then, there
    will be B values, which are the indices of the B Users this User is the most correlated with.

    View Slide

  10. PCAM - Communication
    The communication we’ve established will be to distribute the data among Nodes in a
    Round Robin fashion. The Nodes will simply receive the Ratings Matrix once (we are
    assuming we don’t have an Storage distributed across a Network, so instead of simply
    sending the filename to open it in each Node, we’re sending all the contents).
    From there on each Node will calculate several Recommendation Lists for Users its
    concerned with. At the end, the Nodes will broadcast back to the Master all these
    Recommendation Lists, the Blocking Operations RECV and SEND are to be used, but
    it doesn’t really matter because the Master will be listening to MPI_ANY_SOURCE
    (meaning its not blocked waiting for a message from a certain specific Node), instead the
    first message that arrives will be grabbed immediately by the Master. Then, how can we
    know which Node sent it? Using the status of the request we can know the ID of such
    Node. Knowing exactly where a result request comes from, helps MAPPING it in the
    overall result, but waiting for a specific ID will make the use of blocking operations go
    very slow and crazy waiting, so, listen for any incoming request (U times), and then
    check where did it come from.
    M 1
    U 1
    U 2
    U 3
    U 4
    U 5
    U 6
    U 7
    U i
    U U
    0 1 2 1 0 1 4 2 2
    4 0 4 2 4 3 0 4 0
    3 2 5 0 2 0 5 4 0
    5 3 2 1 1 0 3 0 1
    2 0 1 2 0 4 4 4 5
    5 1 2 1 4 0 0 3 1
    2 2 1 4 4 0 5 2 4
    5 0 1 3 4 2 5 5 2
    1 1 2 1 0 4 4 4 4
    M 2
    M 3
    M 4
    M 5
    M 6
    M 7
    M j
    M U
    Node Incoming Data: all the Ratings Matrix
    U1, U4, U7, the users this Node will deal with.
    Apply the Algorithm
    Node Outgoing Data: the Recommendation List
    for the Users it processed.
    U 1
    U 4
    U 7
    3
    5 2
    4
    5
    2 6
    3
    3
    9 2
    5
    The Recommendation List of a User is a list with
    the B most recommended Users for the current
    User.
    B 1
    B 2
    B 3
    B B
    The Master will later merge all these
    Recommendation Lists into the
    resulting Recommendation Matrix.

    View Slide

  11. The same algorithm that was designed to establish the order of communications
    is the one to map the work of Nodes, both into the Nodes and back from them.
    Each Node knows which User to process using the formula based on its own ID:
    TASK_ID + (i * NUM_PROCS)
    ID of the current task,
    acting like an offset.
    Total number of
    processes given
    MPI was run with.
    increasing
    iterator
    U1
    User to
    process
    PCAM - Mapping
    And then the Node will process the Users its concerned with in the order they appear in
    the Dataset. Preserving this order is a useful property, because its the order the
    Recommendation Lists will be stored in, and the order they will be sent back to the
    Master. The Master is listening for data, but not to an specific Node, then the ID of the
    Node is checked, and with the same formula we’ll determine to which User does the
    currently returned Recommendation List belongs to. The iterator in this case will be the
    amount of already received results from a given Node, starting from 0. This way, we don’t
    need to pass around the ID of a User, we can know to which User a Recommendation List
    belongs to, just knowing from which Node it comes from, and how many other results have
    been previously received from it. This way, all the Users are mapped into different
    Machines, and all Recommendation Lists are mapped back into the final
    Recommendation Matrix
    M 1
    U 1
    U 2
    U 3
    U 4
    U 5
    U 6
    U 7
    U i
    U U
    0 1 2 1 0 1 4 2
    4 0 4 2 4 3 0 4
    3 2 5 0 2 0 5 4
    5 3 2 1 1 0 3 0
    2 0 1 2 0 4 4 4
    5 1 2 1 4 0 0 3
    2 2 1 4 4 0 5 2
    5 0 1 3 4 2 5 5
    1 1 2 1 0 4 4 4
    M 2
    M 3
    M 4
    M 5
    M 6
    M 7
    M j
    M U
    Mapping Users To Node With Formula
    2
    0
    0
    1
    5
    1
    4
    2
    4
    U1, U4, U7, the users this Node will deal with.
    TASK_ID + (i * NUM_PROCS)
    U1
    1
    1
    1
    0
    1
    2
    3
    3
    3
    1
    4
    7
    Mapping back works the same!
    The master is only concerned with
    receiving a Recommendation List,
    and whom does it comes from.
    Sending the User it belongs to is
    a waste of MPI connections, we
    can infer it with the same formula!

    View Slide

  12. Finding the B Best Correlated Users
    To find the B Best Correlated Users with a given User, we first need to find out the correlation between the given
    User and ALL other U Users. After having found all these correlations, a couple strategies appear to find in this
    list the B Best Correlated Users:
    Multiple Linear Searches: On the list containing the correlations the current User has with all other Users, lets
    iterate B times, each time storing the index of the User with the highest correlation,
    and then ‘removing it’ from the list (marking it as a impossible value so it isn’t caught
    in the next iteration).
    Complexity: O(B * U)
    For small values of B its negligible, but for large values, specially close to the number of Users U, it will become
    O(U^2), which is a very huge asymptotic running time. The specification tells us that B will be a small value, and in
    practice it should be, because we don’t want to know the the correlation with all other registered U Users in order.
    Sort And Constant Access: Sort the list containing the correlations the current User has with all other Users. This
    sorted list will allow us to access the top B correlated Users in constant time! but...
    Complexity: O(U log U) + O(B)
    The problem with this approach is that for large amounts of Users U and small B, it will unnecessarily sort all the
    elements while we only want the order of the top B, not the remaining ones. It is useful for large B because in
    asymptotic complexity, O(U log U) + O(U) is faster than O(U^2)
    So we chose the first strategy for finding the B Best Correlated
    Users in respect of a given User for practical purposes.

    View Slide

  13. Building and Running
    Building:
    Running:
    $ chmod +x ./build.sh
    $ ./build.sh
    $ ./gendata [U] [M] [B]
    Generate a data file with U users, M movies (each position with random ratings
    between 0 and 5) and put a B value for the Best Correlated Users to match later.
    Run the Serial version of the Pearson Correlation Algorithm Program.
    $ time ./spearson
    $ mpirun -np [...] mpiearson
    Run the MPI version of the Pearson Correlation Algorithm Program.

    View Slide

  14. Time -np 4 -np 3 -np 2 serial
    1000 U
    1000 M
    10 B
    9.02s 10.1s 13.5s 24.17s
    We can notice an Inverse Exponential trend
    in the Running Time in function of the Nodes
    working on solving the problem, making
    noticeable the advantages of working with
    Multi Processing!

    View Slide

  15. Have a nice day!

    View Slide