Upgrade to Pro — share decks privately, control downloads, hide ads and more …

Measurable Goal Setting Framework: A Reference ...

Measurable Goal Setting Framework: A Reference Guide for Leadership | Arthur Mielnik

A practical framework for setting goals that can actually be measured, tracked, and held accountable. Written for executives, operators, and leadership teams who want to move from vague aspirations to concrete, dashboard-ready objectives.

This reference guide covers:

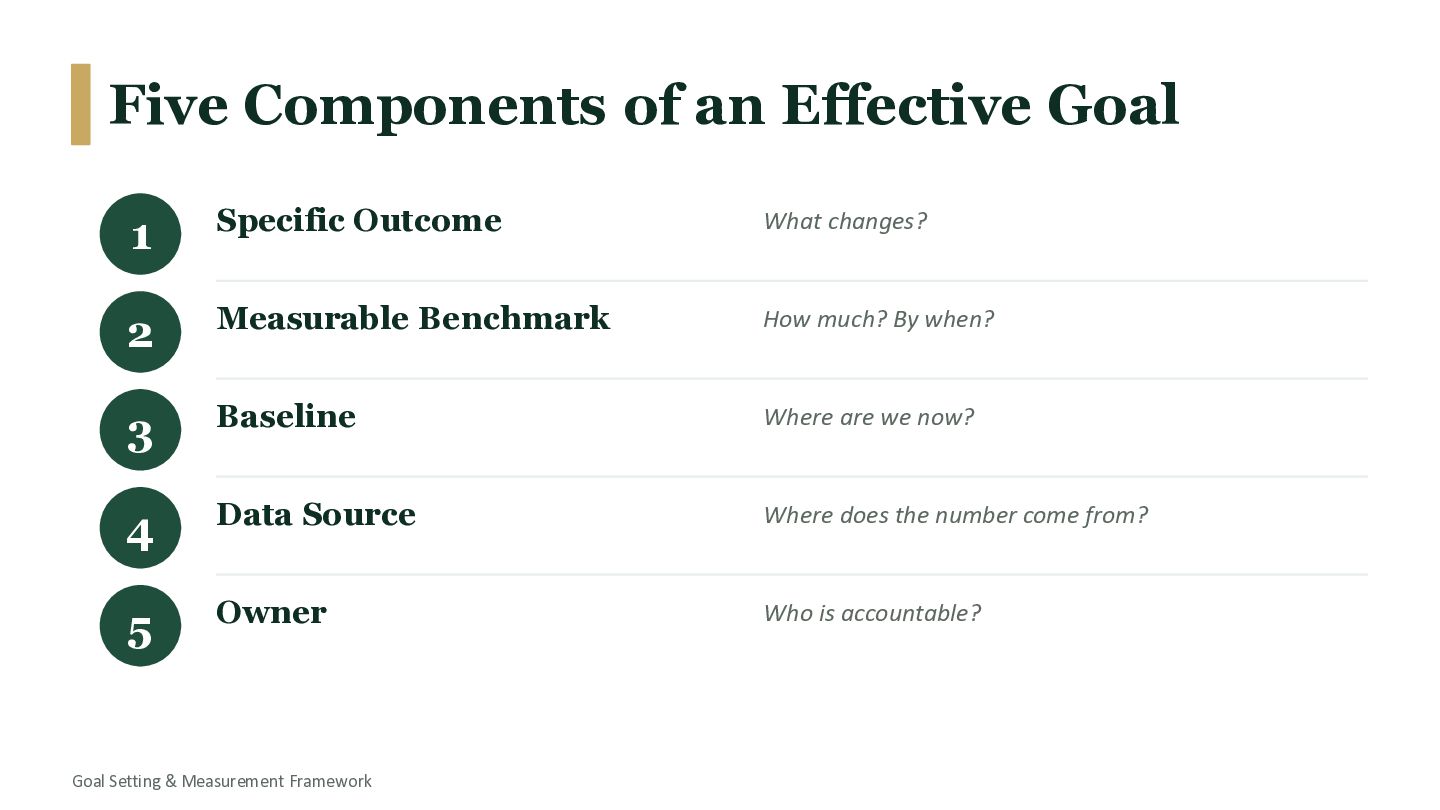
- The five components of an effective goal (specific outcome, measurable benchmark, baseline, data source, owner)
- Why "activities are not objectives" and how to tell the difference
- Industry-specific goal examples across operations, revenue, customer experience, marketing, people & culture, and finance
- Concrete examples for manufacturing, SaaS, hospitality, restaurants, e-commerce, consumer brands, B2B SaaS, retail, consulting, tech, startups, nonprofits, and agencies
- A self-check tool for anyone writing organizational goals
- Rules of thumb for distinguishing goals (dashboard metrics) from projects (Gantt chart deliverables)

Whether you're running a leadership retreat, building an annual plan, or auditing your team's OKRs, this framework helps separate themes from goals and aspirations from objectives.

About the author: Arthur Mielnik is a strategic planning and operations leader based in New York City with a background in financial modeling, organizational growth, and performance measurement systems. He writes about leadership operations, measurement frameworks, and applied business strategy at arthurmielnik.com.

Read more: https://arthurmielnik.com
Connect on LinkedIn: https://www.linkedin.com/in/arthurmielnik/

Tags: goal setting, measurement framework, OKRs, leadership, strategic planning, business strategy, KPIs, dashboards, organizational performance, executive leadership

Avatar for Arthur Mielnik

Arthur Mielnik

May 19, 2026

Other Decks in Business

Transcript

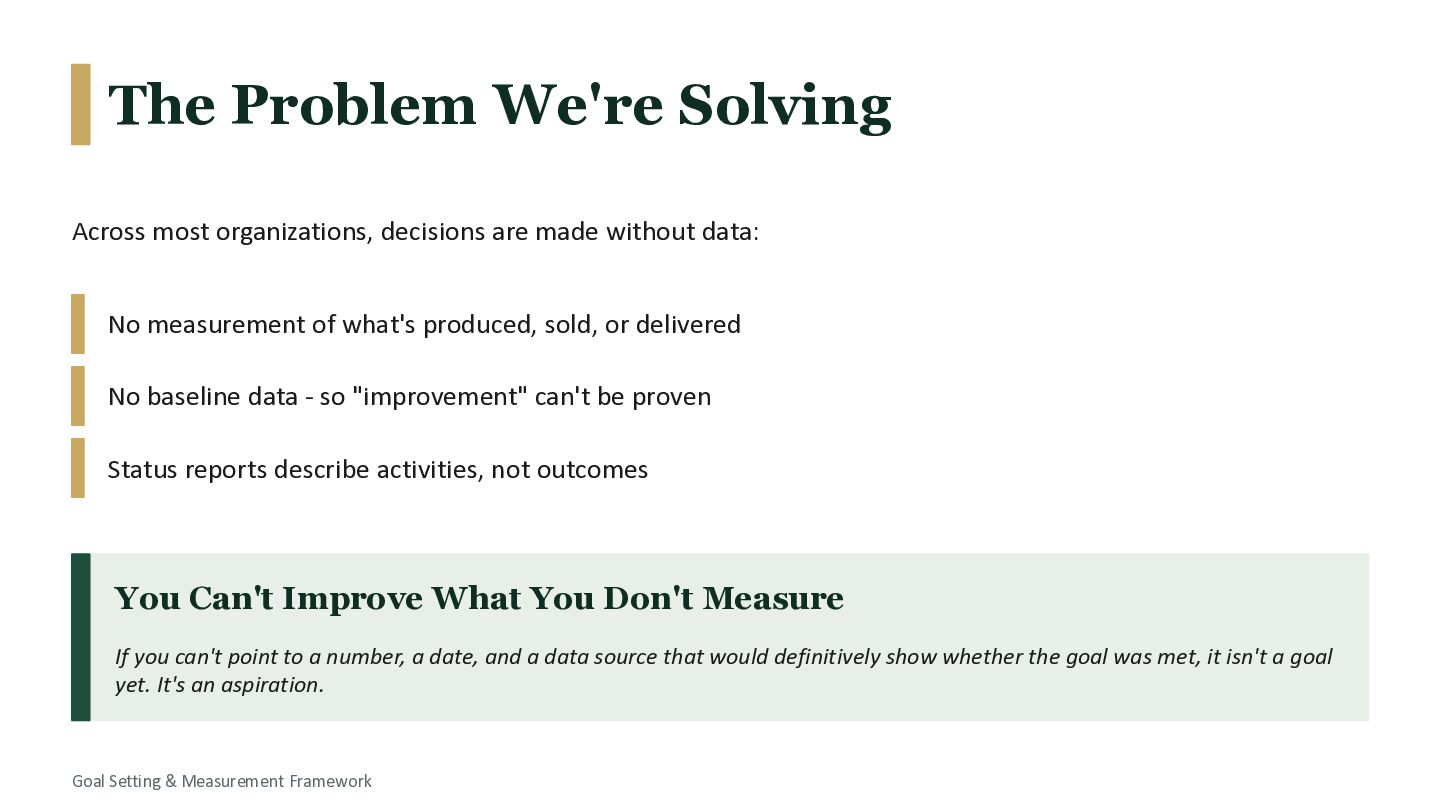
  1. The Problem We're Solving Across most organizations, decisions are made

    without data: No measurement of what's produced, sold, or delivered No baseline data - so "improvement" can't be proven Status reports describe activities, not outcomes You Can't Improve What You Don't Measure If you can't point to a number, a date, and a data source that would definitively show whether the goal was met, it isn't a goal yet. It's an aspiration. Goal Setting & Measurement Framework
  2. Five Components of an Effective Goal 1 Specific Outcome What

    changes? 2 Measurable Benchmark How much? By when? 3 Baseline Where are we now? 4 Data Source Where does the number come from? 5 Owner Who is accountable? Goal Setting & Measurement Framework
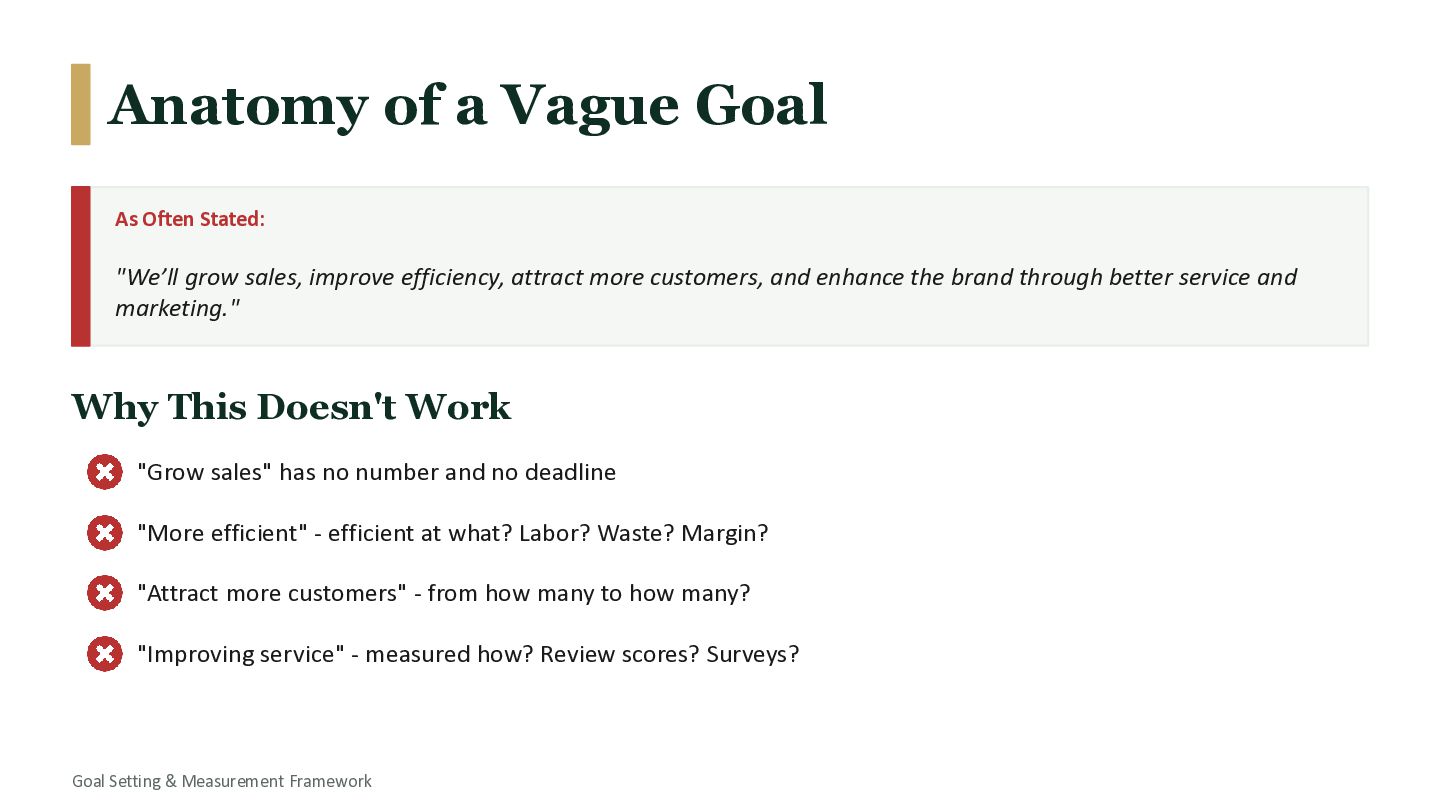
  3. Anatomy of a Vague Goal As Often Stated: "We’ll grow

    sales, improve efficiency, attract more customers, and enhance the brand through better service and marketing." Why This Doesn't Work "Grow sales" has no number and no deadline "More efficient" - efficient at what? Labor? Waste? Margin? "Attract more customers" - from how many to how many? "Improving service" - measured how? Review scores? Surveys? Goal Setting & Measurement Framework
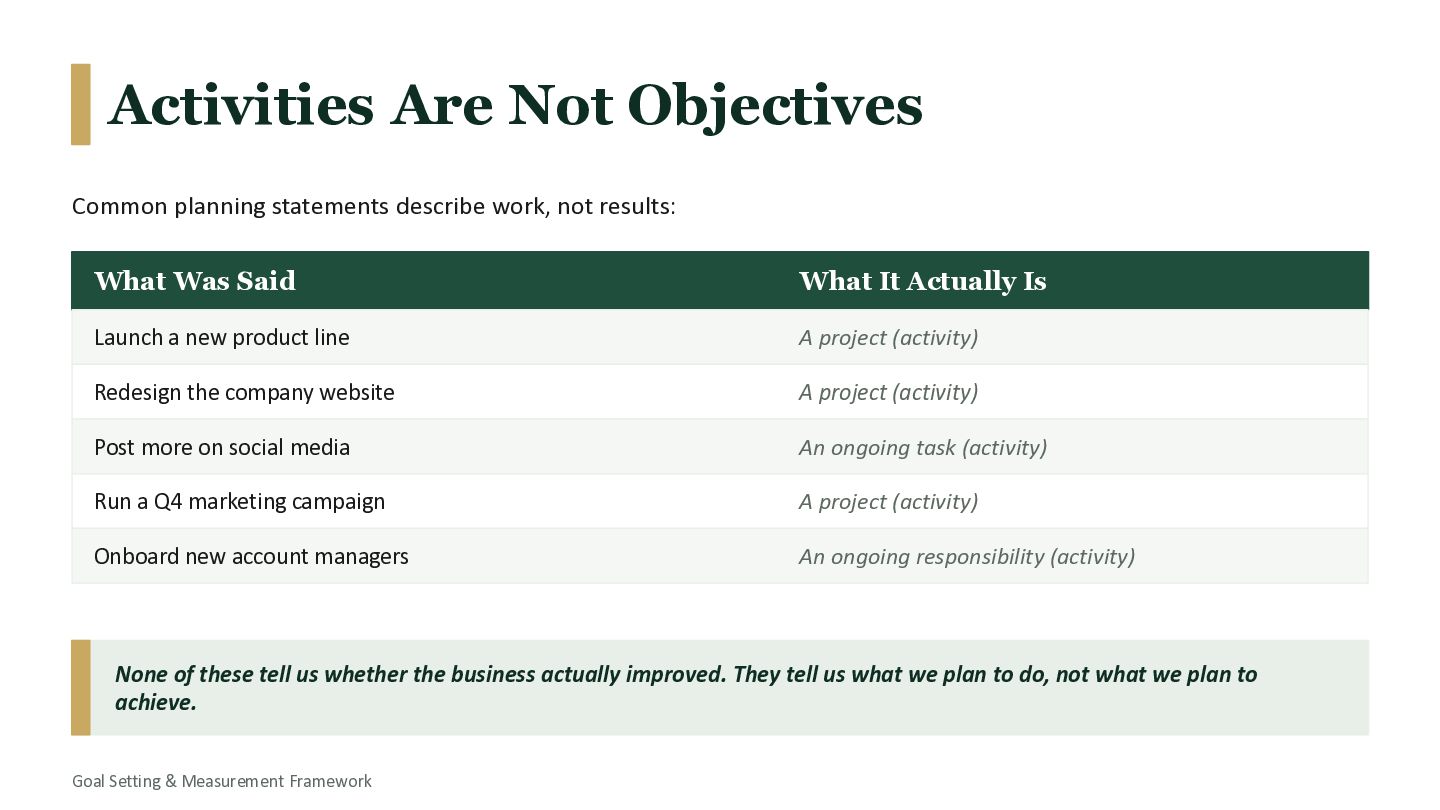
  4. Activities Are Not Objectives Common planning statements describe work, not

    results: What Was Said What It Actually Is Launch a new product line A project (activity) Redesign the company website A project (activity) Post more on social media An ongoing task (activity) Run a Q4 marketing campaign A project (activity) Onboard new account managers An ongoing responsibility (activity) None of these tell us whether the business actually improved. They tell us what we plan to do, not what we plan to achieve. Goal Setting & Measurement Framework
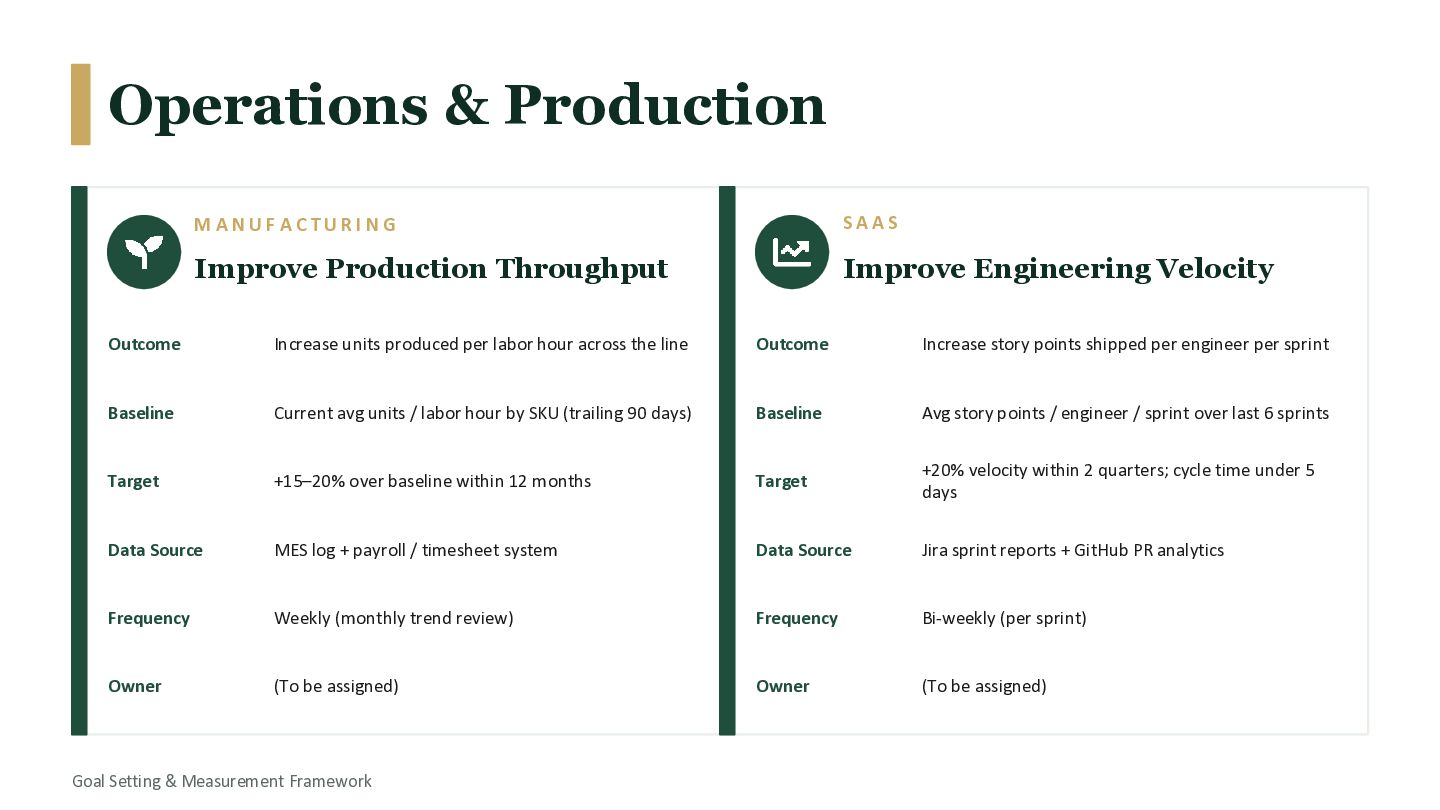
  5. Operations & Production M A N U F A C

    T U R I N G Improve Production Throughput Outcome Increase units produced per labor hour across the line Baseline Current avg units / labor hour by SKU (trailing 90 days) Target +15–20% over baseline within 12 months Data Source MES log + payroll / timesheet system Frequency Weekly (monthly trend review) Owner (To be assigned) S A A S Improve Engineering Velocity Outcome Increase story points shipped per engineer per sprint Baseline Avg story points / engineer / sprint over last 6 sprints Target +20% velocity within 2 quarters; cycle time under 5 days Data Source Jira sprint reports + GitHub PR analytics Frequency Bi-weekly (per sprint) Owner (To be assigned) Goal Setting & Measurement Framework
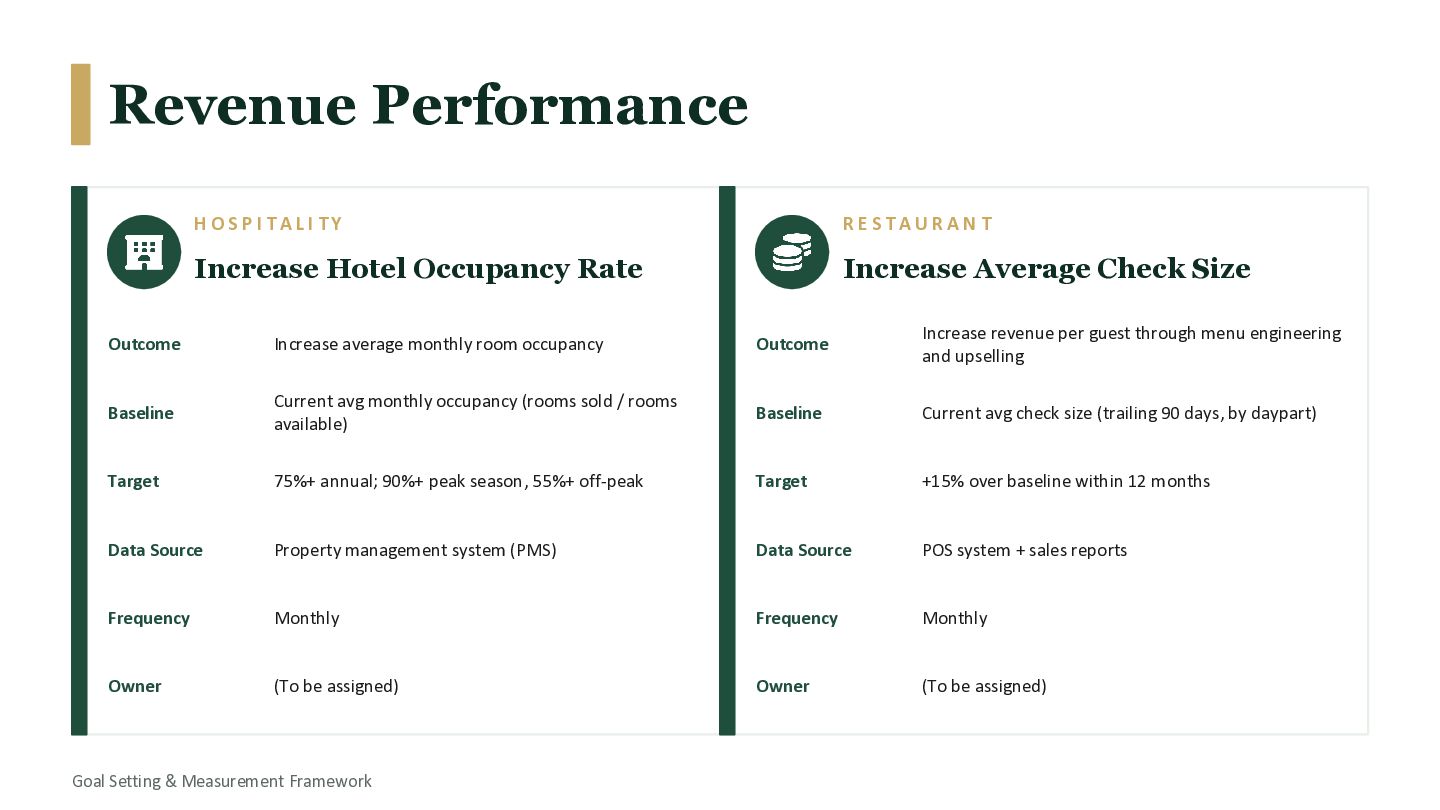
  6. Revenue Performance H O S P I T A L

    I T Y Increase Hotel Occupancy Rate Outcome Increase average monthly room occupancy Baseline Current avg monthly occupancy (rooms sold / rooms available) Target 75%+ annual; 90%+ peak season, 55%+ off-peak Data Source Property management system (PMS) Frequency Monthly Owner (To be assigned) R E S T A U R A N T Increase Average Check Size Outcome Increase revenue per guest through menu engineering and upselling Baseline Current avg check size (trailing 90 days, by daypart) Target +15% over baseline within 12 months Data Source POS system + sales reports Frequency Monthly Owner (To be assigned) Goal Setting & Measurement Framework
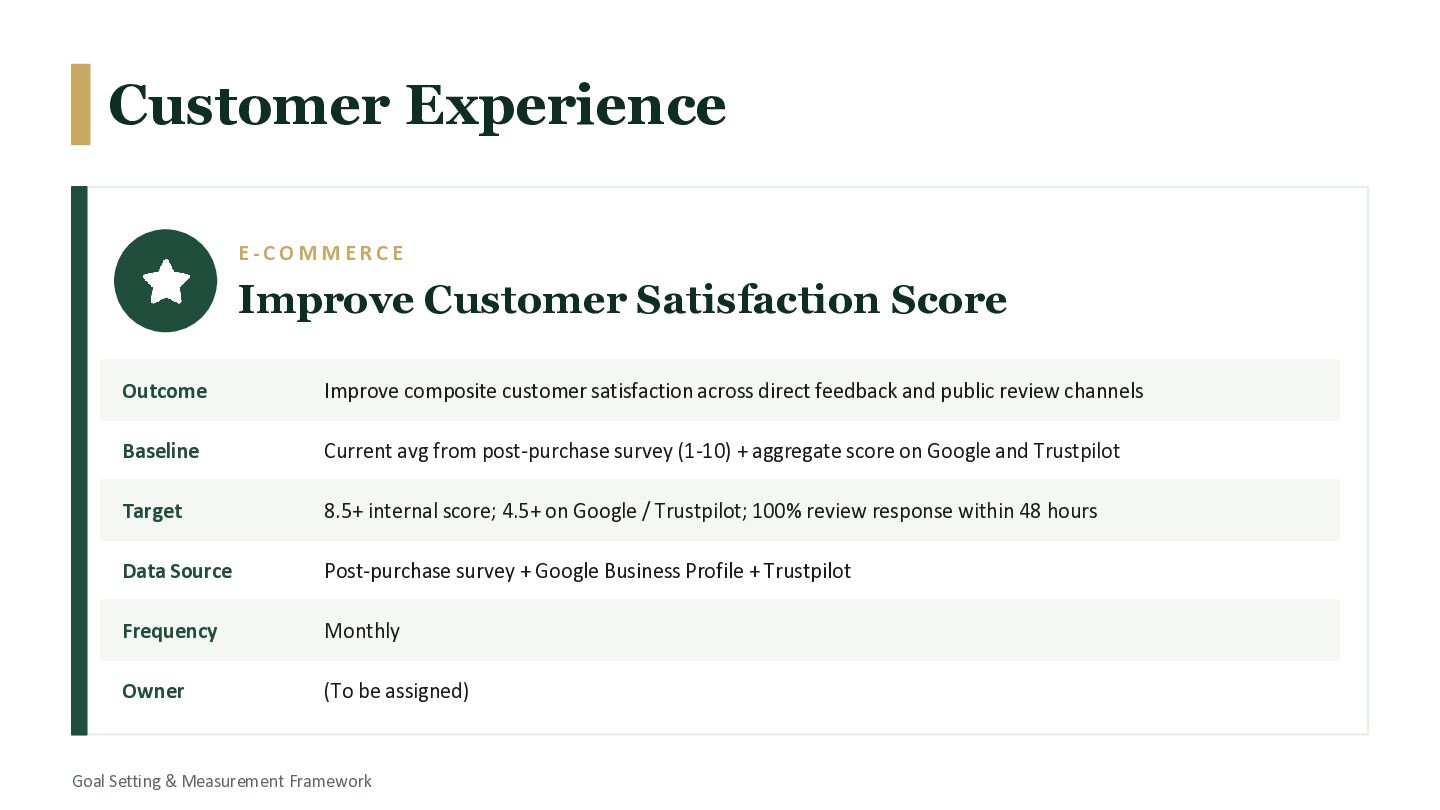
  7. Customer Experience E - C O M M E R

    C E Improve Customer Satisfaction Score Outcome Improve composite customer satisfaction across direct feedback and public review channels Baseline Current avg from post-purchase survey (1-10) + aggregate score on Google and Trustpilot Target 8.5+ internal score; 4.5+ on Google / Trustpilot; 100% review response within 48 hours Data Source Post-purchase survey + Google Business Profile + Trustpilot Frequency Monthly Owner (To be assigned) Goal Setting & Measurement Framework
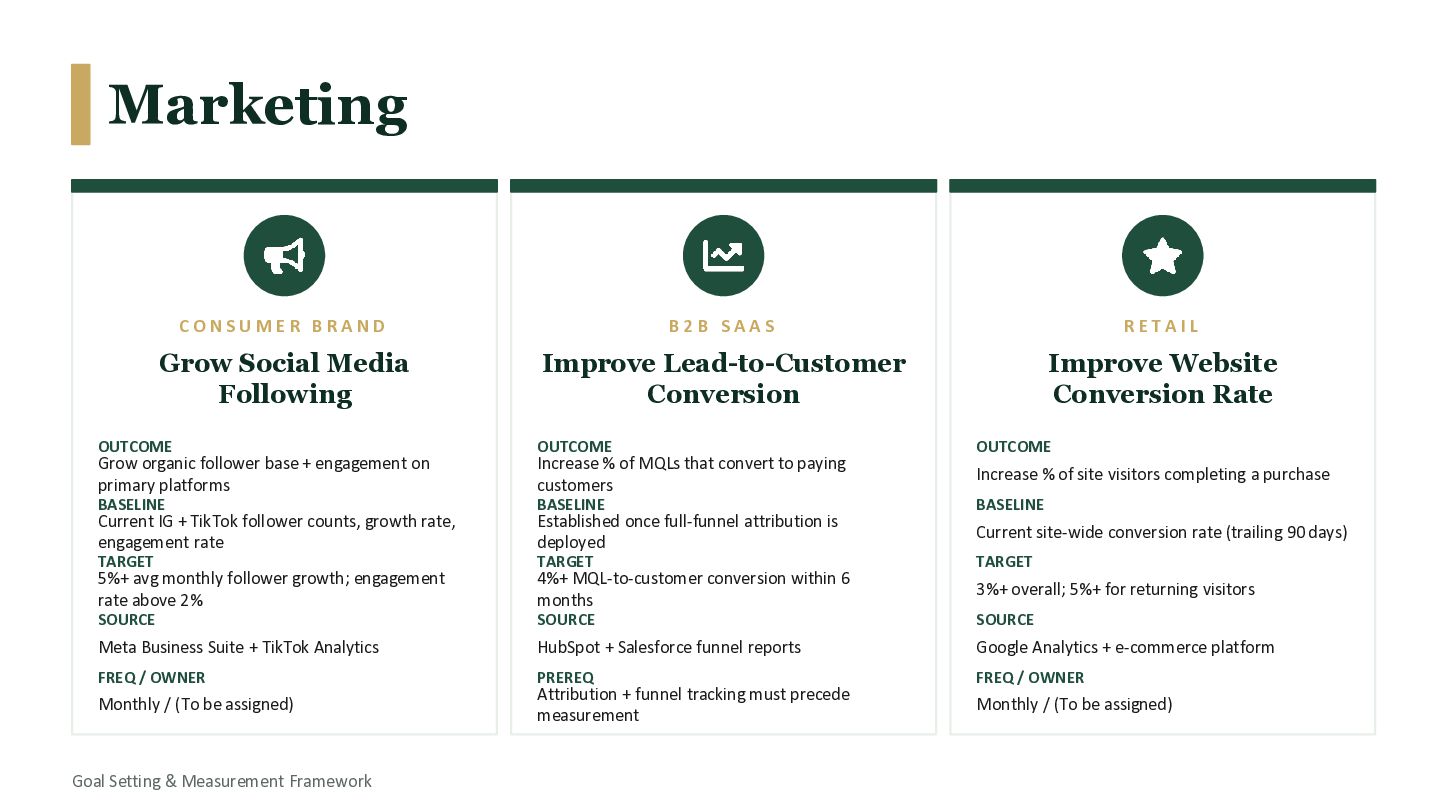
  8. Marketing C O N S U M E R B

    R A N D Grow Social Media Following OUTCOME Grow organic follower base + engagement on primary platforms BASELINE Current IG + TikTok follower counts, growth rate, engagement rate TARGET 5%+ avg monthly follower growth; engagement rate above 2% SOURCE Meta Business Suite + TikTok Analytics FREQ / OWNER Monthly / (To be assigned) B 2 B S A A S Improve Lead-to-Customer Conversion OUTCOME Increase % of MQLs that convert to paying customers BASELINE Established once full-funnel attribution is deployed TARGET 4%+ MQL-to-customer conversion within 6 months SOURCE HubSpot + Salesforce funnel reports PREREQ Attribution + funnel tracking must precede measurement R E T A I L Improve Website Conversion Rate OUTCOME Increase % of site visitors completing a purchase BASELINE Current site-wide conversion rate (trailing 90 days) TARGET 3%+ overall; 5%+ for returning visitors SOURCE Google Analytics + e-commerce platform FREQ / OWNER Monthly / (To be assigned) Goal Setting & Measurement Framework
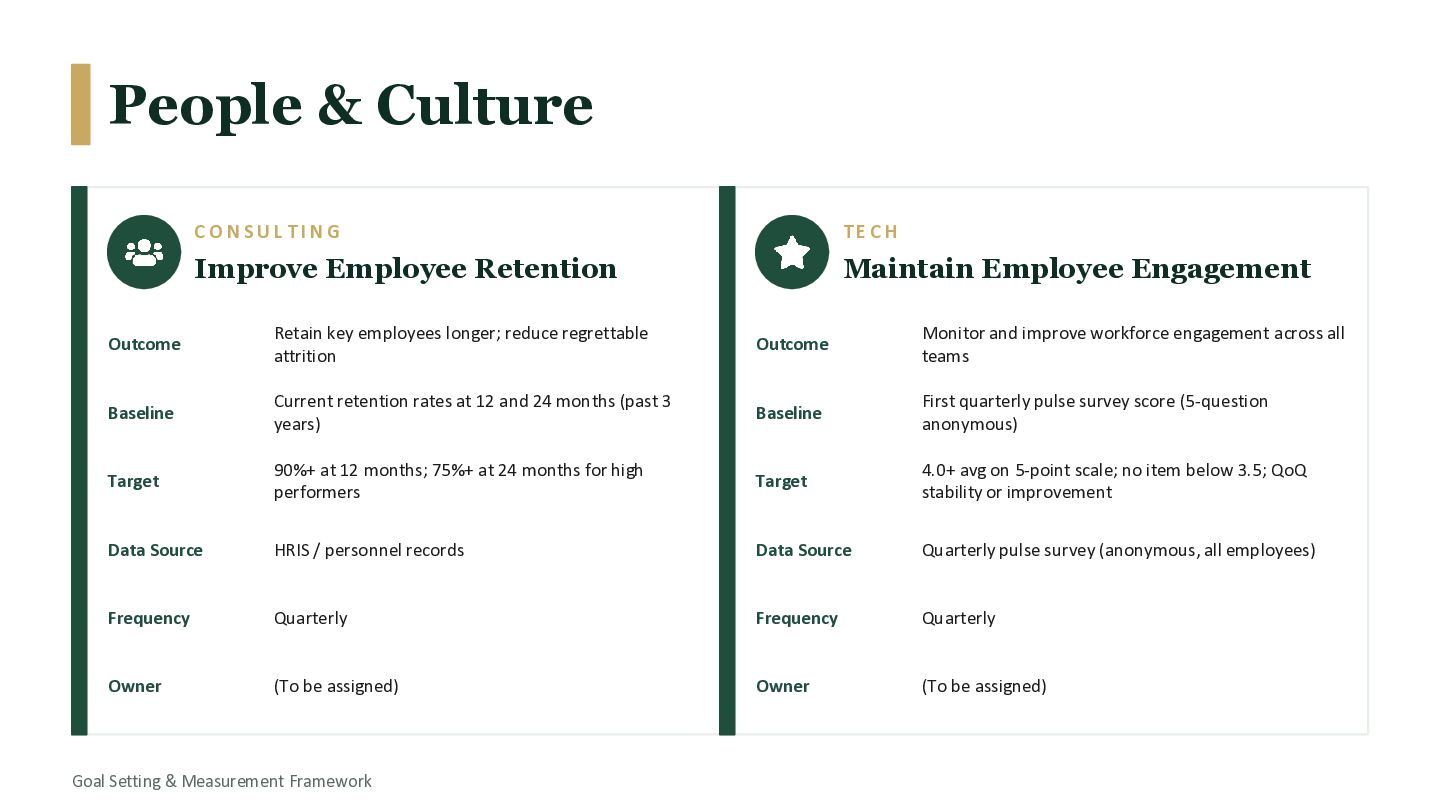
  9. People & Culture C O N S U L T

    I N G Improve Employee Retention Outcome Retain key employees longer; reduce regrettable attrition Baseline Current retention rates at 12 and 24 months (past 3 years) Target 90%+ at 12 months; 75%+ at 24 months for high performers Data Source HRIS / personnel records Frequency Quarterly Owner (To be assigned) T E C H Maintain Employee Engagement Outcome Monitor and improve workforce engagement across all teams Baseline First quarterly pulse survey score (5-question anonymous) Target 4.0+ avg on 5-point scale; no item below 3.5; QoQ stability or improvement Data Source Quarterly pulse survey (anonymous, all employees) Frequency Quarterly Owner (To be assigned) Goal Setting & Measurement Framework
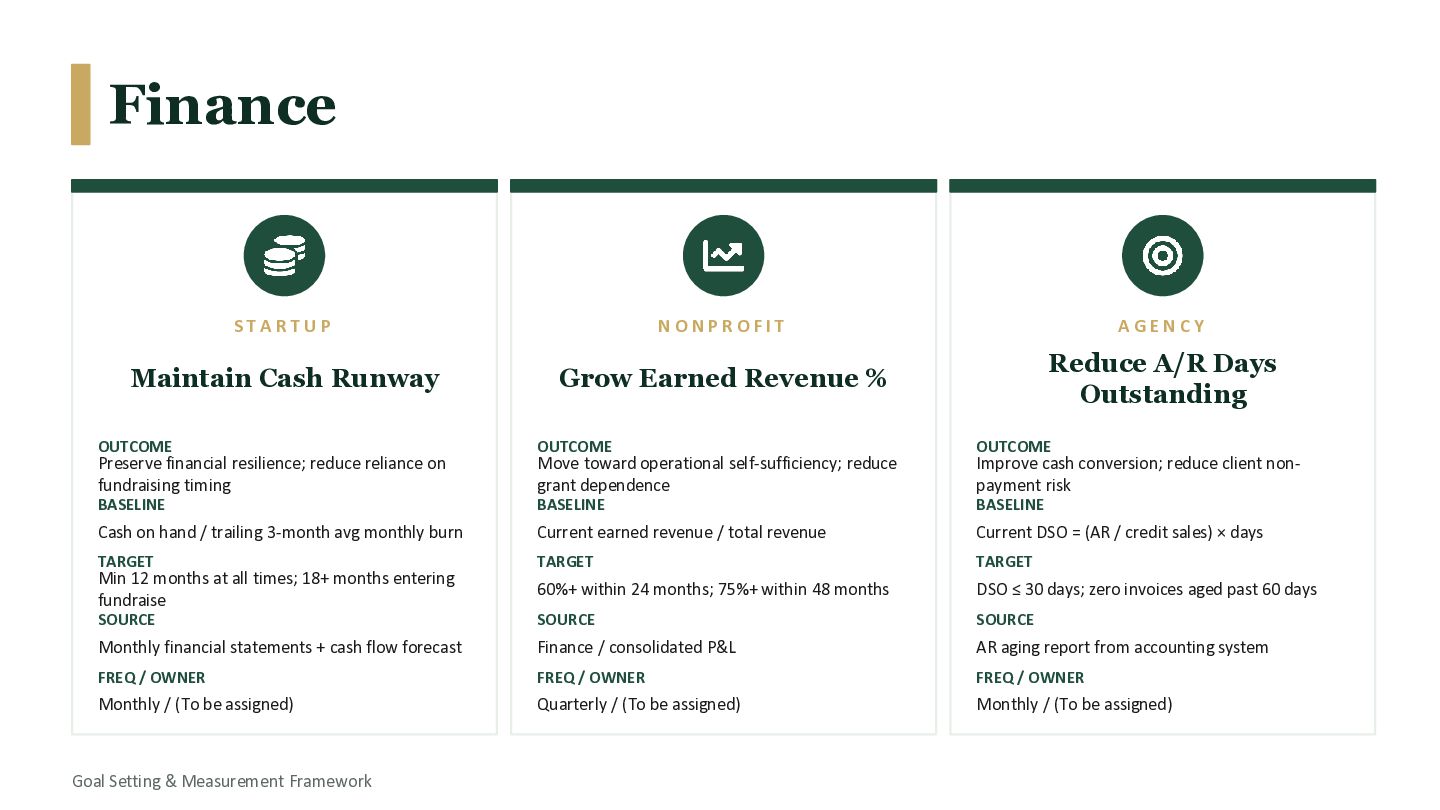
  10. Finance S T A R T U P Maintain Cash

    Runway OUTCOME Preserve financial resilience; reduce reliance on fundraising timing BASELINE Cash on hand / trailing 3-month avg monthly burn TARGET Min 12 months at all times; 18+ months entering fundraise SOURCE Monthly financial statements + cash flow forecast FREQ / OWNER Monthly / (To be assigned) N O N P R O F I T Grow Earned Revenue % OUTCOME Move toward operational self-sufficiency; reduce grant dependence BASELINE Current earned revenue / total revenue TARGET 60%+ within 24 months; 75%+ within 48 months SOURCE Finance / consolidated P&L FREQ / OWNER Quarterly / (To be assigned) A G E N C Y Reduce A/R Days Outstanding OUTCOME Improve cash conversion; reduce client non- payment risk BASELINE Current DSO = (AR / credit sales) × days TARGET DSO ≤ 30 days; zero invoices aged past 60 days SOURCE AR aging report from accounting system FREQ / OWNER Monthly / (To be assigned) Goal Setting & Measurement Framework
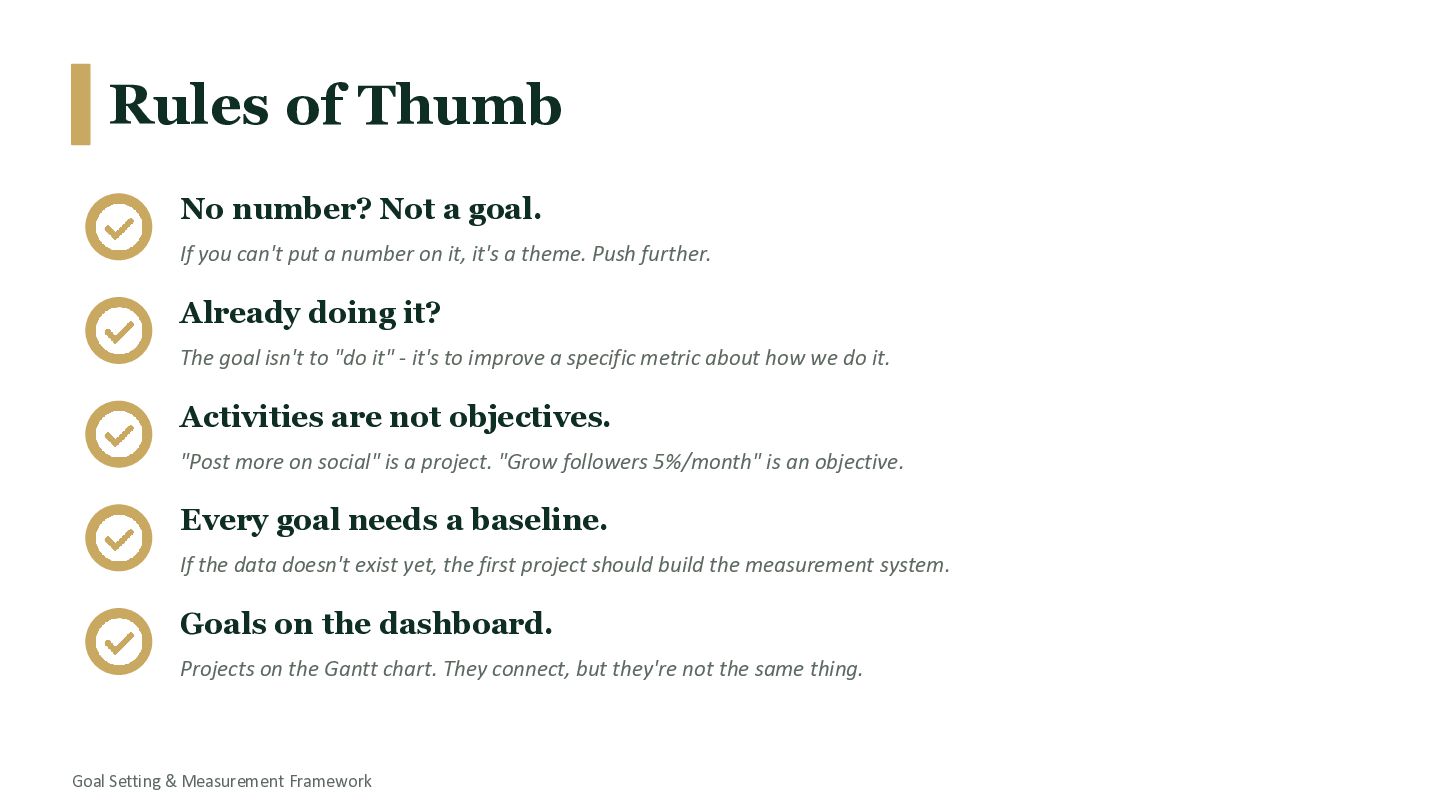
  11. Rules of Thumb No number? Not a goal. If you

    can't put a number on it, it's a theme. Push further. Already doing it? The goal isn't to "do it" - it's to improve a specific metric about how we do it. Activities are not objectives. "Post more on social" is a project. "Grow followers 5%/month" is an objective. Every goal needs a baseline. If the data doesn't exist yet, the first project should build the measurement system. Goals on the dashboard. Projects on the Gantt chart. They connect, but they're not the same thing. Goal Setting & Measurement Framework
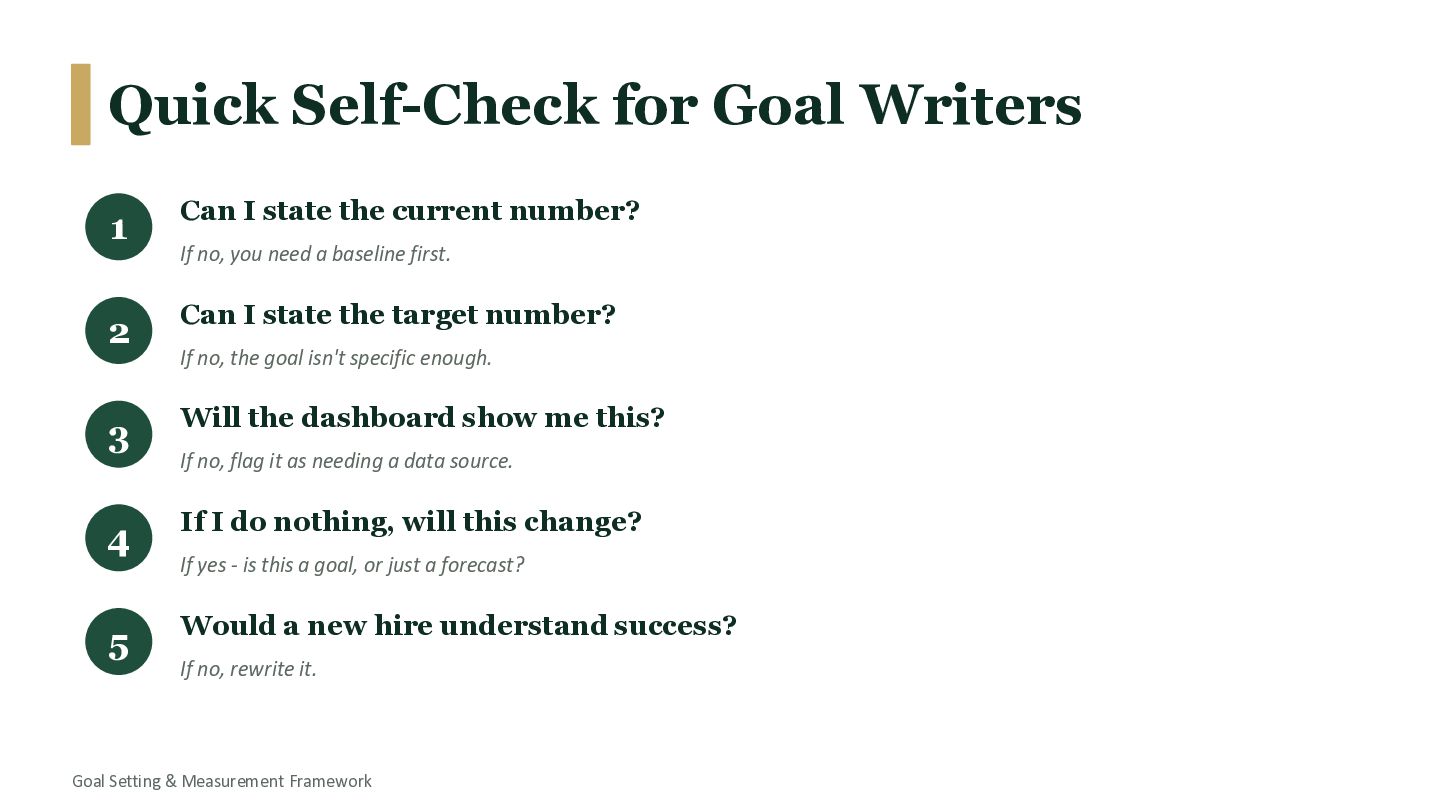
  12. Quick Self-Check for Goal Writers 1 Can I state the

    current number? If no, you need a baseline first. 2 Can I state the target number? If no, the goal isn't specific enough. 3 Will the dashboard show me this? If no, flag it as needing a data source. 4 If I do nothing, will this change? If yes - is this a goal, or just a forecast? 5 Would a new hire understand success? If no, rewrite it. Goal Setting & Measurement Framework
  13. Start Measuring Start Improving Goals live on the dashboard. Projects

    live on the Gantt chart. They connect, but they are not the same thing.