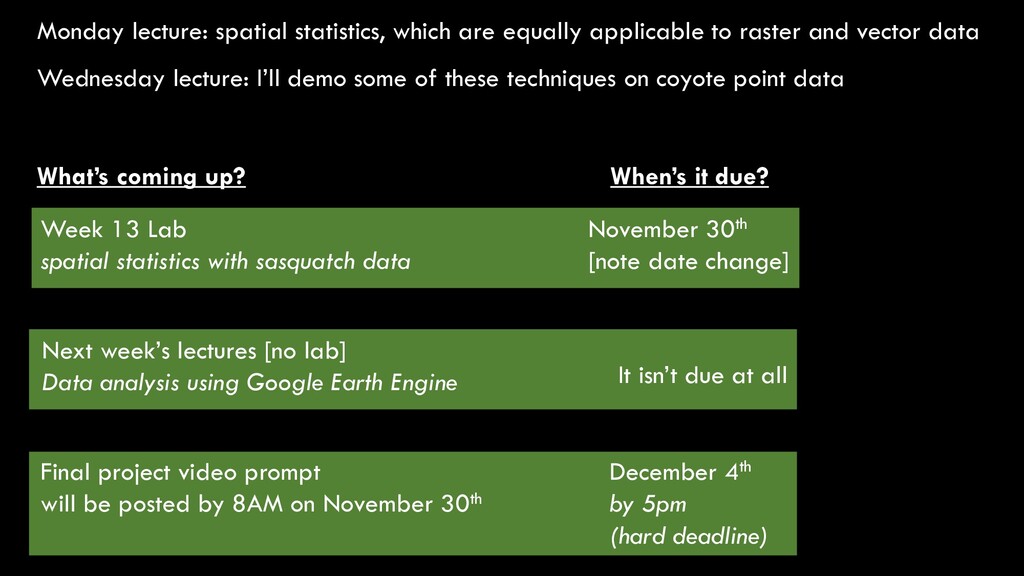
and vector data November 30th [note date change] Week 13 Lab spatial statistics with sasquatch data Final project video prompt will be posted by 8AM on November 30th What’s coming up? When’s it due? Next week’s lectures [no lab] Data analysis using Google Earth Engine December 4th by 5pm (hard deadline) It isn’t due at all Wednesday lecture: I’ll demo some of these techniques on coyote point data
Big Raster Data, Google Earth Engine [no lab this week] In order to use Google Earth Engine, you’ll need to sign up with them. Please do this by the end of this week because if there are problems, we need to fix them! earthengine.google.com/signup You can (and should!) use whatever email address you used to sign up for your Google Site …which is most likely your @fortlewis.edu address They’ll send you an email that you need to confirm, so please don’t forget to do this.
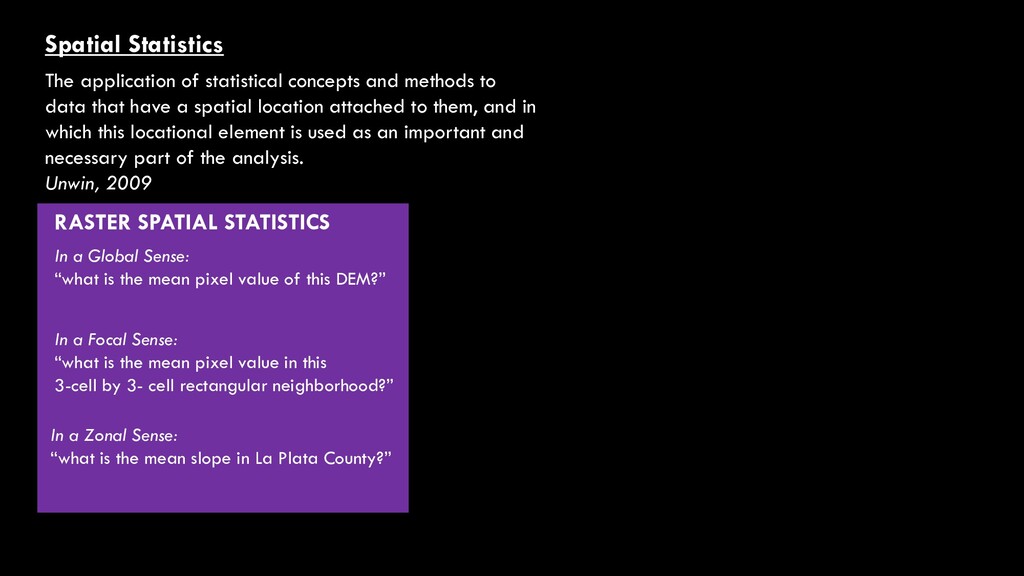
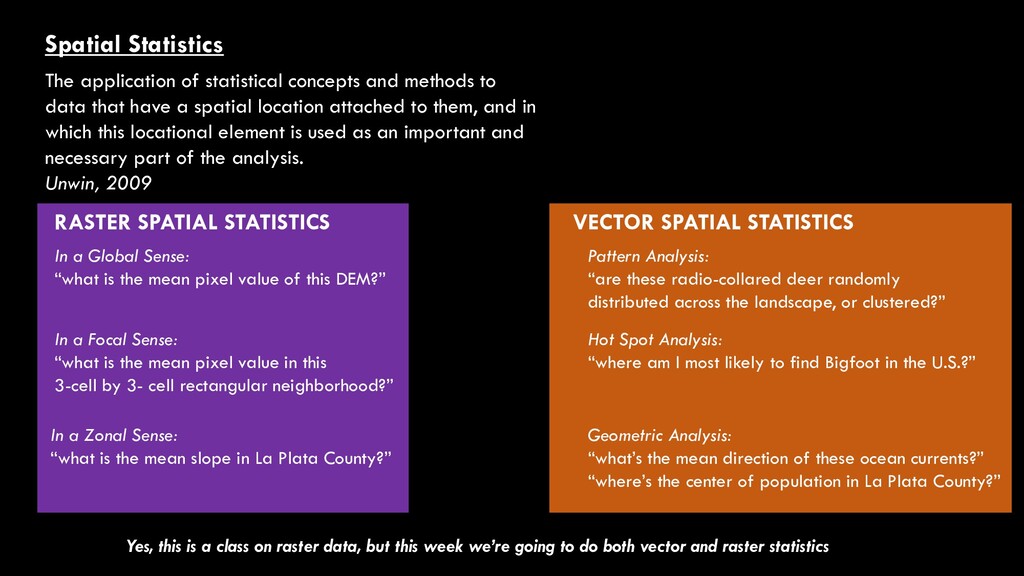
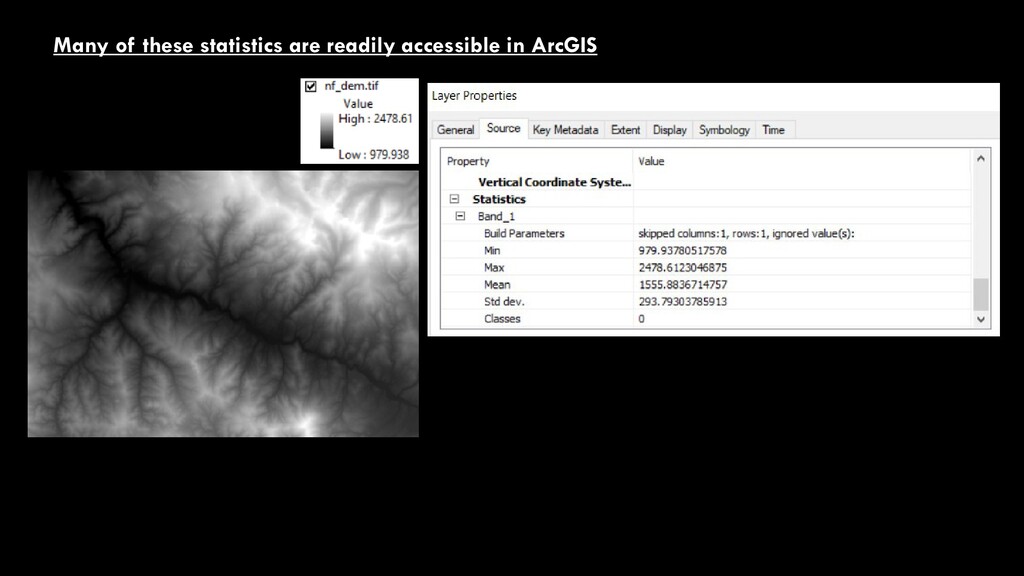
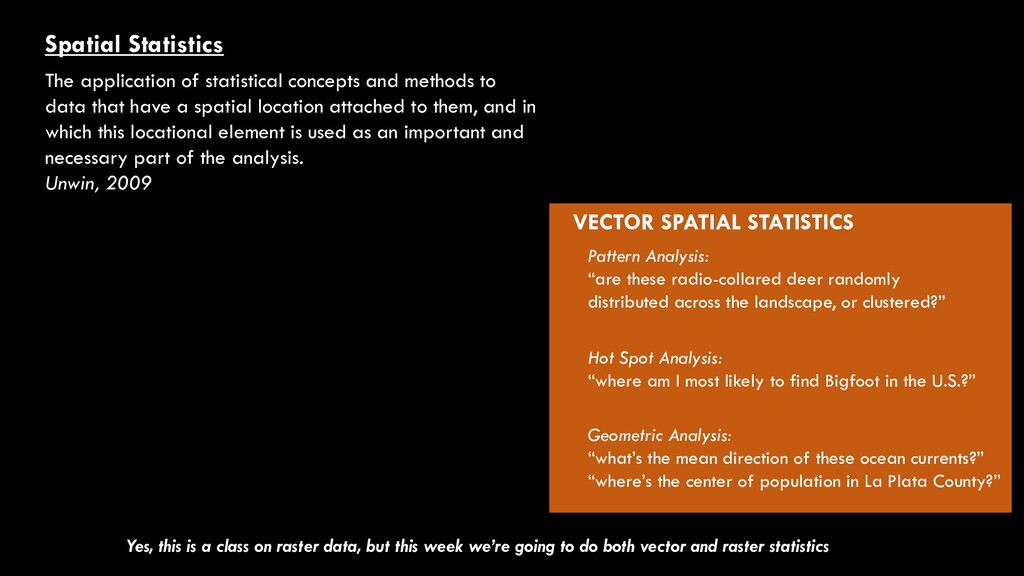
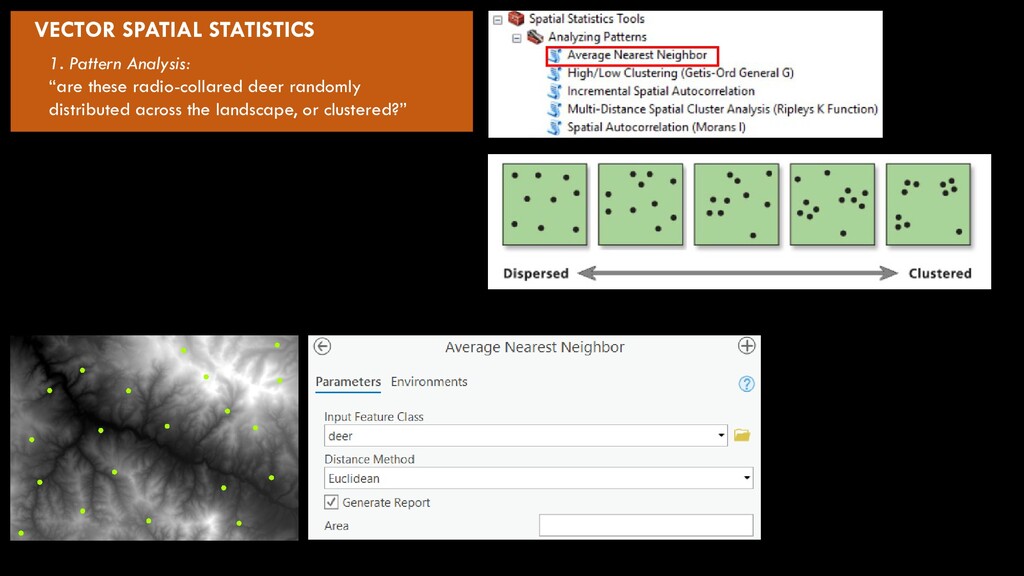
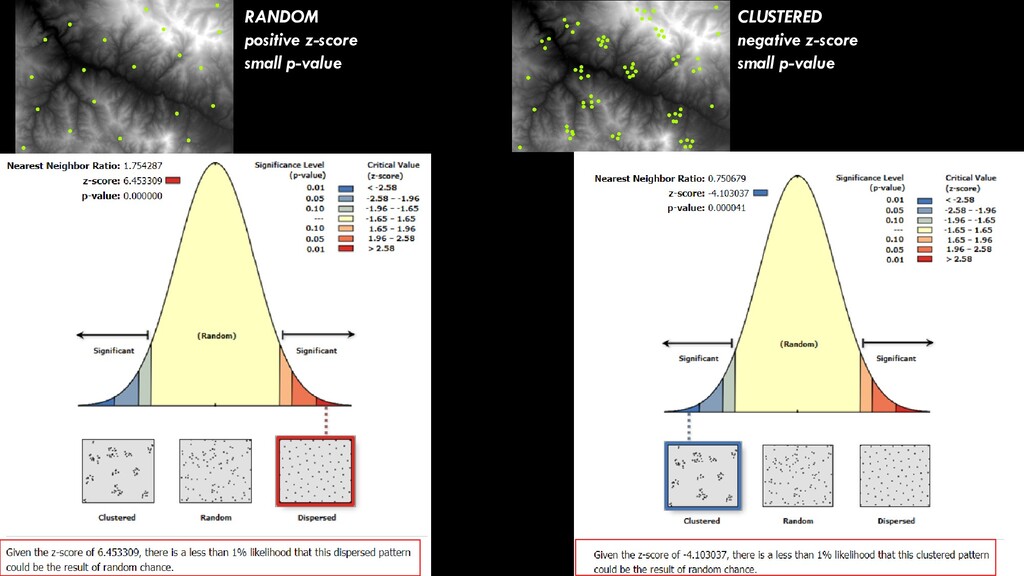
data that have a spatial location attached to them, and in which this locational element is used as an important and necessary part of the analysis. Unwin, 2009 RASTER SPATIAL STATISTICS VECTOR SPATIAL STATISTICS In a Global Sense: “what is the mean pixel value of this DEM?” In a Focal Sense: “what is the mean pixel value in this 3-cell by 3- cell rectangular neighborhood?” In a Zonal Sense: “what is the mean slope in La Plata County?” Pattern Analysis: “are these radio-collared deer randomly distributed across the landscape, or clustered?” Hot Spot Analysis: “where am I most likely to find Bigfoot in the U.S.?” Geometric Analysis: “what’s the mean direction of these ocean currents?” “where’s the center of population in La Plata County?”
data that have a spatial location attached to them, and in which this locational element is used as an important and necessary part of the analysis. Unwin, 2009 RASTER SPATIAL STATISTICS VECTOR SPATIAL STATISTICS In a Global Sense: “what is the mean pixel value of this DEM?” In a Focal Sense: “what is the mean pixel value in this 3-cell by 3- cell rectangular neighborhood?” In a Zonal Sense: “what is the mean slope in La Plata County?” Pattern Analysis: “are these radio-collared deer randomly distributed across the landscape, or clustered?” Hot Spot Analysis: “where am I most likely to find Bigfoot in the U.S.?” Geometric Analysis: “what’s the mean direction of these ocean currents?” “where’s the center of population in La Plata County?” Yes, this is a class on raster data, but this week we’re going to do both vector and raster statistics
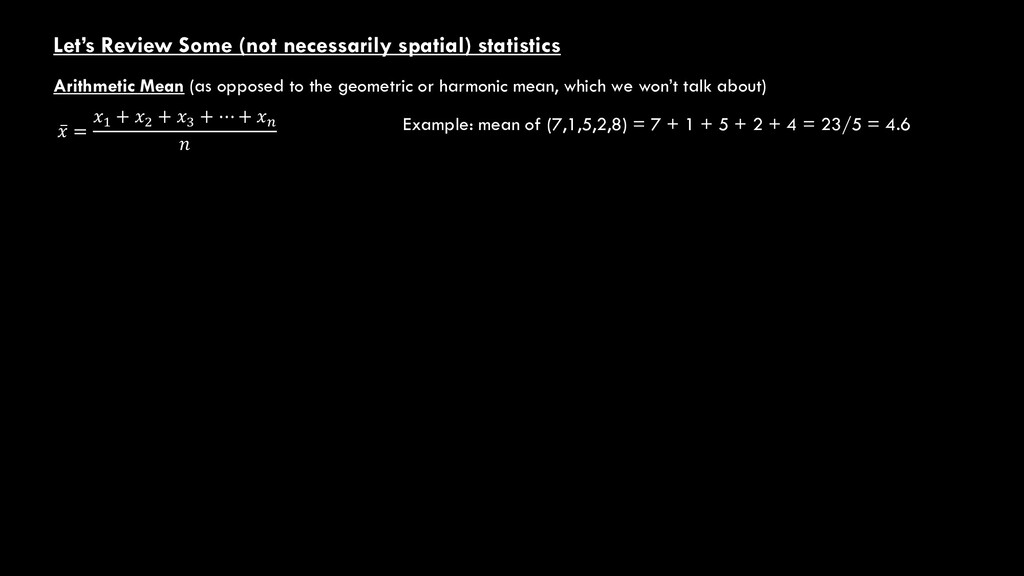
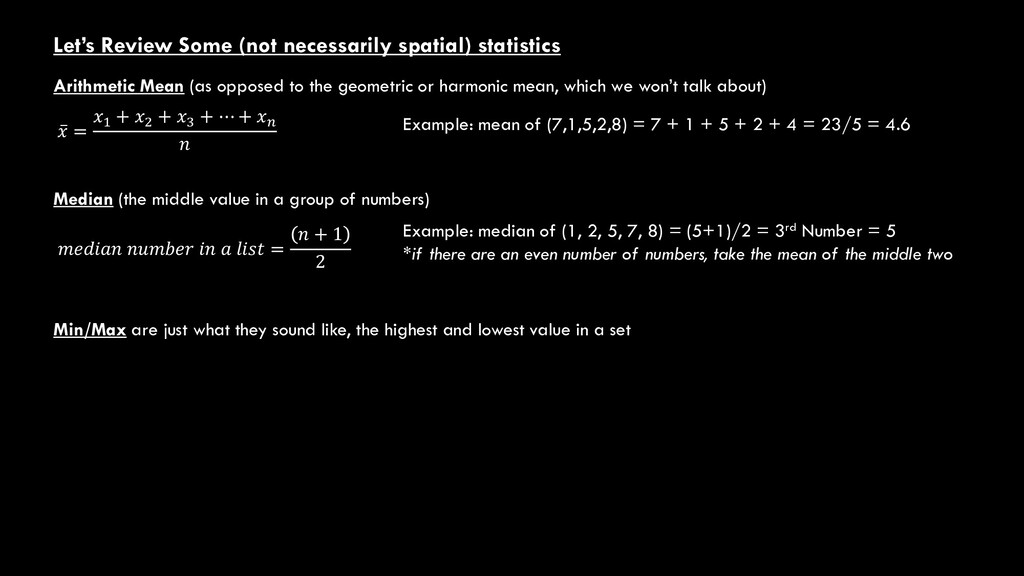
opposed to the geometric or harmonic mean, which we won’t talk about) ̅ = 1 + 2 + 3 + ⋯ + Example: mean of (7,1,5,2,8) = 7 + 1 + 5 + 2 + 8 = 23/5 = 4.6 Median (the middle value in a group of numbers) 𝑚𝑚 𝑛𝑛𝑛𝑛 𝑖𝑖𝑖𝑖 𝑎𝑎 𝑙𝑙 = + 1 2 Example: median of (1, 2, 5, 7, 8) = (5+1)/2 = 3rd Number = 5 *if there are an even number of numbers, take the mean of the middle two
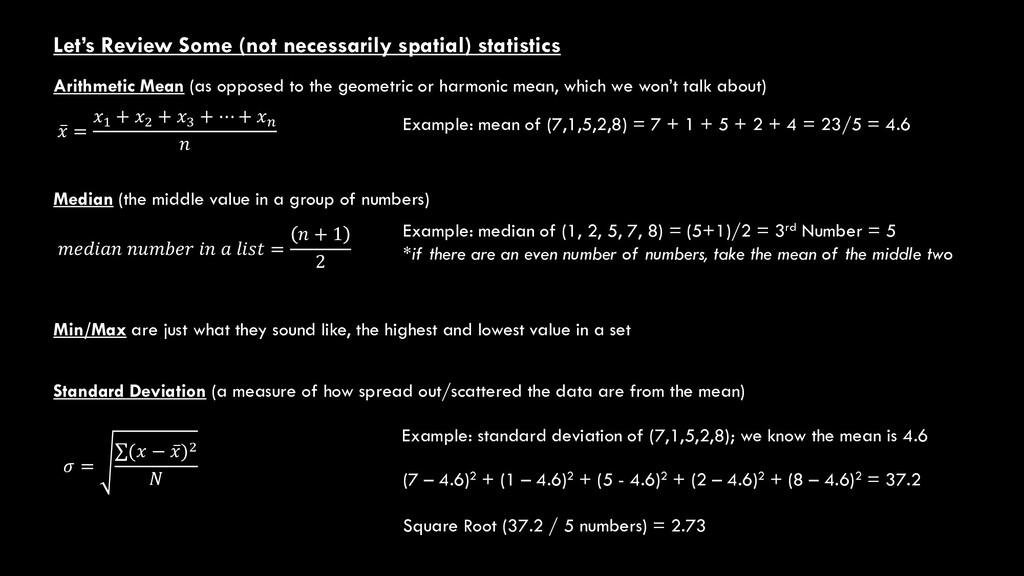
opposed to the geometric or harmonic mean, which we won’t talk about) ̅ = 1 + 2 + 3 + ⋯ + Example: mean of (7,1,5,2,8) = 7 + 1 + 5 + 2 + 4 = 23/5 = 4.6 Median (the middle value in a group of numbers) 𝑚𝑚 𝑛𝑛𝑛𝑛 𝑖𝑖𝑖𝑖 𝑎𝑎 𝑙𝑙 = + 1 2 Example: median of (1, 2, 5, 7, 8) = (5+1)/2 = 3rd Number = 5 *if there are an even number of numbers, take the mean of the middle two Min/Max are just what they sound like, the highest and lowest value in a set
opposed to the geometric or harmonic mean, which we won’t talk about) ̅ = 1 + 2 + 3 + ⋯ + Example: mean of (7,1,5,2,8) = 7 + 1 + 5 + 2 + 4 = 23/5 = 4.6 Median (the middle value in a group of numbers) 𝑚𝑚 𝑛𝑛𝑛𝑛 𝑖𝑖𝑖𝑖 𝑎𝑎 𝑙𝑙 = + 1 2 Example: median of (1, 2, 5, 7, 8) = (5+1)/2 = 3rd Number = 5 *if there are an even number of numbers, take the mean of the middle two Min/Max are just what they sound like, the highest and lowest value in a set Standard Deviation (a measure of how spread out/scattered the data are from the mean) = ∑( − ̅ )2 Example: standard deviation of (7,1,5,2,8); we know the mean is 4.6 (7 – 4.6)2 + (1 – 4.6)2 + (5 - 4.6)2 + (2 – 4.6)2 + (8 – 4.6)2 = 37.2 Square Root (37.2 / 5 numbers) = 2.73
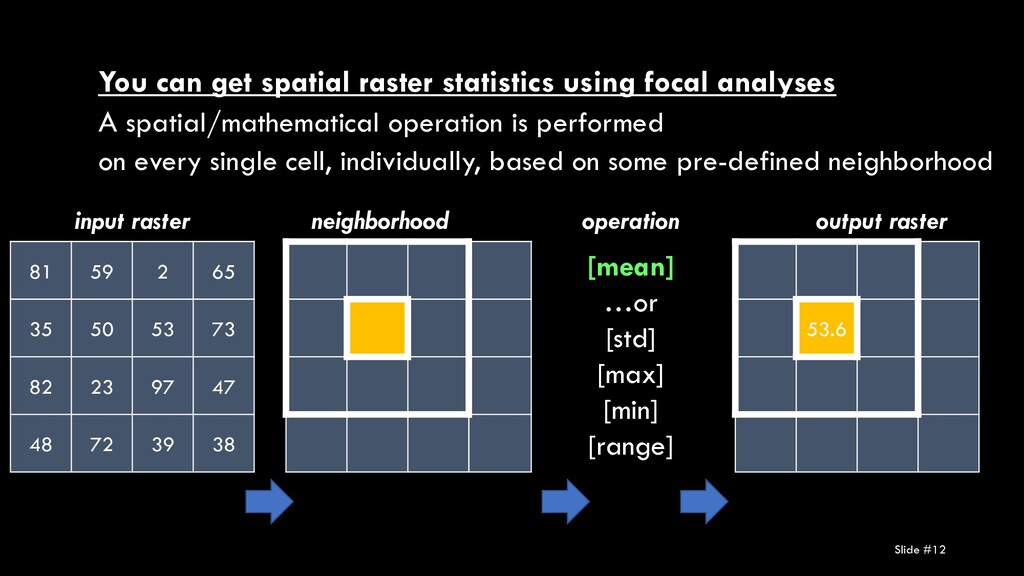
82 23 97 47 48 72 39 38 input raster operation [mean] …or [std] [max] [min] [range] output raster 53.6 neighborhood You can get spatial raster statistics using focal analyses A spatial/mathematical operation is performed on every single cell, individually, based on some pre-defined neighborhood
can get spatial raster statistics using zonal analyses A spatial/mathematical operation is performed on groups of cells at the same time, based on some pre-defined neighborhood input raster operation output raster neighborhood 81 59 2 65 35 50 53 73 82 23 97 47 48 72 39 38 [mean] …or [std] [max] [min] [range]
data that have a spatial location attached to them, and in which this locational element is used as an important and necessary part of the analysis. Unwin, 2009 RASTER SPATIAL STATISTICS VECTOR SPATIAL STATISTICS In a Global Sense: “what is the mean pixel value of this DEM?” In a Focal Sense: “what is the mean pixel value in this 3-cell by 3- cell rectangular neighborhood?” In a Zonal Sense: “what is the mean slope in La Plata County?” Pattern Analysis: “are these radio-collared deer randomly distributed across the landscape, or clustered?” Hot Spot Analysis: “where am I most likely to find Bigfoot in the U.S.?” Geometric Analysis: “what’s the mean direction of these ocean currents?” “where’s the center of population in La Plata County?” Yes, this is a class on raster data, but this week we’re going to do both vector and raster statistics
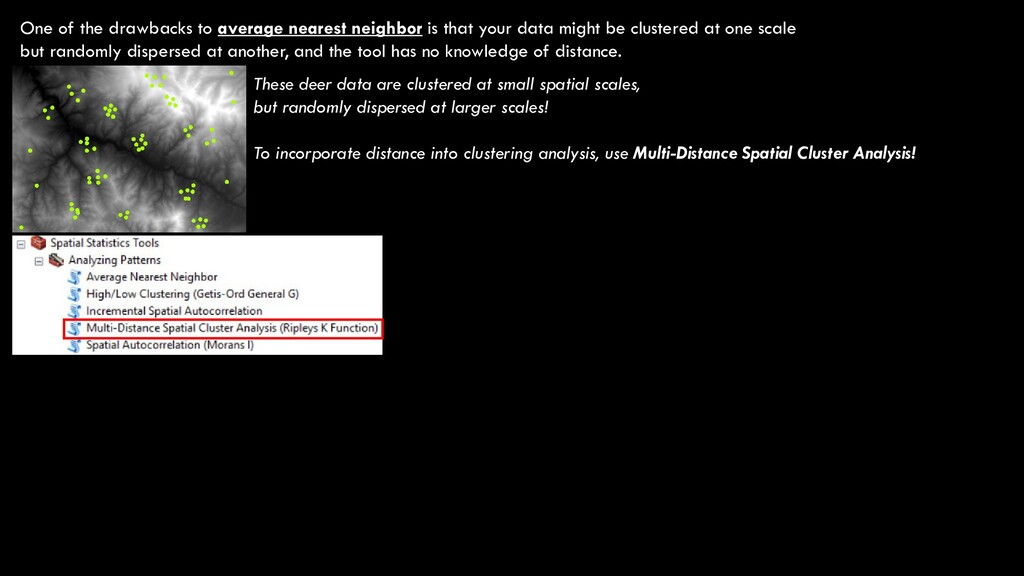
your data might be clustered at one scale but randomly dispersed at another, and the tool has no knowledge of distance. These deer data are clustered at small spatial scales, but randomly dispersed at larger scales! To incorporate distance into clustering analysis, use Multi-Distance Spatial Cluster Analysis!
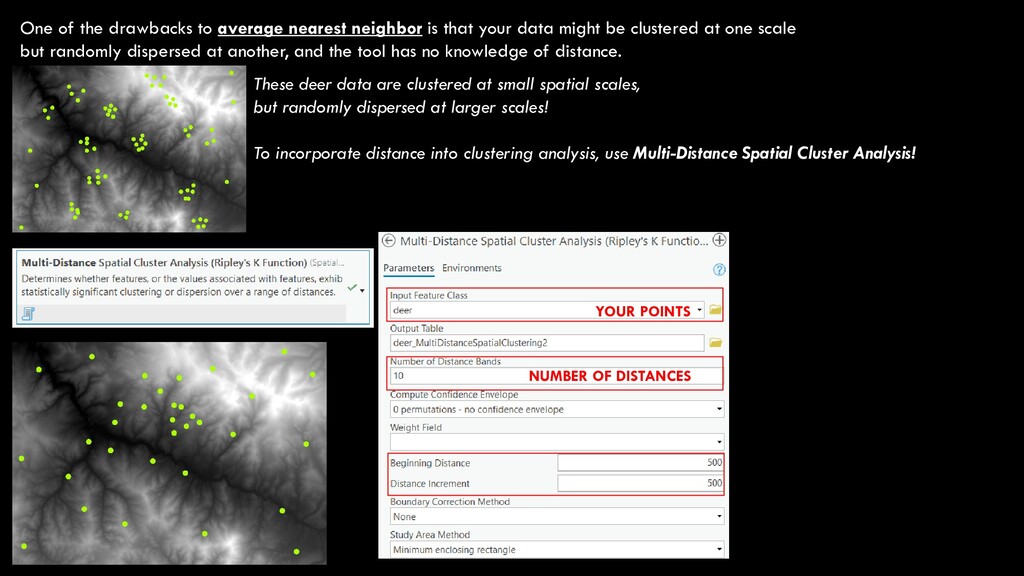
your data might be clustered at one scale but randomly dispersed at another, and the tool has no knowledge of distance. These deer data are clustered at small spatial scales, but randomly dispersed at larger scales! To incorporate distance into clustering analysis, use Multi-Distance Spatial Cluster Analysis! YOUR POINTS NUMBER OF DISTANCES
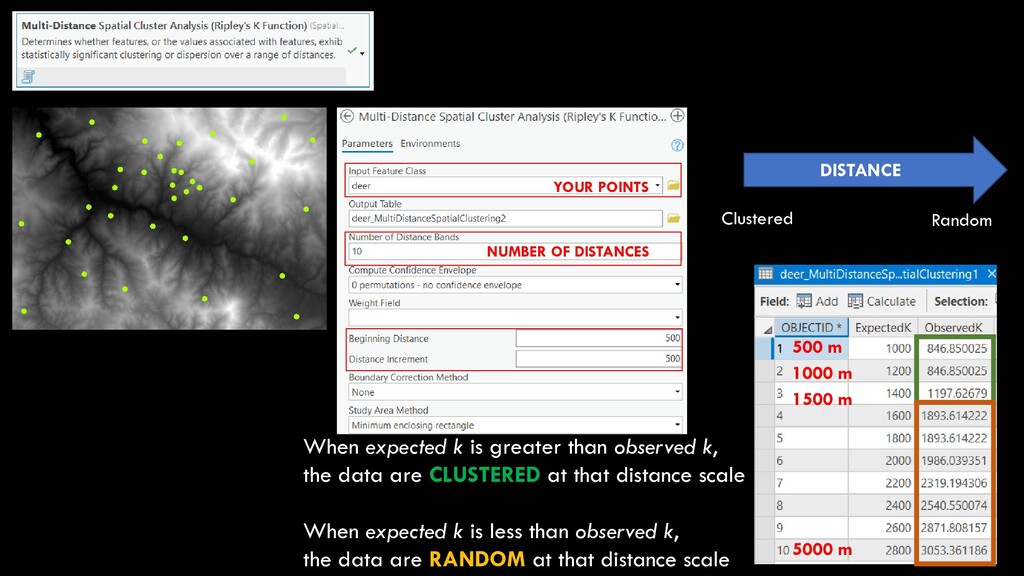
m 5000 m When expected k is greater than observed k, the data are CLUSTERED at that distance scale When expected k is less than observed k, the data are RANDOM at that distance scale DISTANCE Clustered Random
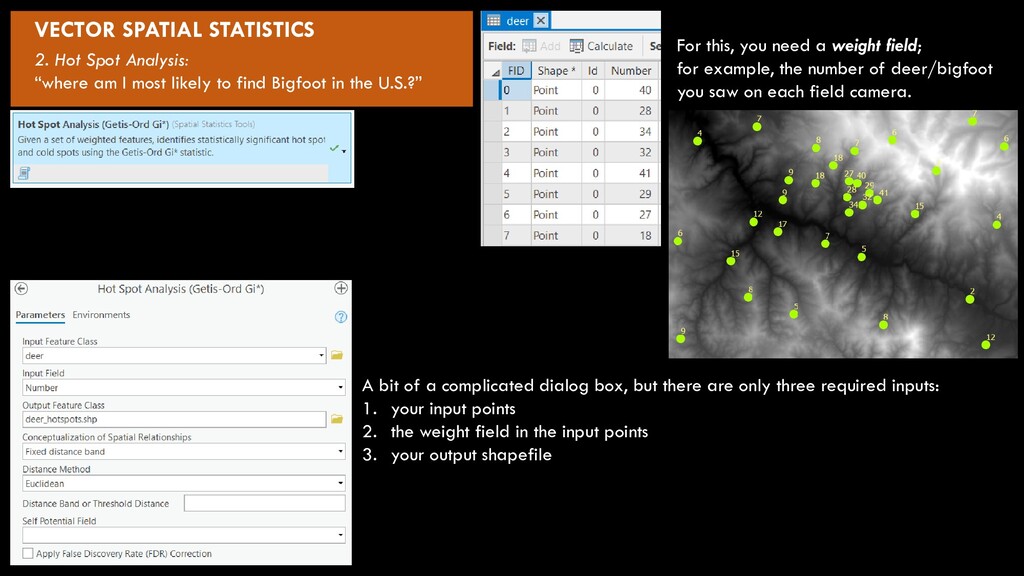
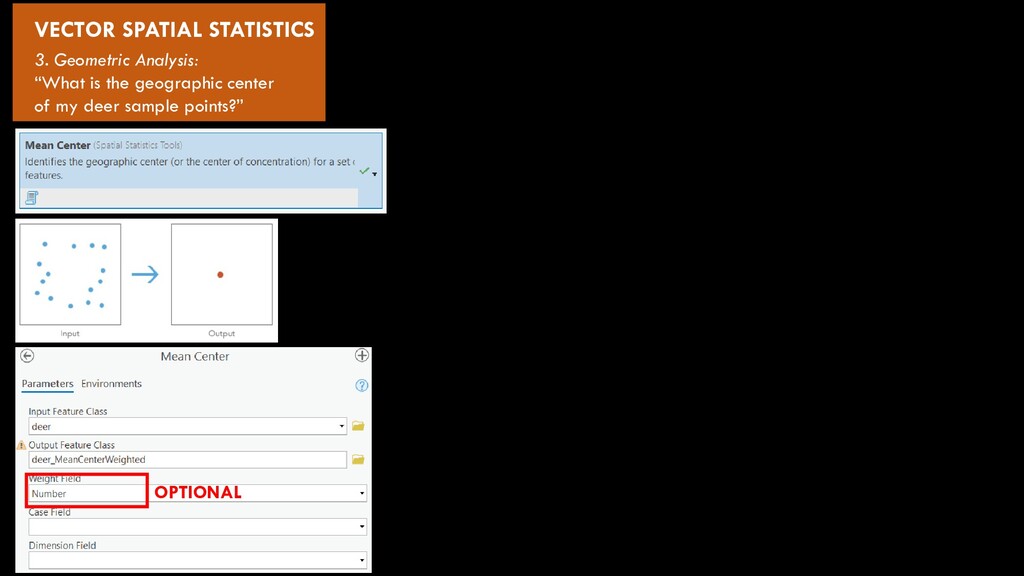
most likely to find Bigfoot in the U.S.?” For this, you need a weight field; for example, the number of deer/bigfoot you saw on each field camera. A bit of a complicated dialog box, but there are only three required inputs: 1. your input points 2. the weight field in the input points 3. your output shapefile
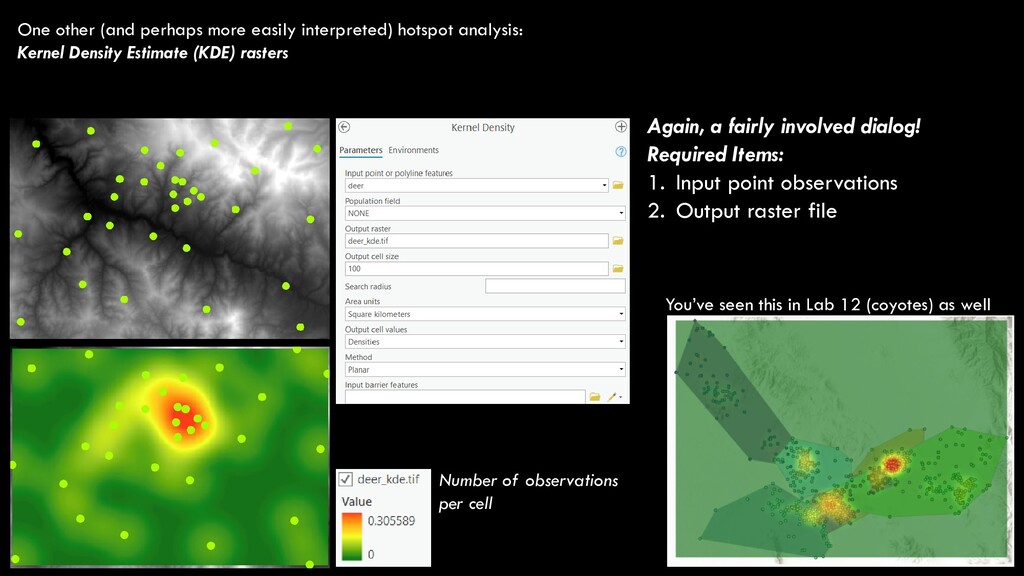
Density Estimate (KDE) rasters Again, a fairly involved dialog! Required Items: 1. Input point observations 2. Output raster file You’ve seen this in Lab 12 (coyotes) as well Number of observations per cell
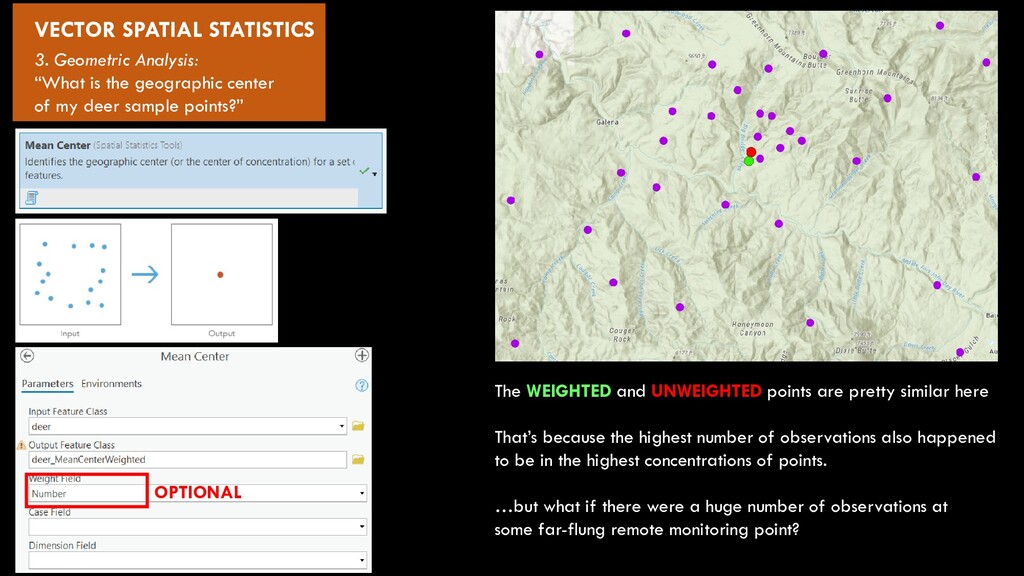
center of my deer sample points?” The WEIGHTED and UNWEIGHTED points are pretty similar here That’s because the highest number of observations also happened to be in the highest concentrations of points. …but what if there were a huge number of observations at some far-flung remote monitoring point? OPTIONAL