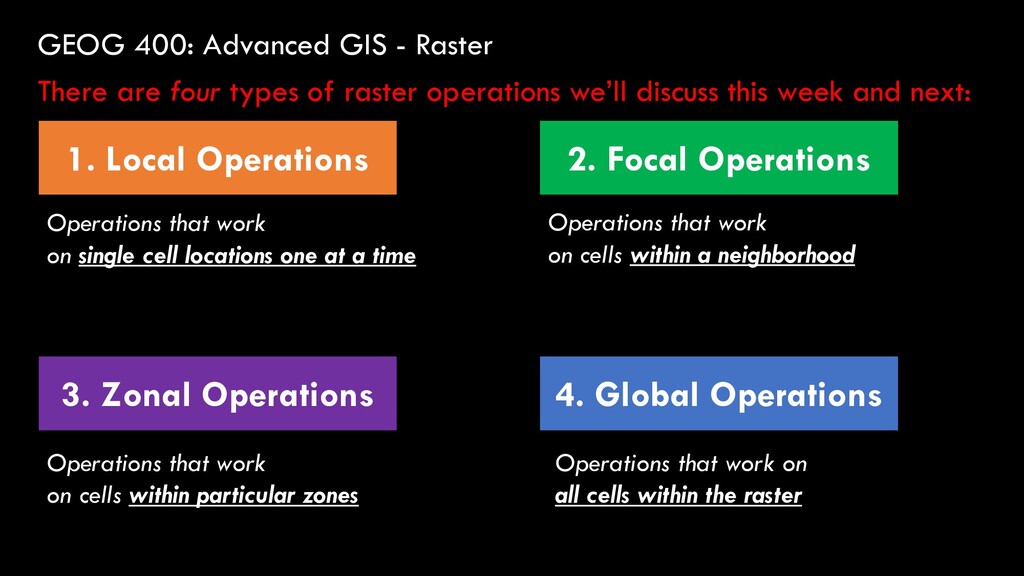
Global Operations 2. Focal Operations 3. Zonal Operations There are four types of raster operations we’ll discuss this week and next: Operations that work on single cell locations one at a time Operations that work on cells within a neighborhood Operations that work on cells within particular zones Operations that work on all cells within the raster
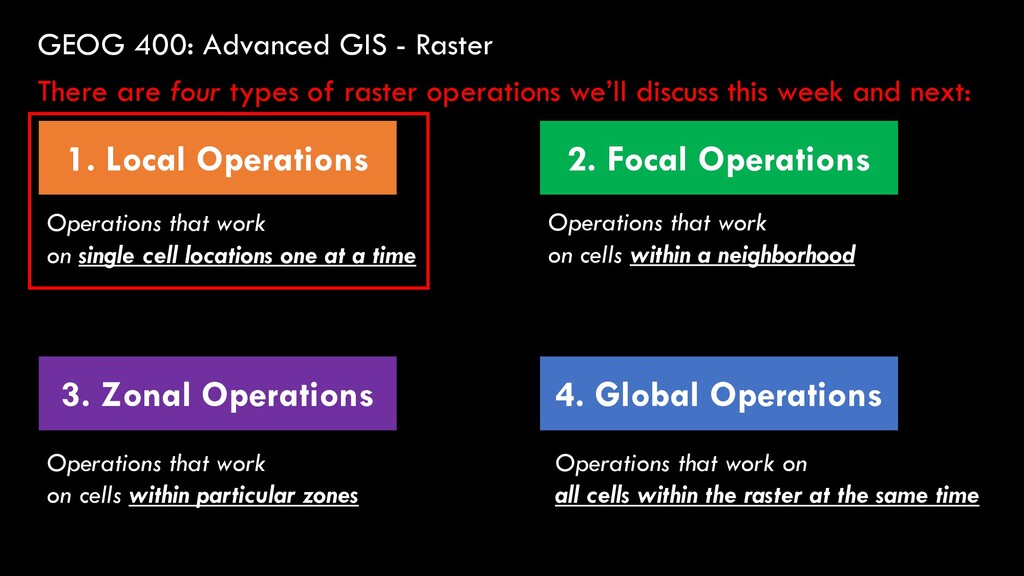
Global Operations 2. Focal Operations 3. Zonal Operations There are four types of raster operations we’ll discuss this week and next: Operations that work on single cell locations one at a time Operations that work on cells within a neighborhood Operations that work on cells within particular zones Operations that work on all cells within the raster at the same time
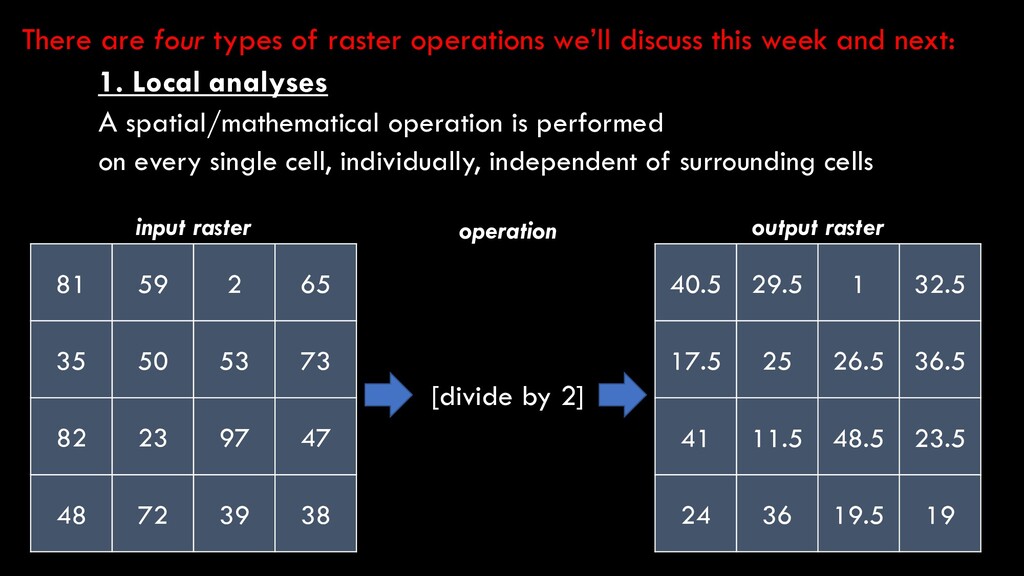
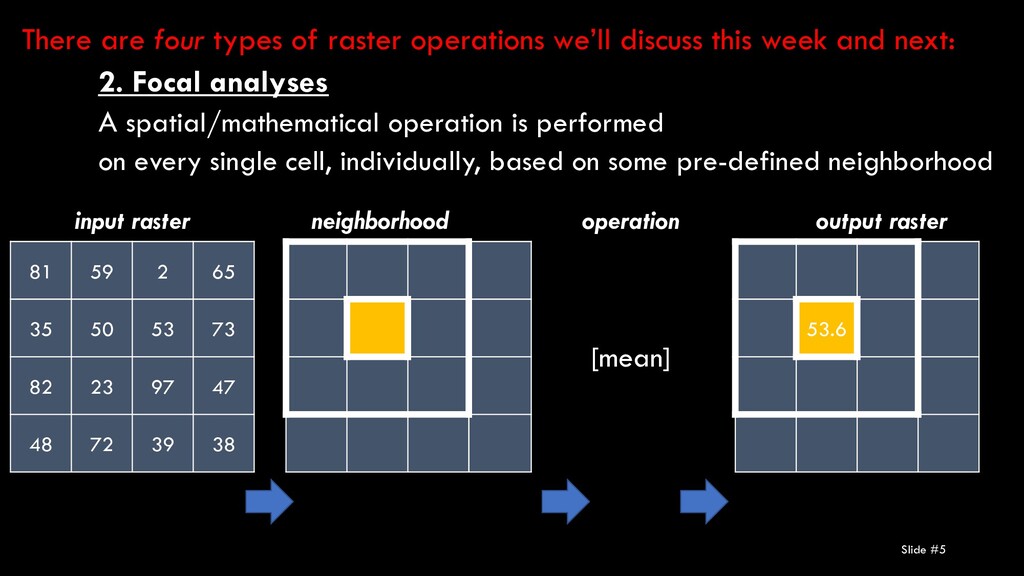
82 23 97 47 48 72 39 38 input raster operation [mean] output raster 53.6 neighborhood 2. Focal analyses A spatial/mathematical operation is performed on every single cell, individually, based on some pre-defined neighborhood There are four types of raster operations we’ll discuss this week and next:
are one of the unique strengths of raster data • It’s not that you can’t do focal analysis using vector data, but because of the gridded structure of raster data and the resultant inherent topology of raster data, focal analyses are computationally simple in a raster environment
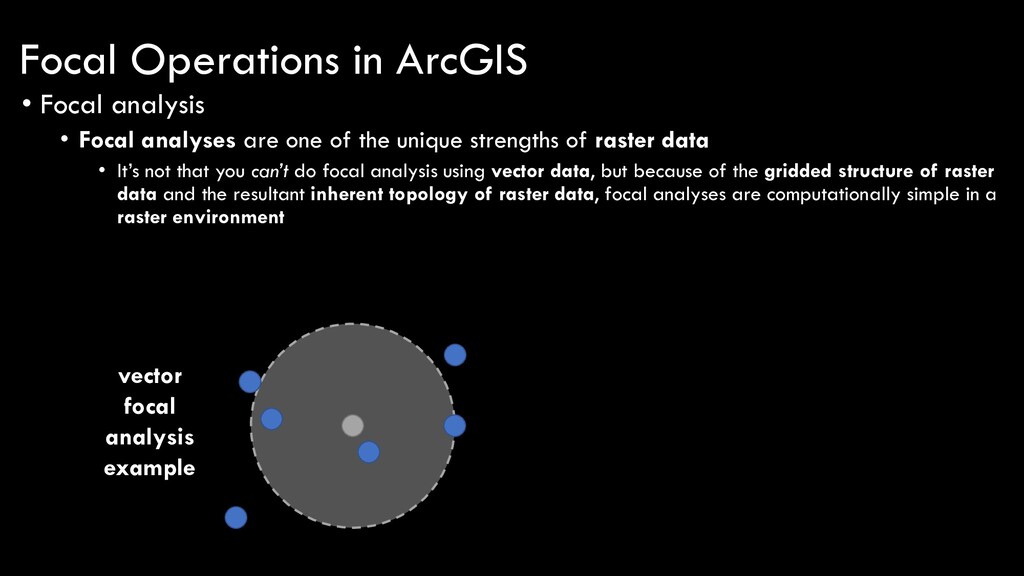
are one of the unique strengths of raster data • It’s not that you can’t do focal analysis using vector data, but because of the gridded structure of raster data and the resultant inherent topology of raster data, focal analyses are computationally simple in a raster environment vector focal analysis example
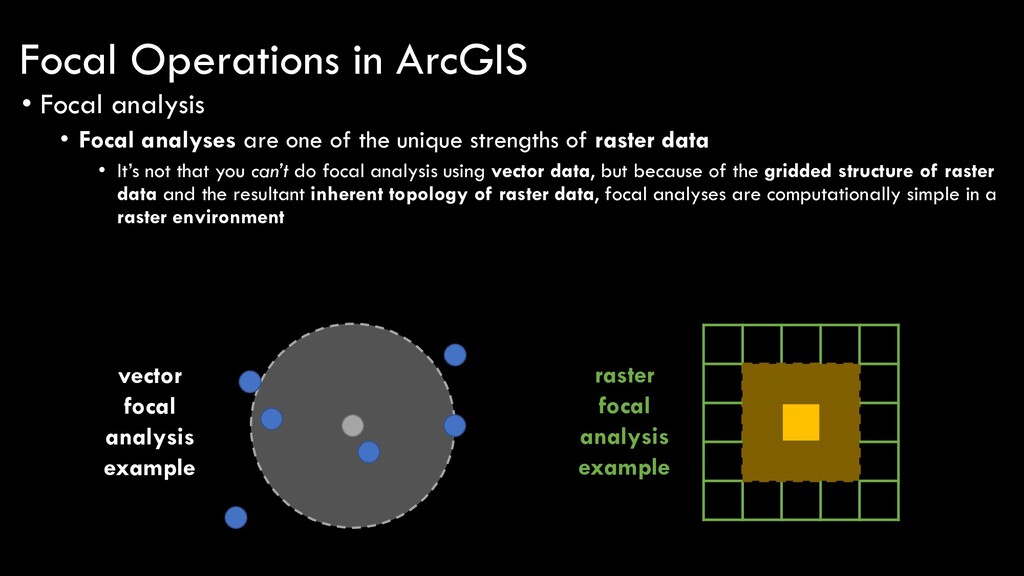
are one of the unique strengths of raster data • It’s not that you can’t do focal analysis using vector data, but because of the gridded structure of raster data and the resultant inherent topology of raster data, focal analyses are computationally simple in a raster environment vector focal analysis example raster focal analysis example
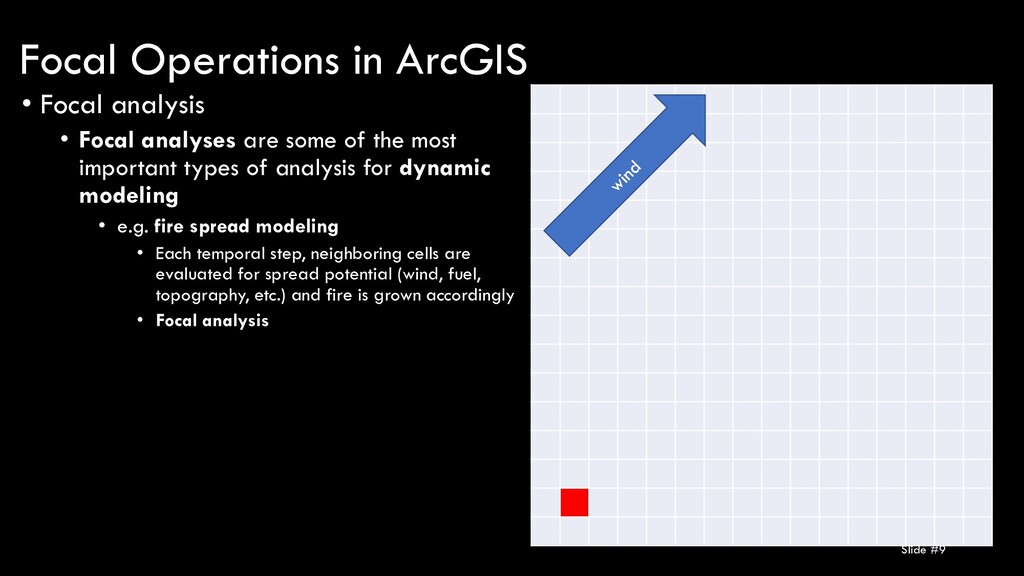
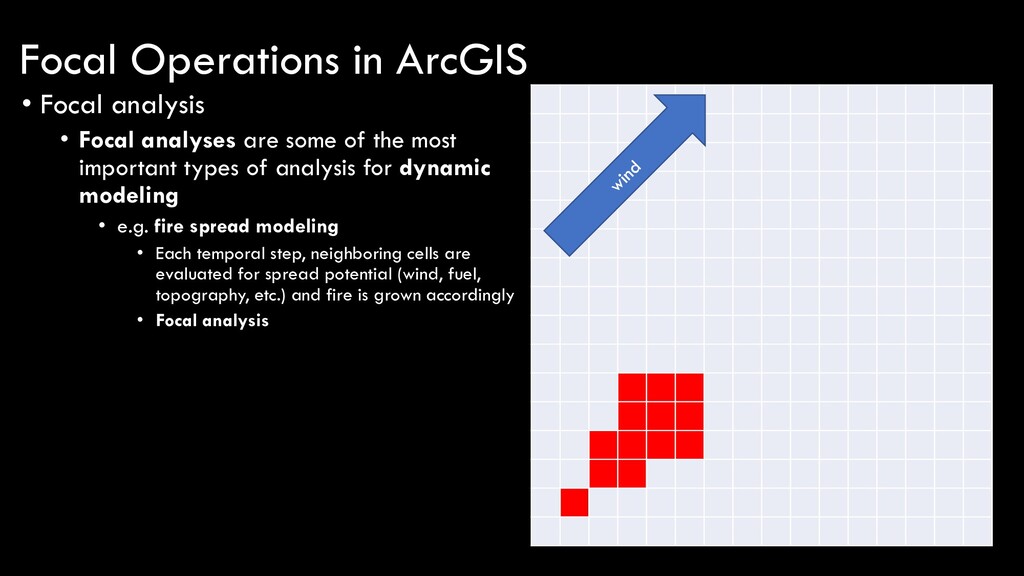
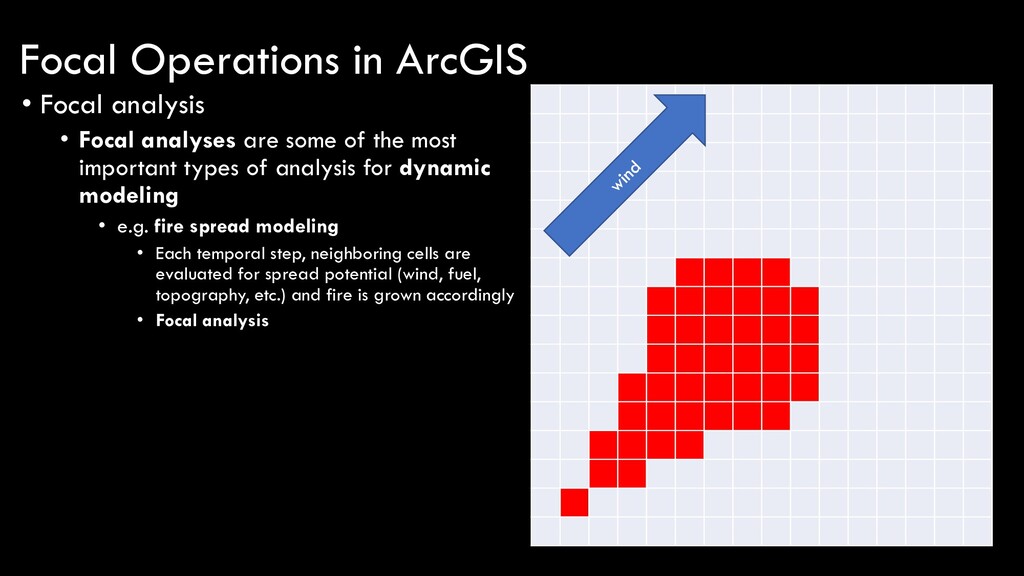
most important types of analysis for dynamic modeling • e.g. fire spread modeling • Each temporal step, neighboring cells are evaluated for spread potential (wind, fuel, topography, etc.) and fire is grown accordingly • Focal analysis Slide #9 Focal Operations in ArcGIS
most important types of analysis for dynamic modeling • e.g. fire spread modeling • Each temporal step, neighboring cells are evaluated for spread potential (wind, fuel, topography, etc.) and fire is grown accordingly • Focal analysis Focal Operations in ArcGIS
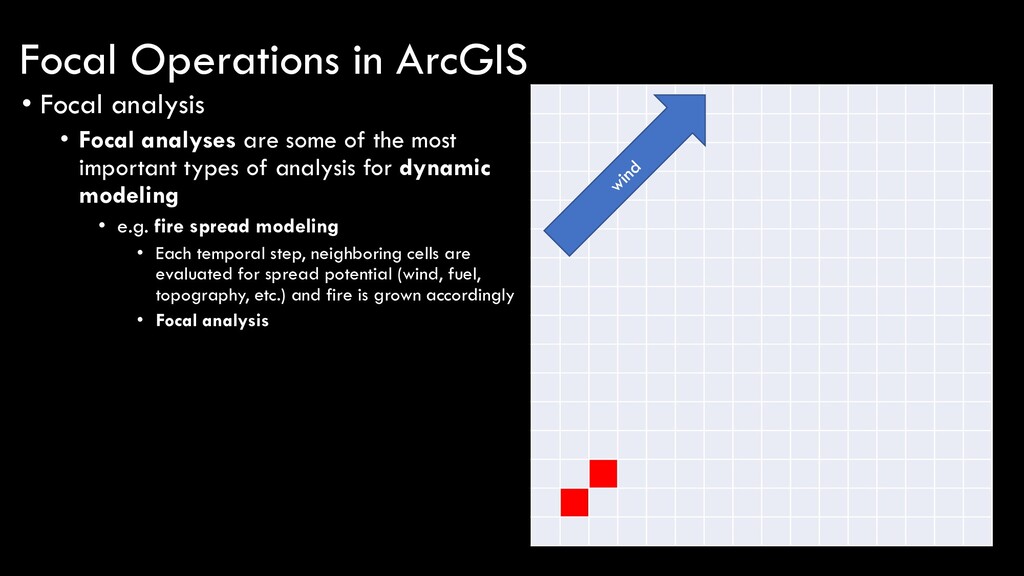
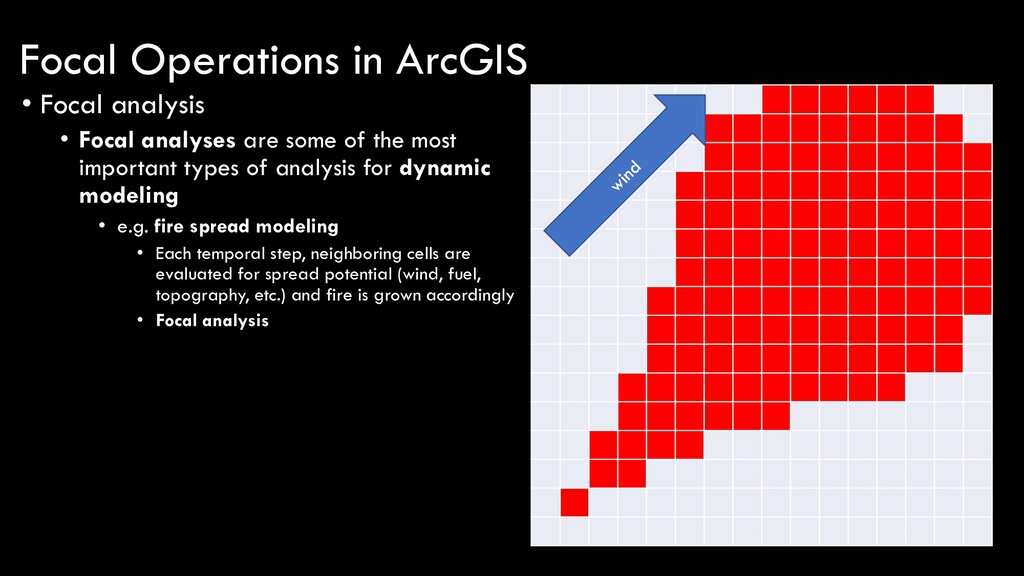
most important types of analysis for dynamic modeling • e.g. fire spread modeling • Each temporal step, neighboring cells are evaluated for spread potential (wind, fuel, topography, etc.) and fire is grown accordingly • Focal analysis Focal Operations in ArcGIS
most important types of analysis for dynamic modeling • e.g. fire spread modeling • Each temporal step, neighboring cells are evaluated for spread potential (wind, fuel, topography, etc.) and fire is grown accordingly • Focal analysis Focal Operations in ArcGIS
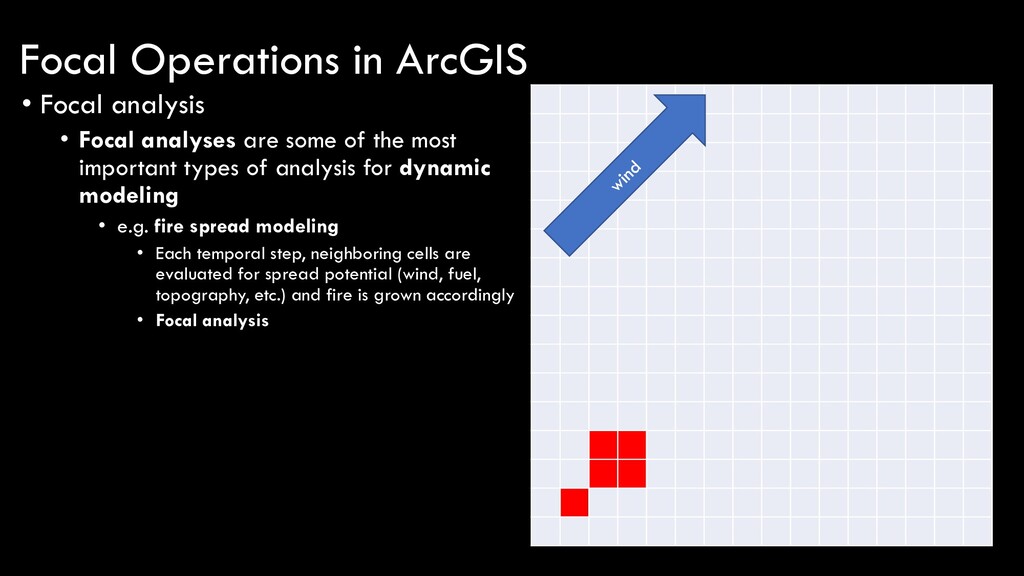
most important types of analysis for dynamic modeling • e.g. fire spread modeling • Each temporal step, neighboring cells are evaluated for spread potential (wind, fuel, topography, etc.) and fire is grown accordingly • Focal analysis Focal Operations in ArcGIS
most important types of analysis for dynamic modeling • e.g. fire spread modeling • Each temporal step, neighboring cells are evaluated for spread potential (wind, fuel, topography, etc.) and fire is grown accordingly • Focal analysis Focal Operations in ArcGIS
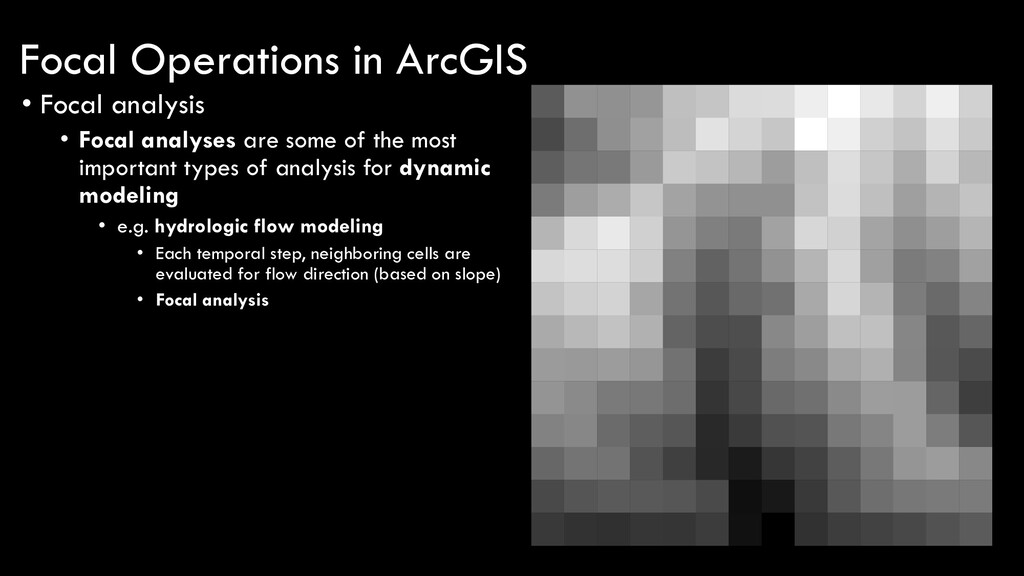
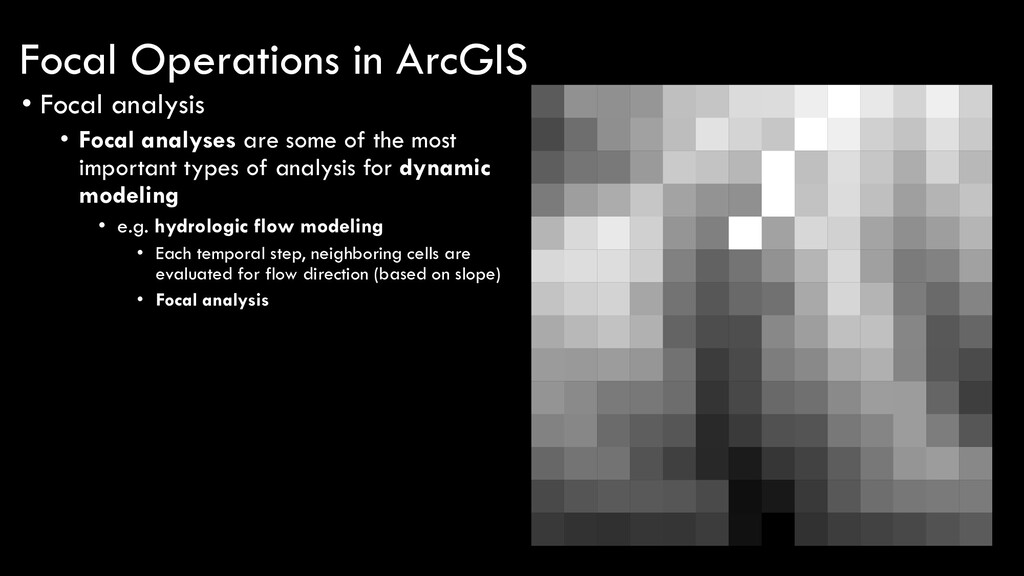
most important types of analysis for dynamic modeling • e.g. hydrologic flow modeling • Each temporal step, neighboring cells are evaluated for flow direction (based on slope) • Focal analysis Focal Operations in ArcGIS
most important types of analysis for dynamic modeling • e.g. hydrologic flow modeling • Each temporal step, neighboring cells are evaluated for flow direction (based on slope) • Focal analysis Focal Operations in ArcGIS
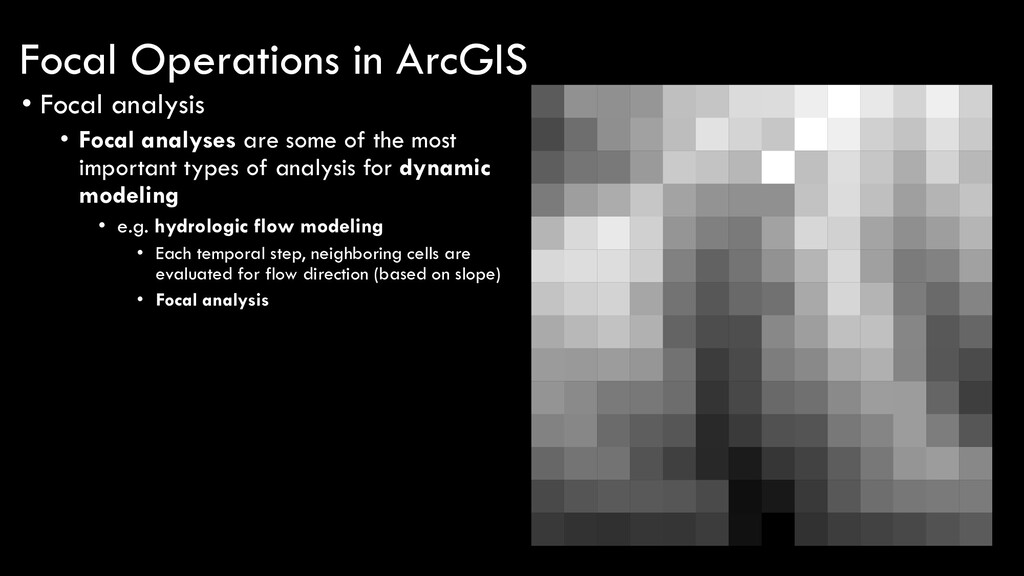
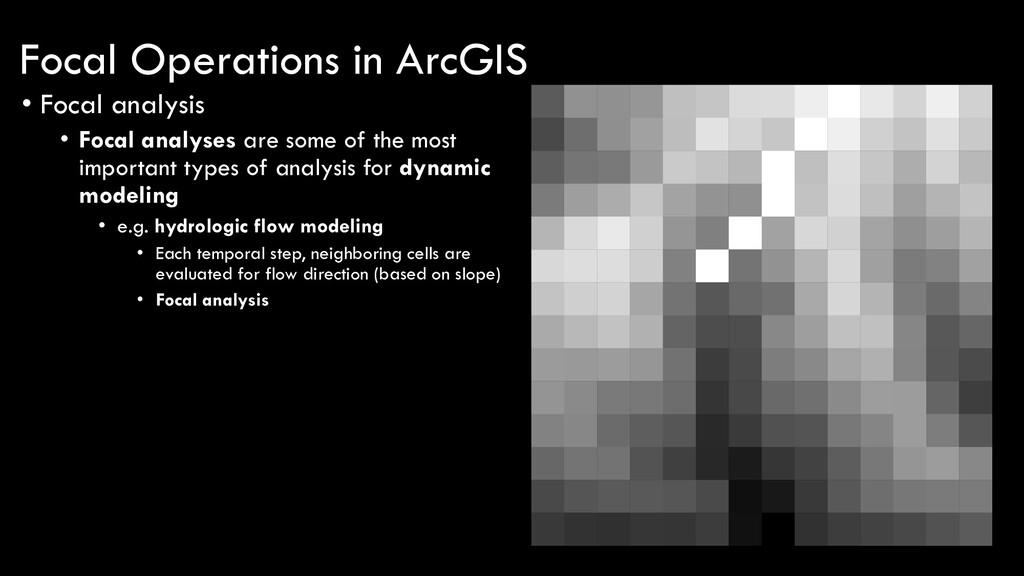
most important types of analysis for dynamic modeling • e.g. hydrologic flow modeling • Each temporal step, neighboring cells are evaluated for flow direction (based on slope) • Focal analysis Focal Operations in ArcGIS
most important types of analysis for dynamic modeling • e.g. hydrologic flow modeling • Each temporal step, neighboring cells are evaluated for flow direction (based on slope) • Focal analysis Focal Operations in ArcGIS
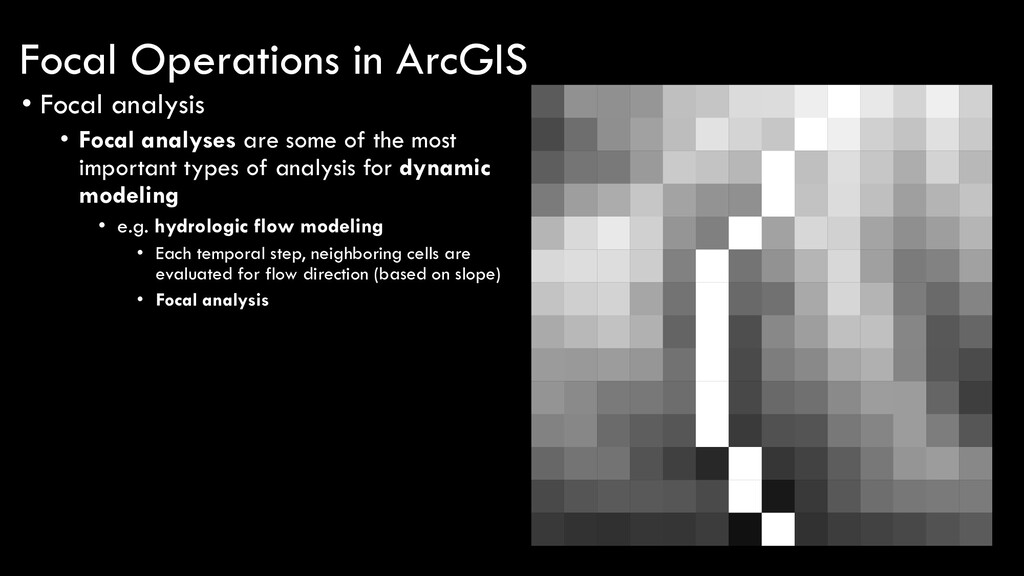
most important types of analysis for dynamic modeling • e.g. hydrologic flow modeling • Each temporal step, neighboring cells are evaluated for flow direction (based on slope) • Focal analysis Focal Operations in ArcGIS
most important types of analysis for dynamic modeling • e.g. hydrologic flow modeling • Each temporal step, neighboring cells are evaluated for flow direction (based on slope) • Focal analysis Focal Operations in ArcGIS
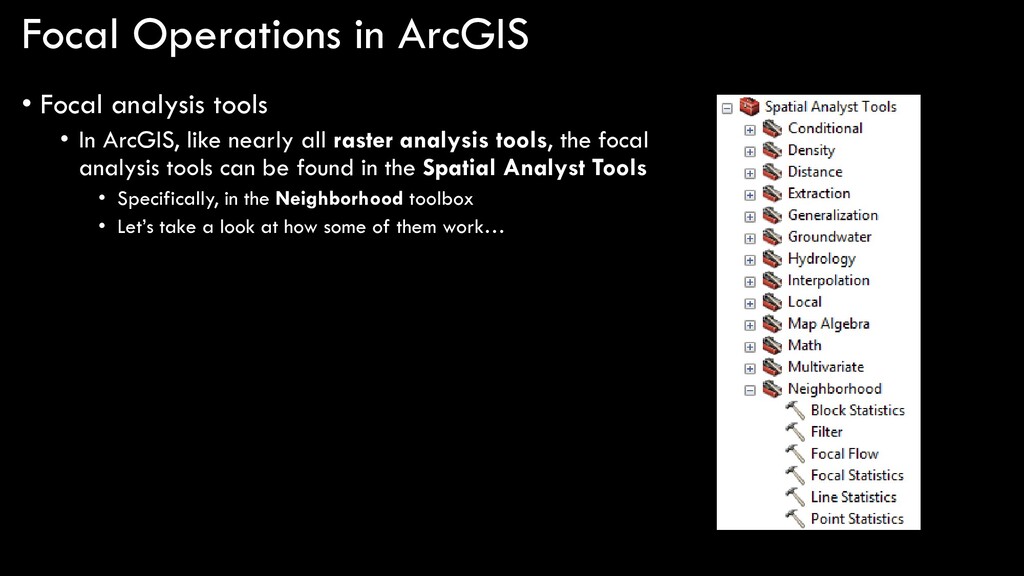
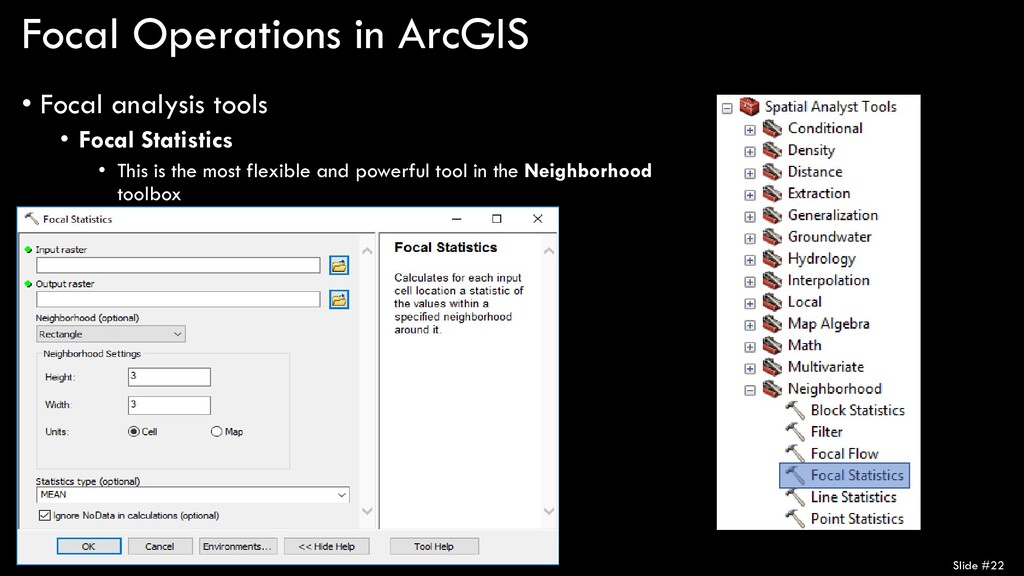
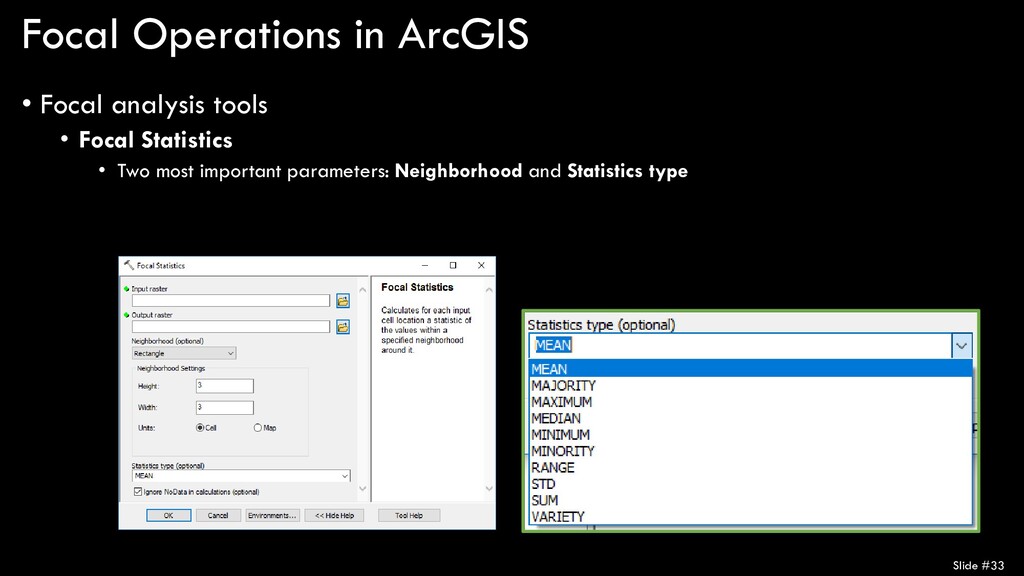
ArcGIS, like nearly all raster analysis tools, the focal analysis tools can be found in the Spatial Analyst Tools • Specifically, in the Neighborhood toolbox • Let’s take a look at how some of them work…
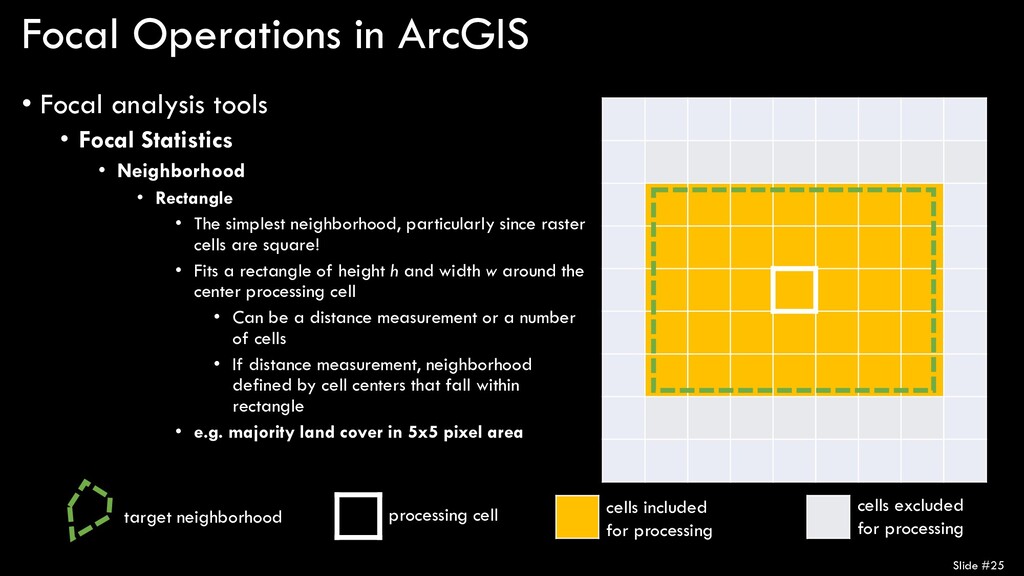
Statistics • Neighborhood • Rectangle • The simplest neighborhood, particularly since raster cells are square! • Fits a rectangle of height h and width w around the center processing cell • Can be a distance measurement or a number of cells • If distance measurement, neighborhood defined by cell centers that fall within rectangle • e.g. majority land cover in 5x5 pixel area Slide #25 processing cell cells included for processing target neighborhood cells excluded for processing
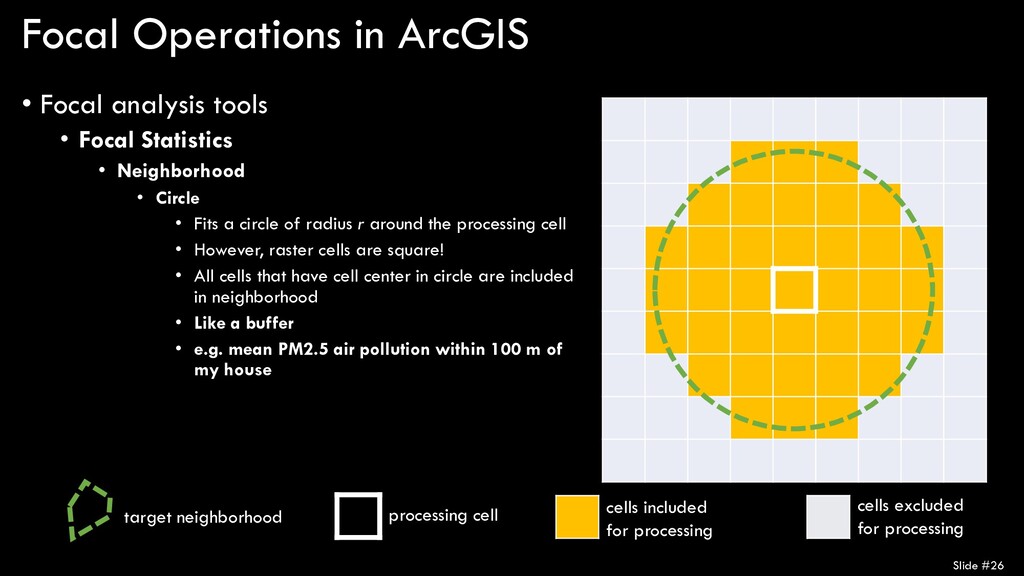
Statistics • Neighborhood • Circle • Fits a circle of radius r around the processing cell • However, raster cells are square! • All cells that have cell center in circle are included in neighborhood • Like a buffer • e.g. mean PM2.5 air pollution within 100 m of my house Slide #26 processing cell cells included for processing target neighborhood cells excluded for processing
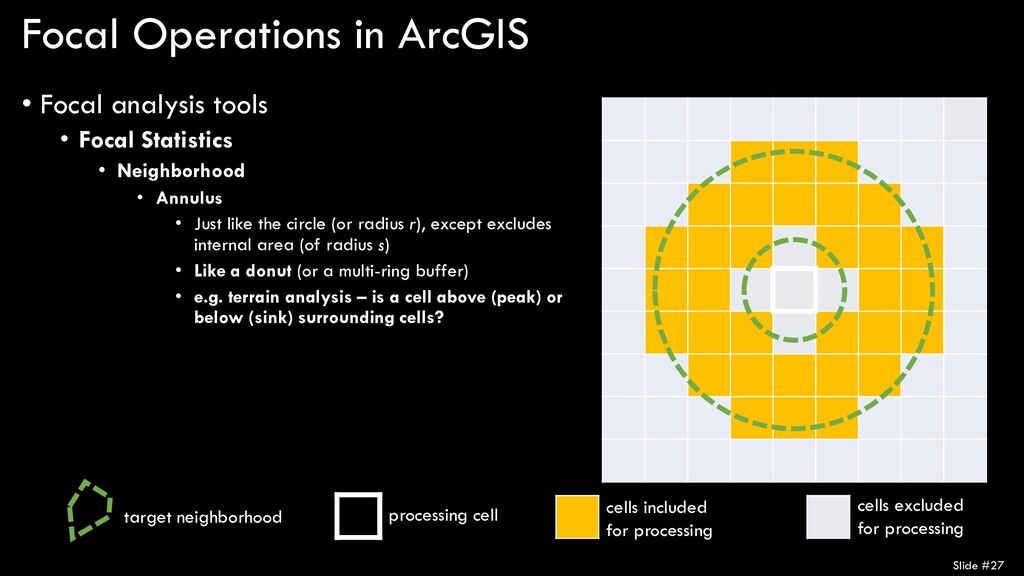
Statistics • Neighborhood • Annulus • Just like the circle (or radius r), except excludes internal area (of radius s) • Like a donut (or a multi-ring buffer) • e.g. terrain analysis – is a cell above (peak) or below (sink) surrounding cells? Slide #27 processing cell cells included for processing target neighborhood cells excluded for processing
Statistics • Neighborhood • Wedge • A unique (and fairly unusual?) case, where you define a wedge neighborhood by a start angle a, and end angle e, and a radius r • e.g. if a fire is burning NW of me within 1 mile, and winds are coming from the NW, evacuate Slide #28 processing cell cells included for processing target neighborhood cells excluded for processing
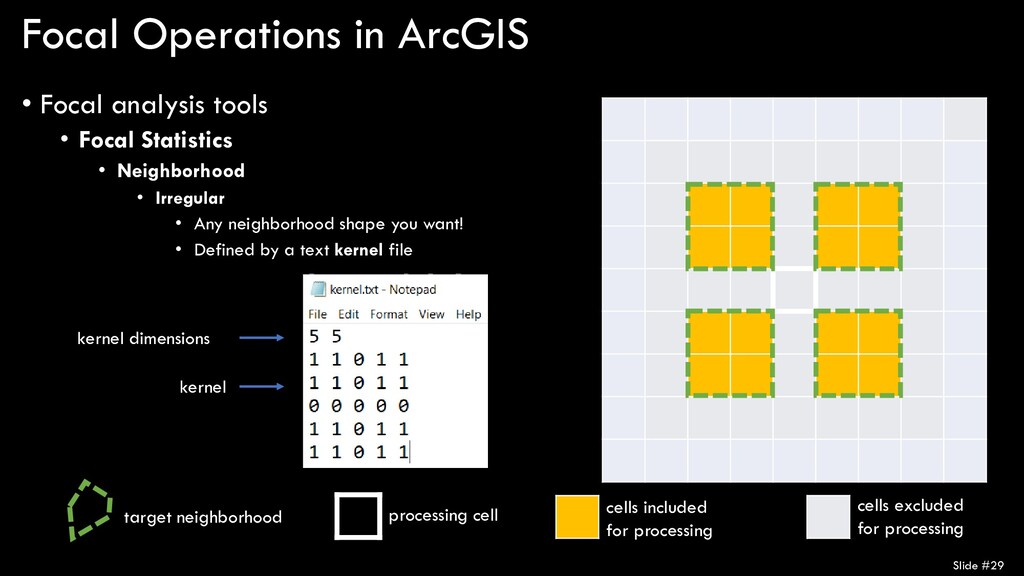
Statistics • Neighborhood • Irregular • Any neighborhood shape you want! • Defined by a text kernel file Slide #29 processing cell cells included for processing target neighborhood cells excluded for processing kernel dimensions kernel
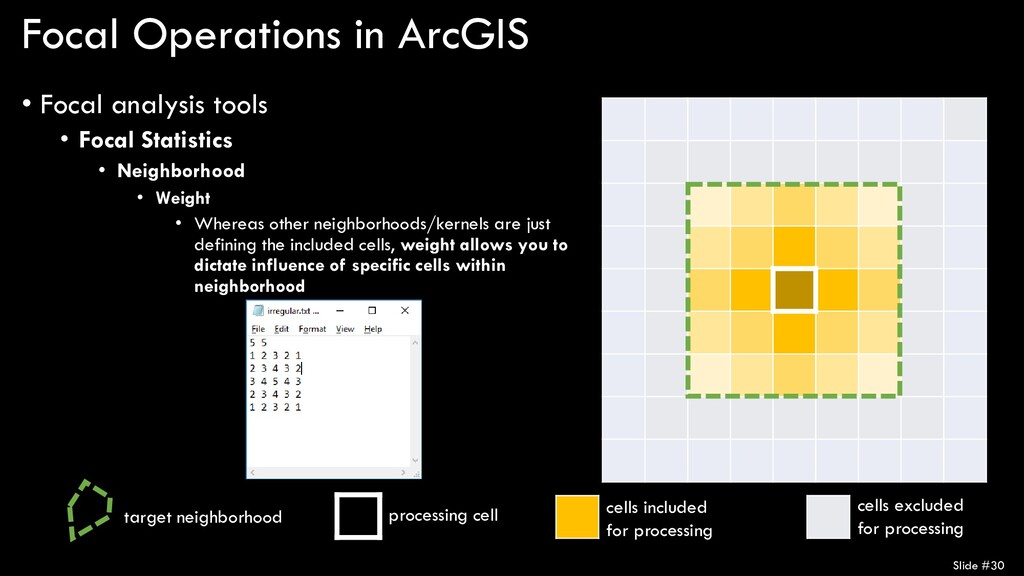
Statistics • Neighborhood • Weight • Whereas other neighborhoods/kernels are just defining the included cells, weight allows you to dictate influence of specific cells within neighborhood Slide #30 processing cell cells included for processing target neighborhood cells excluded for processing
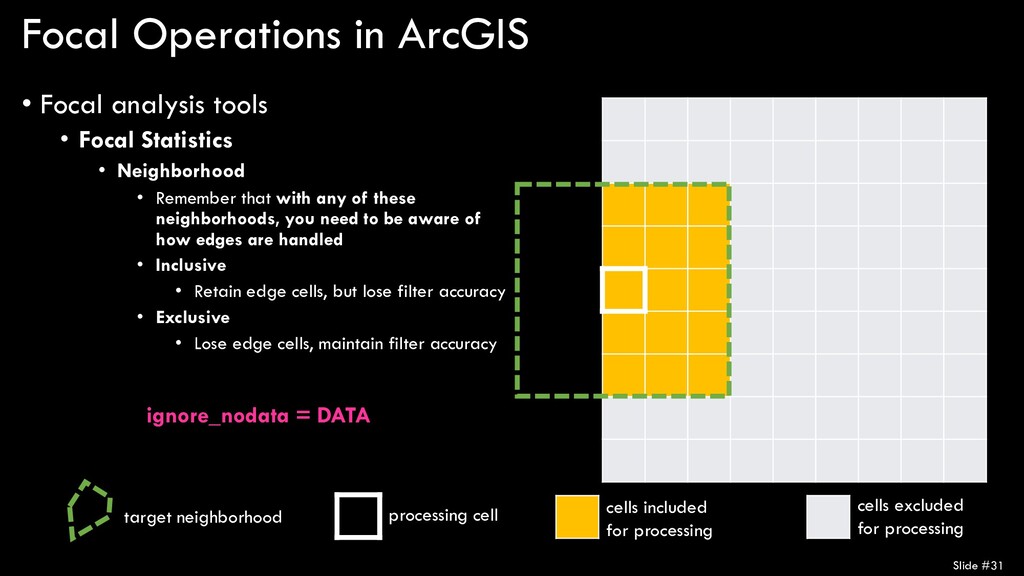
Statistics • Neighborhood • Remember that with any of these neighborhoods, you need to be aware of how edges are handled • Inclusive • Retain edge cells, but lose filter accuracy • Exclusive • Lose edge cells, maintain filter accuracy Slide #31 processing cell cells included for processing target neighborhood cells excluded for processing ignore_nodata = DATA
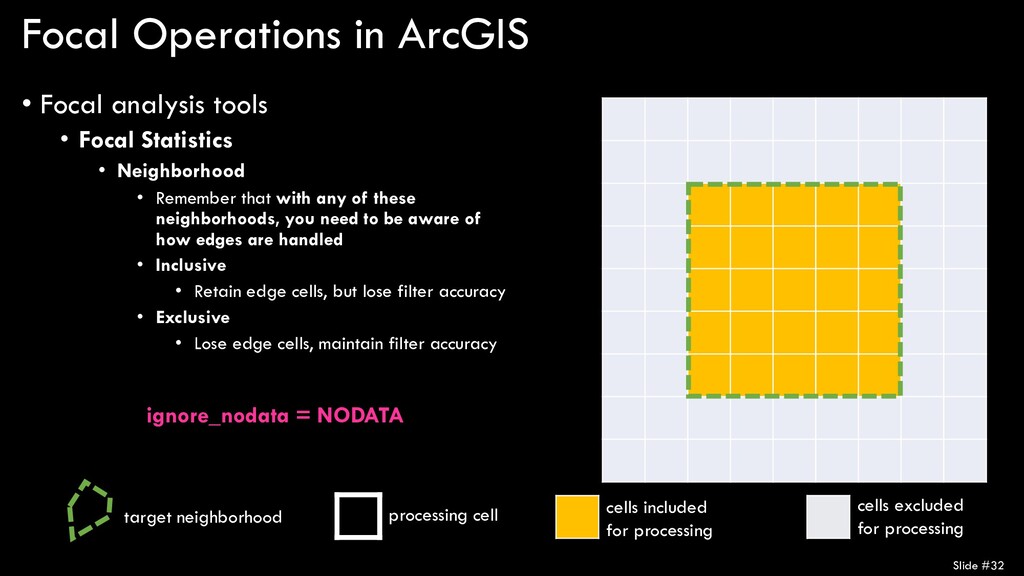
Statistics • Neighborhood • Remember that with any of these neighborhoods, you need to be aware of how edges are handled • Inclusive • Retain edge cells, but lose filter accuracy • Exclusive • Lose edge cells, maintain filter accuracy Slide #32 processing cell cells included for processing target neighborhood cells excluded for processing ignore_nodata = NODATA
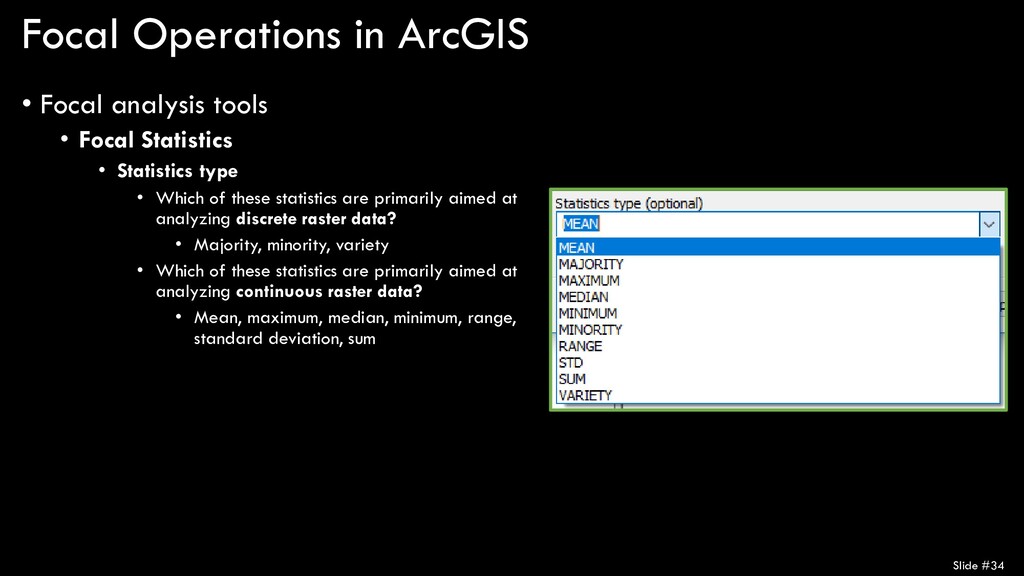
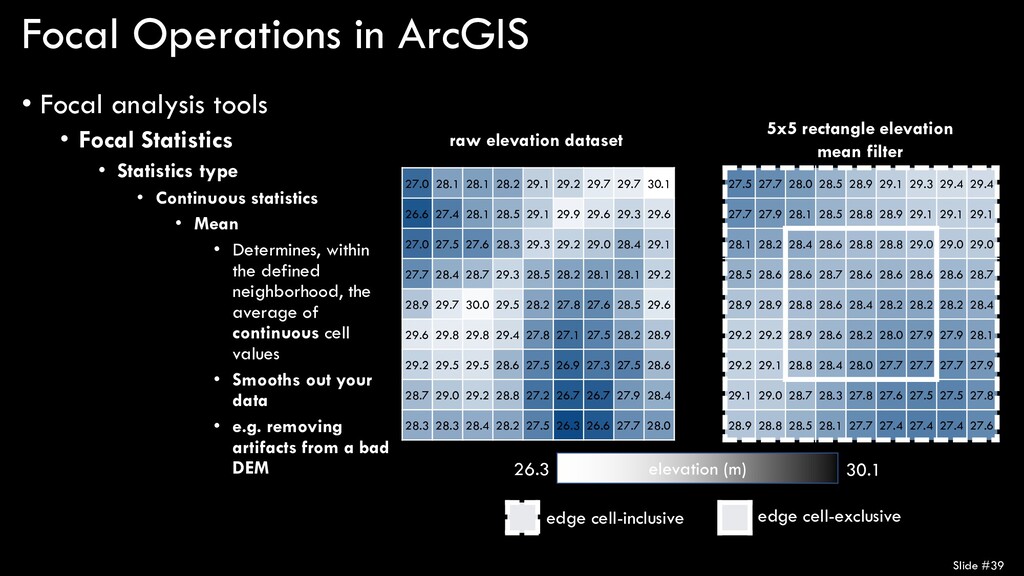
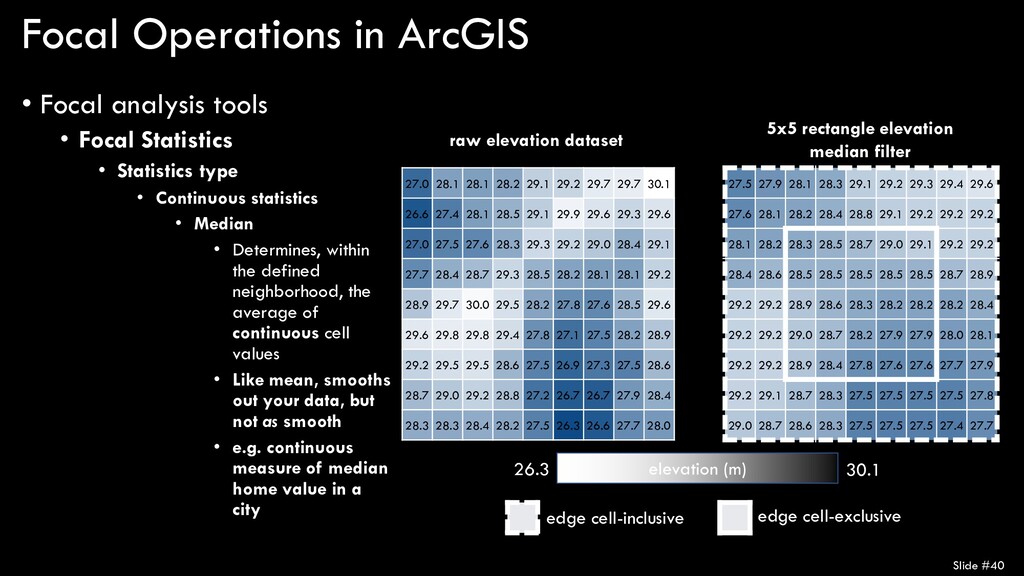
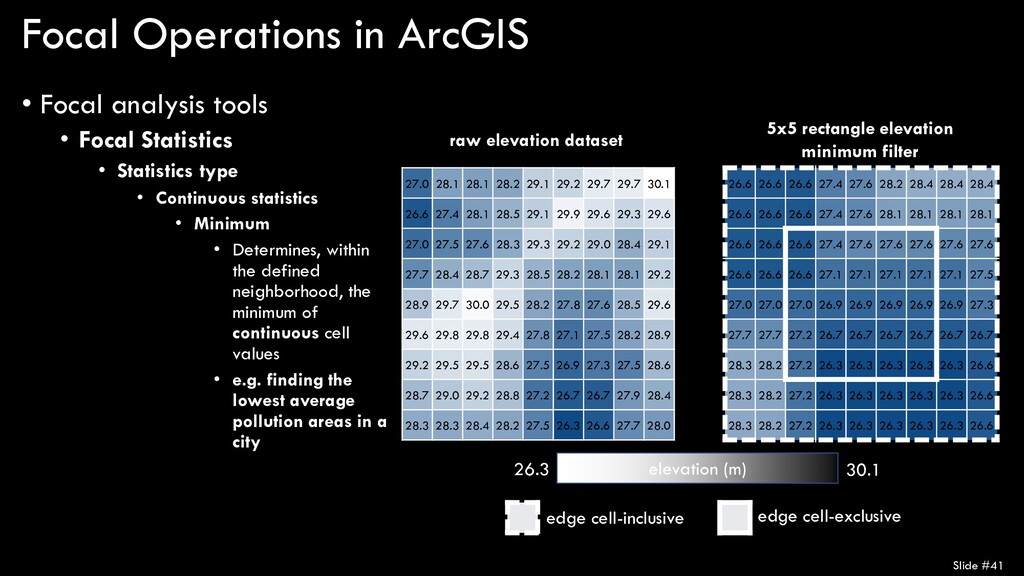
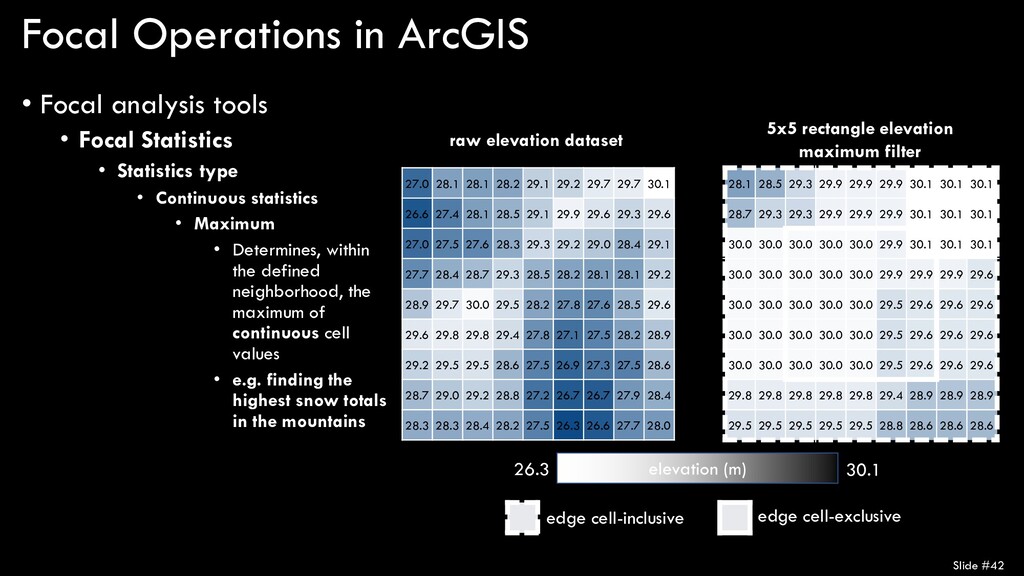
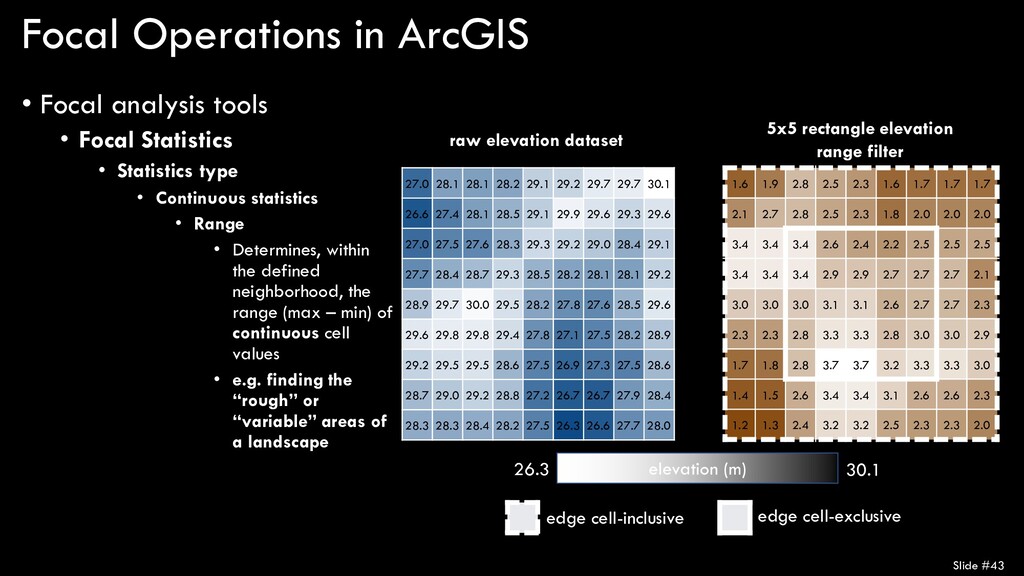
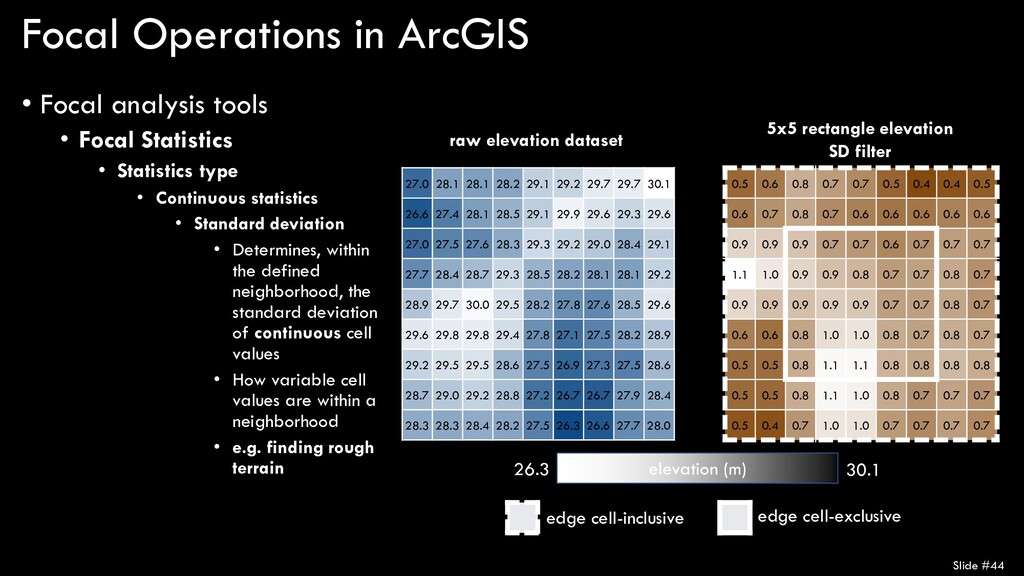
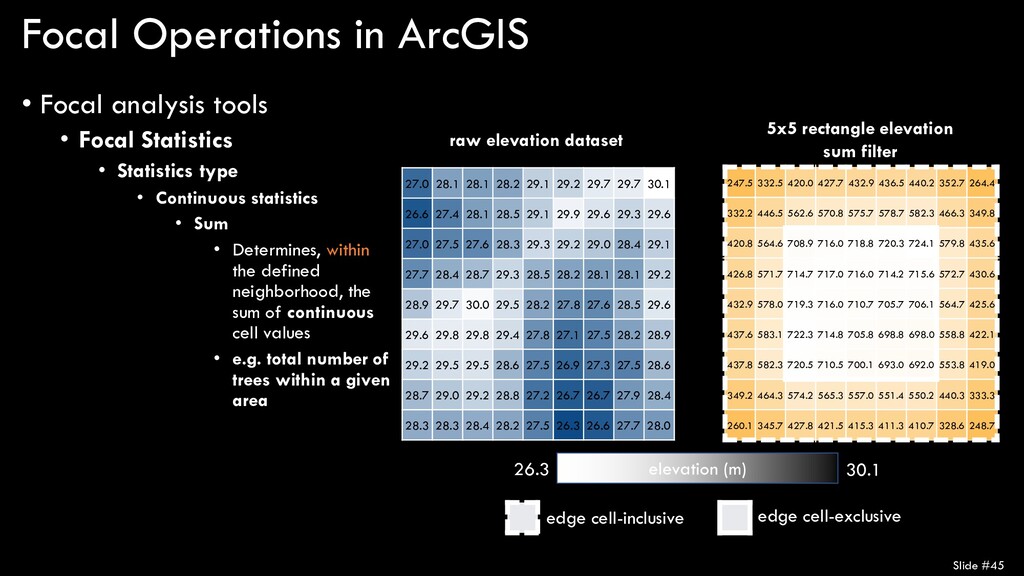
Statistics • Statistics type • Which of these statistics are primarily aimed at analyzing discrete raster data? • Majority, minority, variety • Which of these statistics are primarily aimed at analyzing continuous raster data? • Mean, maximum, median, minimum, range, standard deviation, sum Slide #34
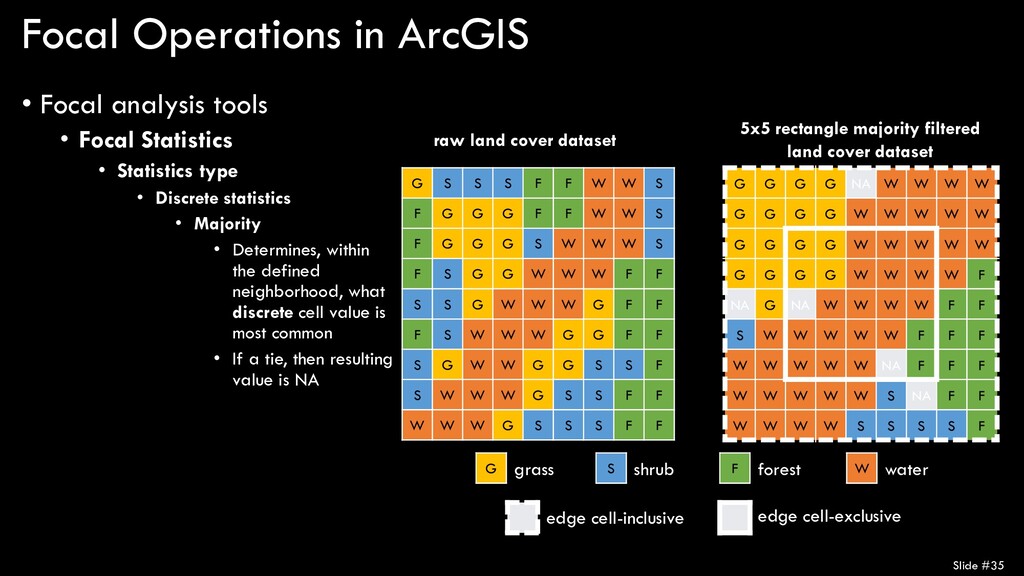
Statistics • Statistics type • Discrete statistics • Majority • Determines, within the defined neighborhood, what discrete cell value is most common • If a tie, then resulting value is NA Slide #35 G S S S F F W W S F G G G F F W W S F G G G S W W W S F S G G W W W F F S S G W W W G F F F S W W W G G F F S G W W G G S S F S W W W G S S F F W W W G S S S F F G G G G NA W W W W G G G G W W W W W G G G G W W W W W G G G G W W W W F NA G NA W W W W F F S W W W W W F F F W W W W W NA F F F W W W W W S NA F F W W W W S S S S F G grass S shrub F forest W water raw land cover dataset 5x5 rectangle majority filtered land cover dataset edge cell-inclusive edge cell-exclusive
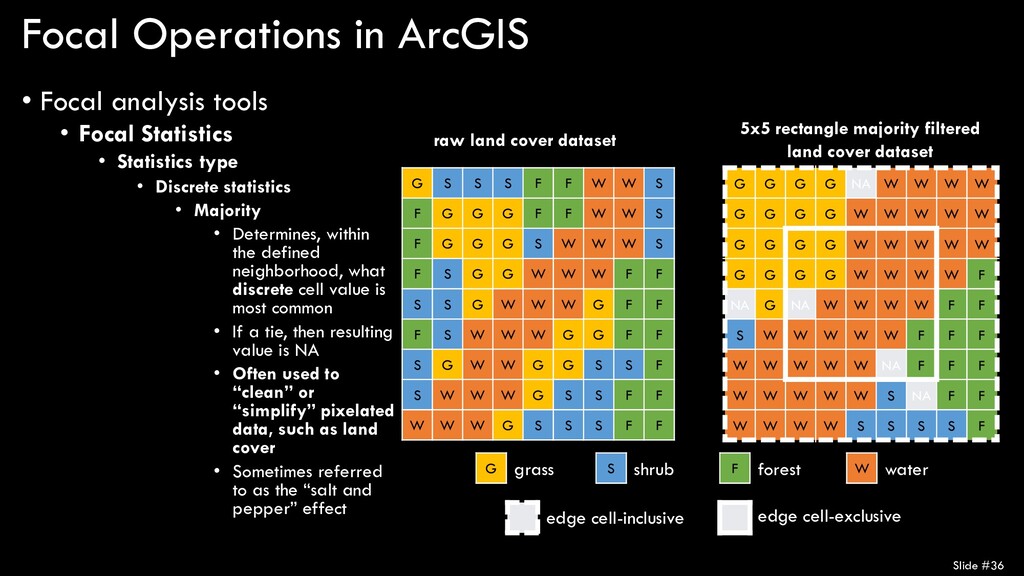
Statistics • Statistics type • Discrete statistics • Majority • Determines, within the defined neighborhood, what discrete cell value is most common • If a tie, then resulting value is NA • Often used to “clean” or “simplify” pixelated data, such as land cover • Sometimes referred to as the “salt and pepper” effect Slide #36 G S S S F F W W S F G G G F F W W S F G G G S W W W S F S G G W W W F F S S G W W W G F F F S W W W G G F F S G W W G G S S F S W W W G S S F F W W W G S S S F F G G G G NA W W W W G G G G W W W W W G G G G W W W W W G G G G W W W W F NA G NA W W W W F F S W W W W W F F F W W W W W NA F F F W W W W W S NA F F W W W W S S S S F G grass S shrub F forest W water raw land cover dataset 5x5 rectangle majority filtered land cover dataset edge cell-inclusive edge cell-exclusive
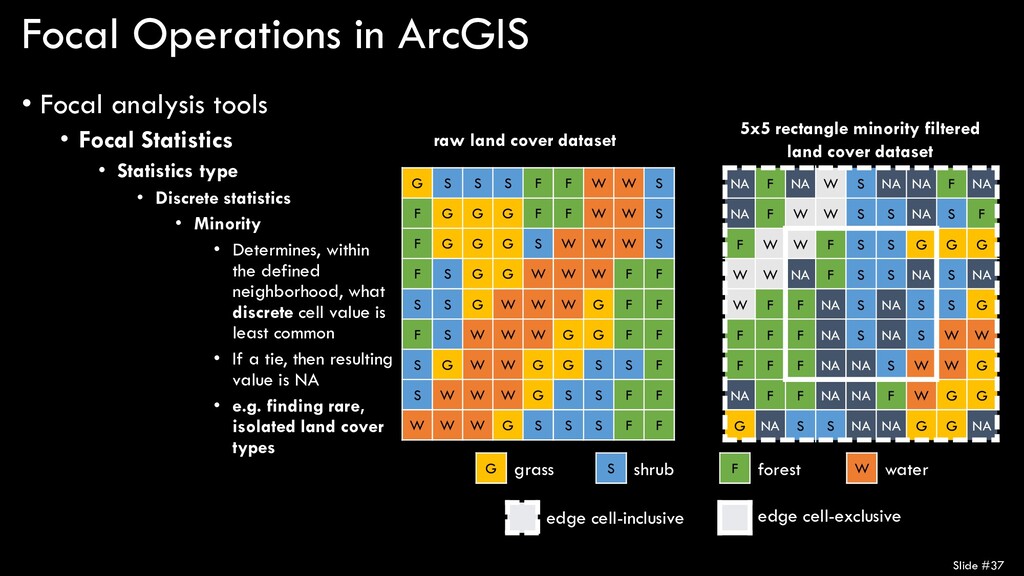
Statistics • Statistics type • Discrete statistics • Minority • Determines, within the defined neighborhood, what discrete cell value is least common • If a tie, then resulting value is NA • e.g. finding rare, isolated land cover types Slide #37 G S S S F F W W S F G G G F F W W S F G G G S W W W S F S G G W W W F F S S G W W W G F F F S W W W G G F F S G W W G G S S F S W W W G S S F F W W W G S S S F F NA F NA W S NA NA F NA NA F W W S S NA S F F W W F S S G G G W W NA F S S NA S NA W F F NA S NA S S G F F F NA S NA S W W F F F NA NA S W W G NA F F NA NA F W G G G NA S S NA NA G G NA G grass S shrub F forest W water raw land cover dataset 5x5 rectangle minority filtered land cover dataset edge cell-inclusive edge cell-exclusive
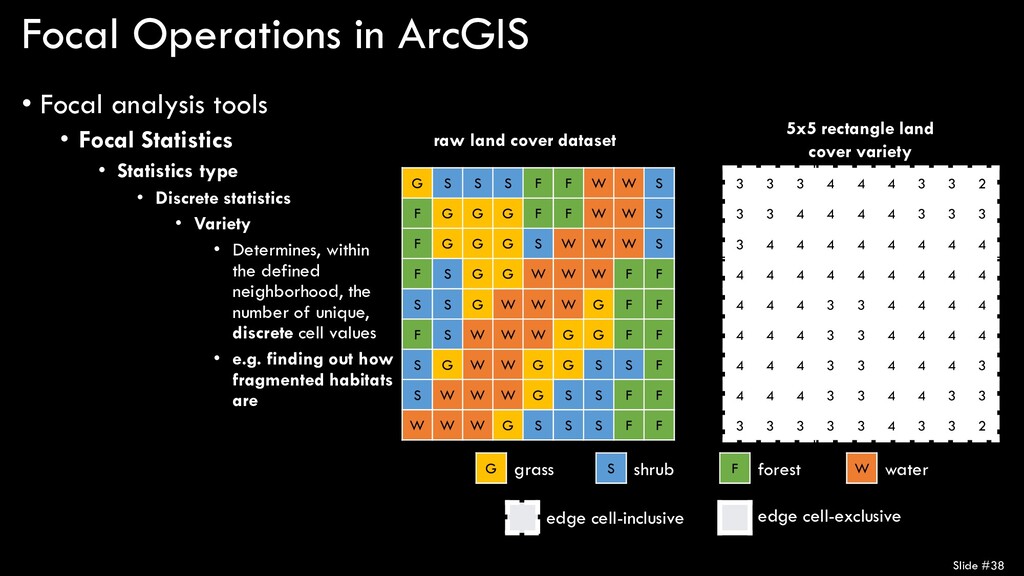
Statistics • Statistics type • Discrete statistics • Variety • Determines, within the defined neighborhood, the number of unique, discrete cell values • e.g. finding out how fragmented habitats are Slide #38 G S S S F F W W S F G G G F F W W S F G G G S W W W S F S G G W W W F F S S G W W W G F F F S W W W G G F F S G W W G G S S F S W W W G S S F F W W W G S S S F F 3 3 3 4 4 4 3 3 2 3 3 4 4 4 4 3 3 3 3 4 4 4 4 4 4 4 4 4 4 4 4 4 4 4 4 4 4 4 4 3 3 4 4 4 4 4 4 4 3 3 4 4 4 4 4 4 4 3 3 4 4 4 3 4 4 4 3 3 4 4 3 3 3 3 3 3 3 4 3 3 2 G grass S shrub F forest W water raw land cover dataset 5x5 rectangle land cover variety edge cell-inclusive edge cell-exclusive