data, like shipping cost. Inside of Tableau, measures are aggregations – they’re aggregated up to the granularity set by the dimensions in the view. The value of a measure therefore depends on the context of the dimensions. Number of records is a Measure automatically created by Tableau
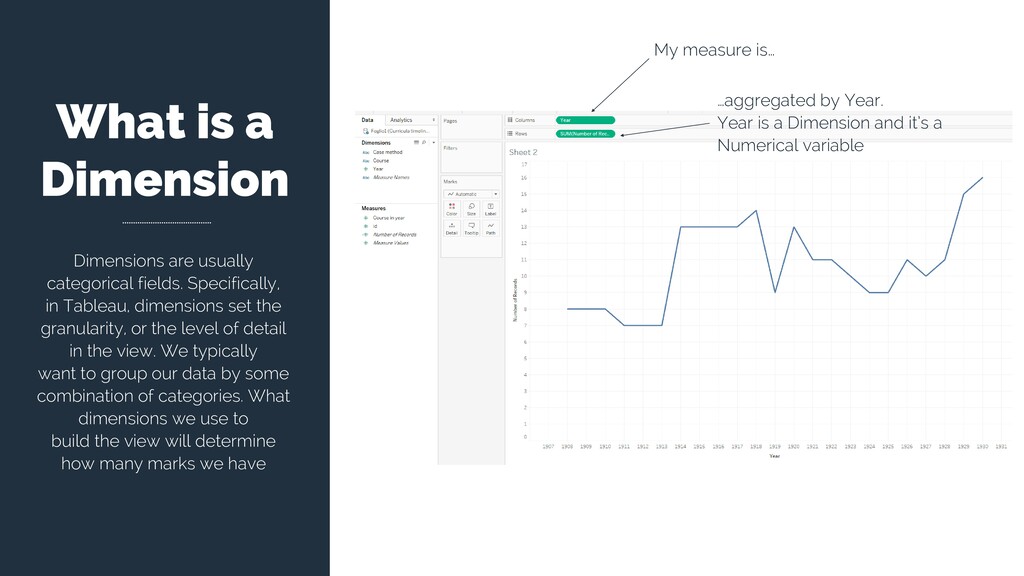
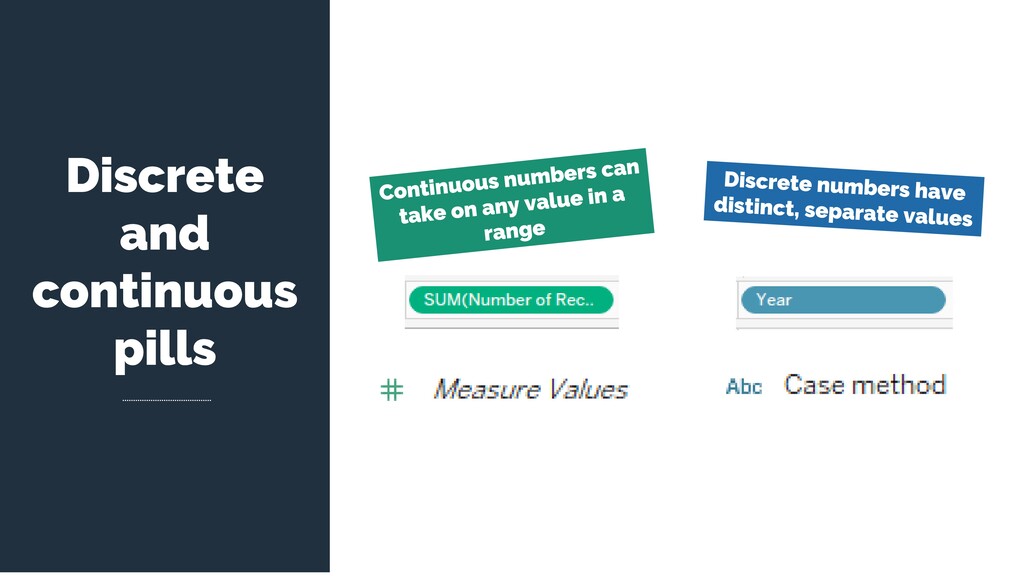
in Tableau, dimensions set the granularity, or the level of detail in the view. We typically want to group our data by some combination of categories. What dimensions we use to build the view will determine how many marks we have My measure is… …aggregated by Year. Year is a Dimension and it’s a Numerical variable
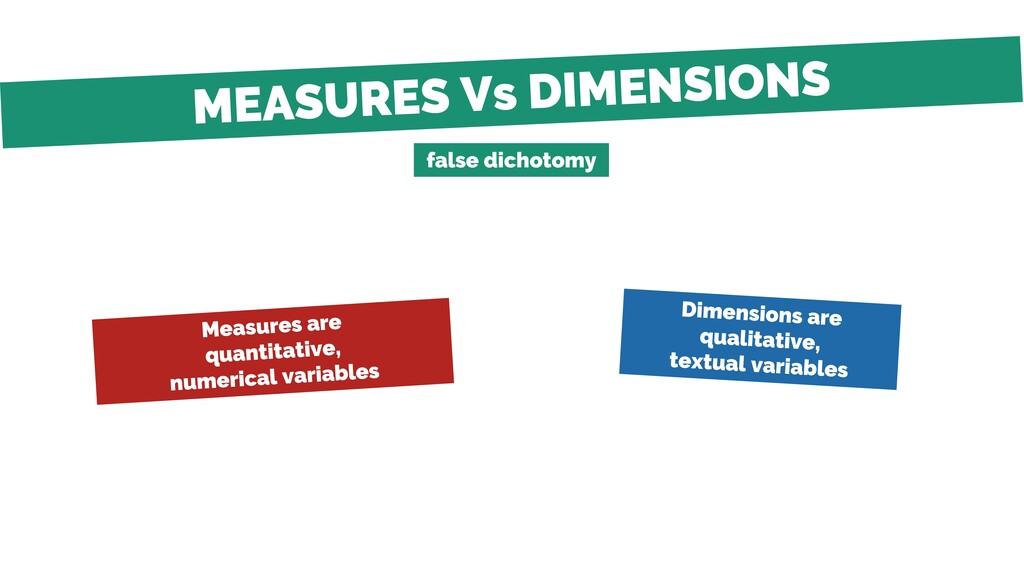
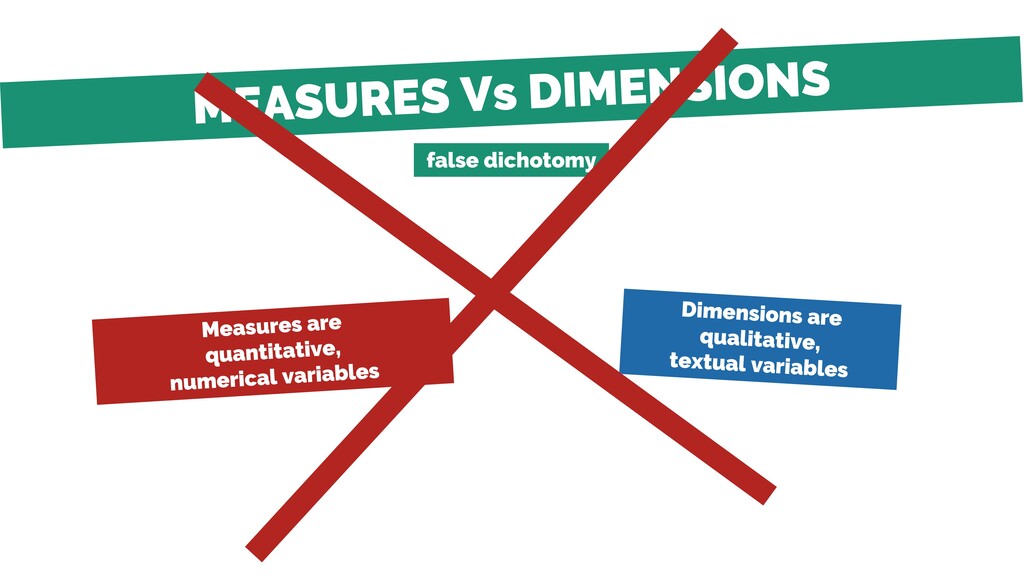
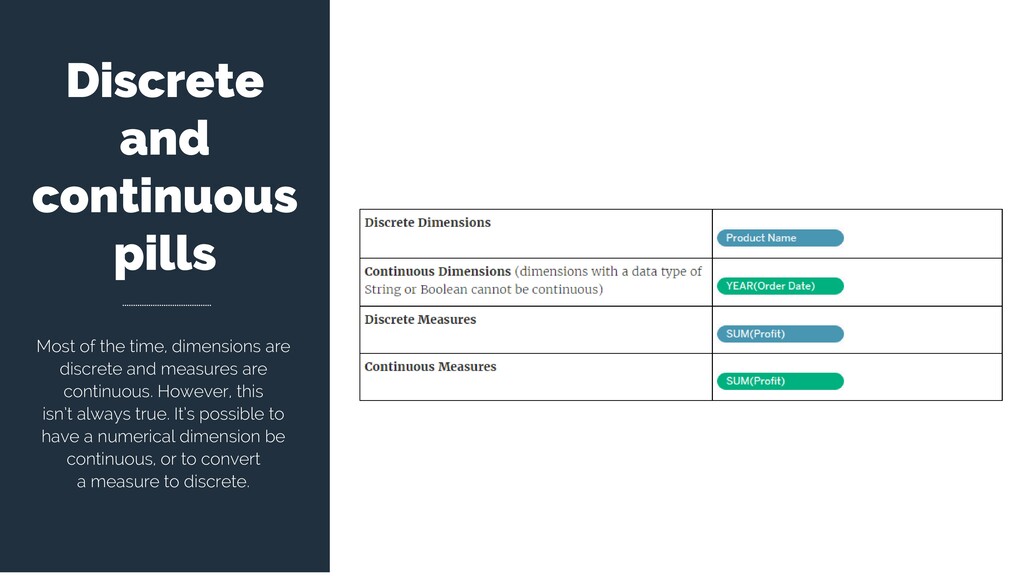
discrete and measures are continuous. However, this isn’t always true. It’s possible to have a numerical dimension be continuous, or to convert a measure to discrete.
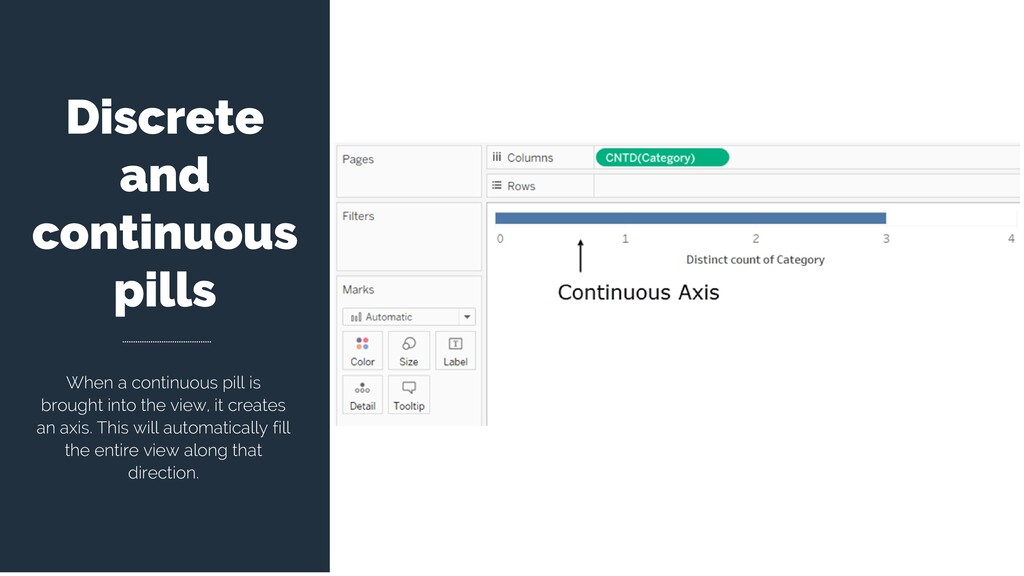
that can be added, averaged, or otherwise aggregated, Tableau assigns that field to the Measures area of the Data pane when you first connect to a data source. Tableau is assuming that the values are continuous.
dates, or geographical locations—anything other than numbers—Tableau assigns that field to the Dimensions area of the Data pane when you first connect to a data source. Tableau treats the values as discrete. (however, postal codes are an exception. That’s why it is important to double check all measures and dimensions)
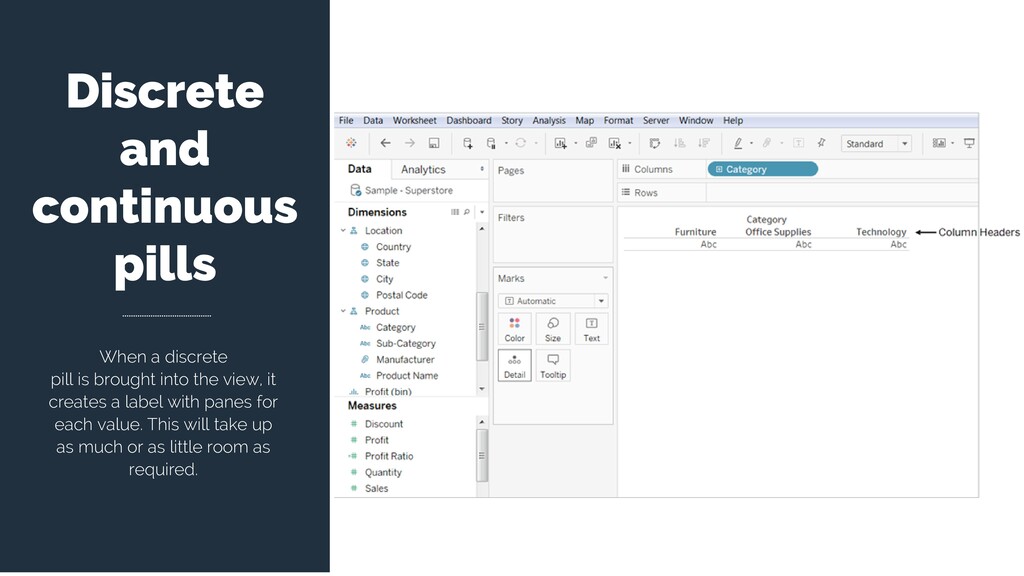
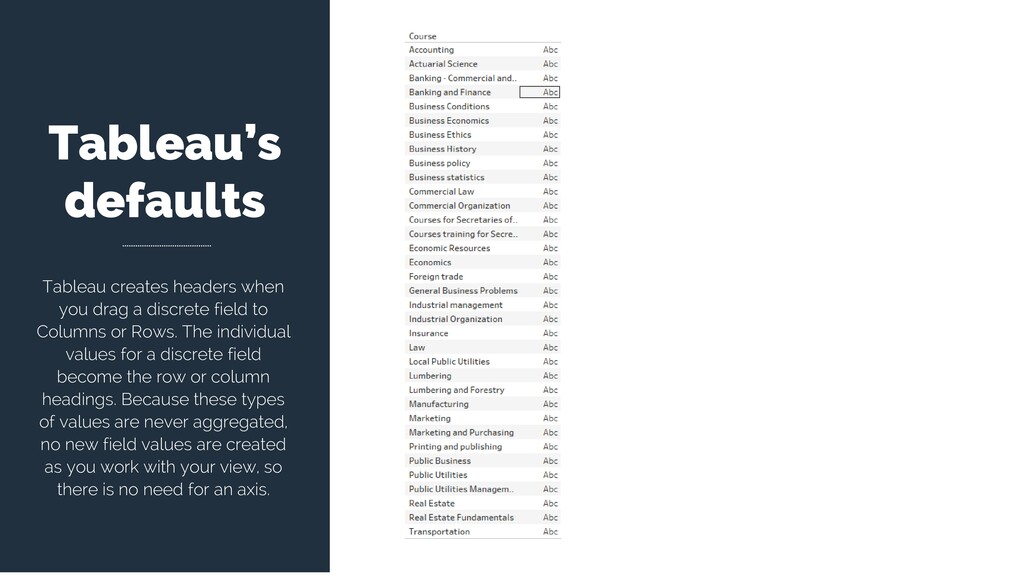
field to Columns or Rows. The individual values for a discrete field become the row or column headings. Because these types of values are never aggregated, no new field values are created as you work with your view, so there is no need for an axis.
![For questions or help, write me at: [email protected] THANK YOU](https://files.speakerdeck.com/presentations/b48d43ac695347fdb1d03f47d8d0bd7f/slide_25.jpg)