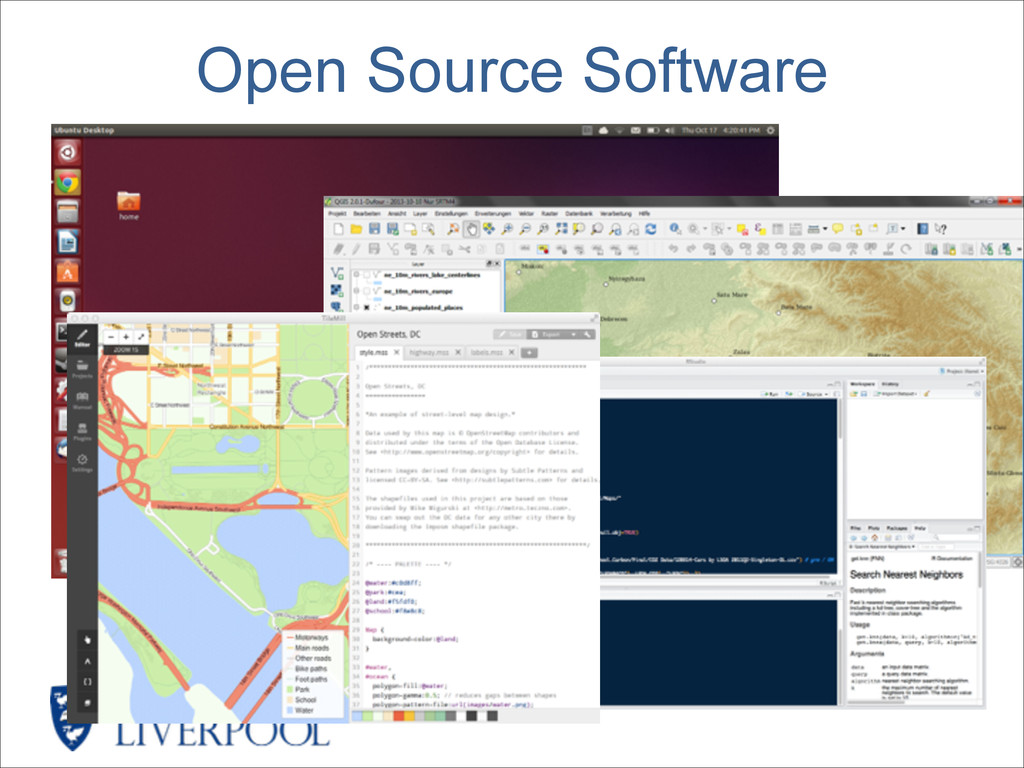
involve an important geographic component • Working with geographic information involves unique, complex and difficult choices – Why we need specialized “software” • organize and store • access and retrieve • manipulate and synthesize • apply to the solution of problems
innovative data uses – Open Data – Volunteered geographic information (Crowd Sourcing) • GIS tools are no longer a barrier • Move of GIS online & mobile – New ways to generate data – New ways to consume information
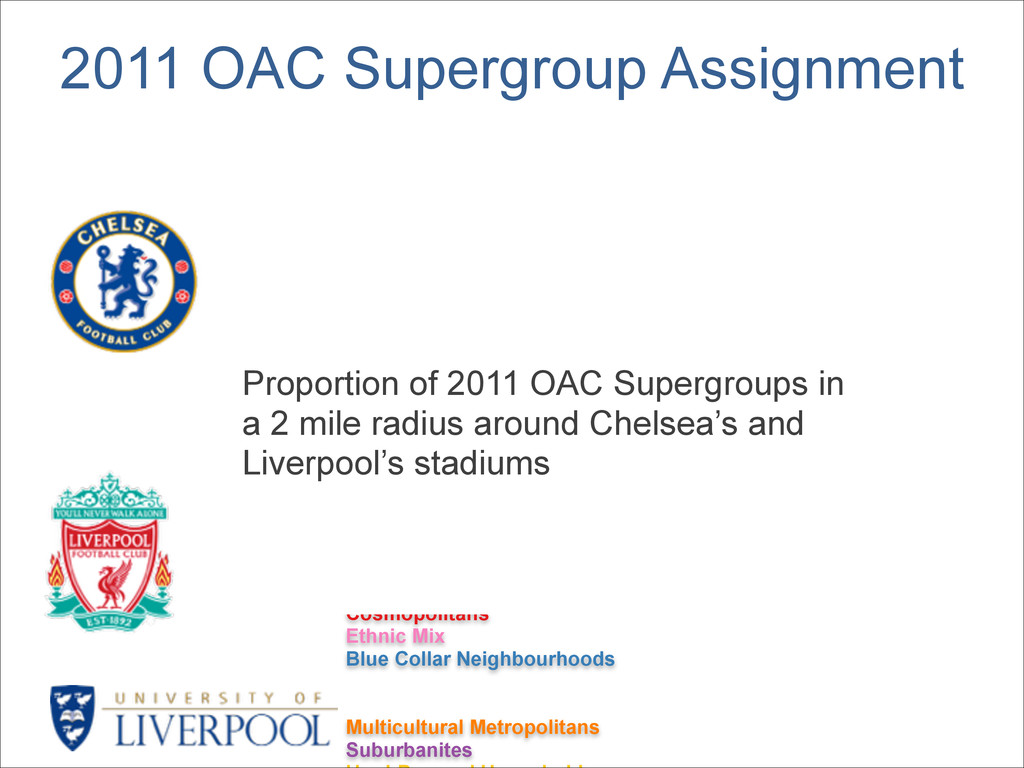
Blue Collar Neighbourhoods ! ! Multicultural Metropolitans Suburbanites Proportion of 2011 OAC Supergroups in a 2 mile radius around Chelsea’s and Liverpool’s stadiums
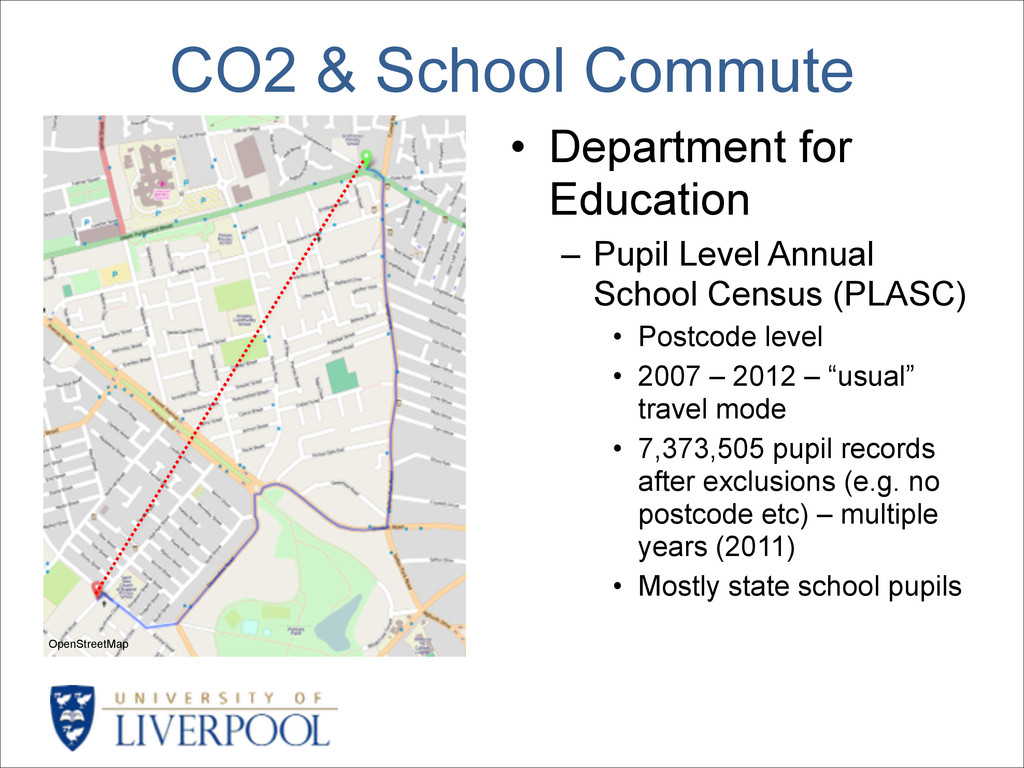
Pupil Level Annual School Census (PLASC) • Postcode level • 2007 – 2012 – “usual” travel mode • 7,373,505 pupil records after exclusions (e.g. no postcode etc) – multiple years (2011) • Mostly state school pupils
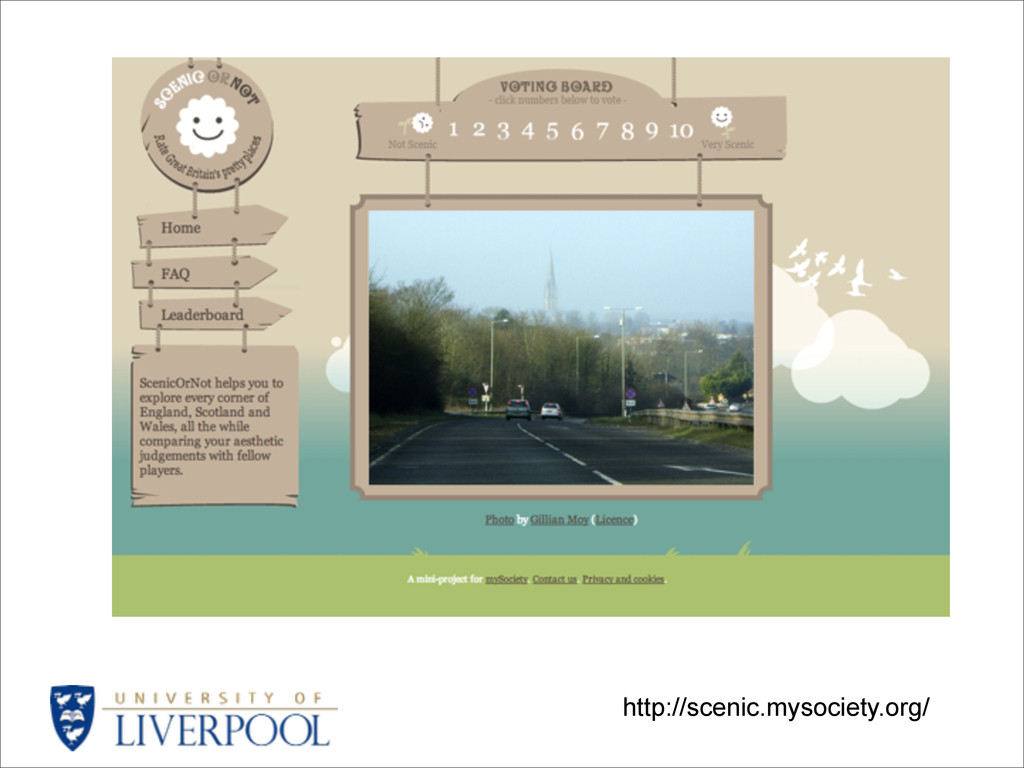
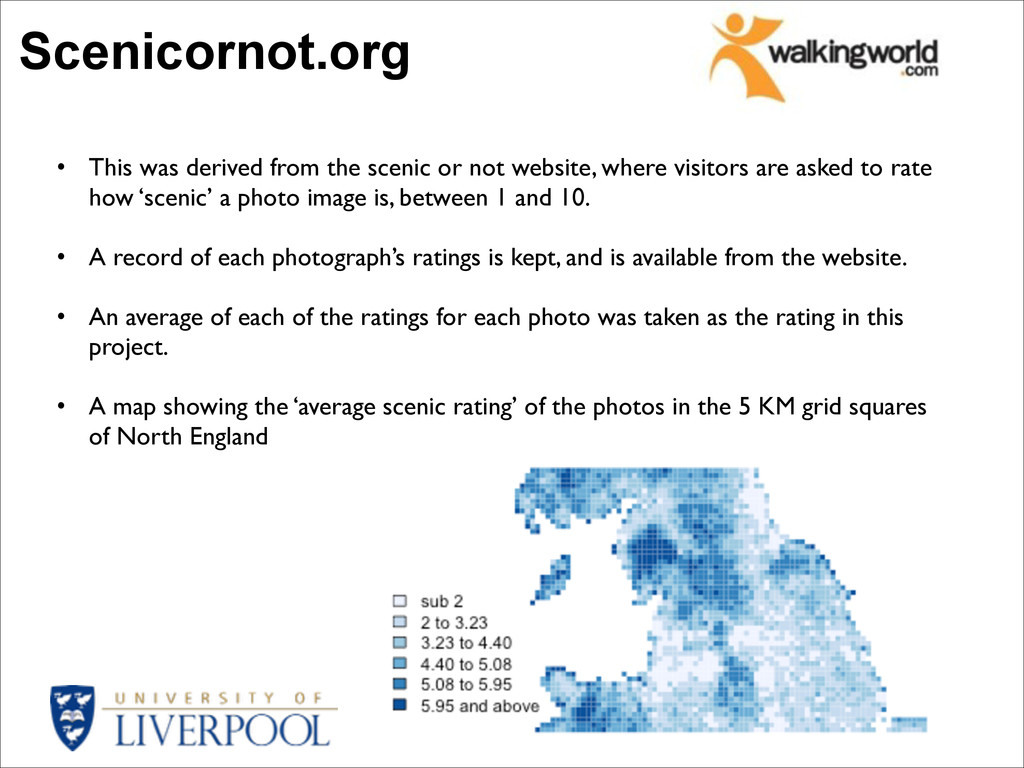
website, where visitors are asked to rate how ‘scenic’ a photo image is, between 1 and 10. ! • A record of each photograph’s ratings is kept, and is available from the website. ! • An average of each of the ratings for each photo was taken as the rating in this project. ! • A map showing the ‘average scenic rating’ of the photos in the 5 KM grid squares of North England
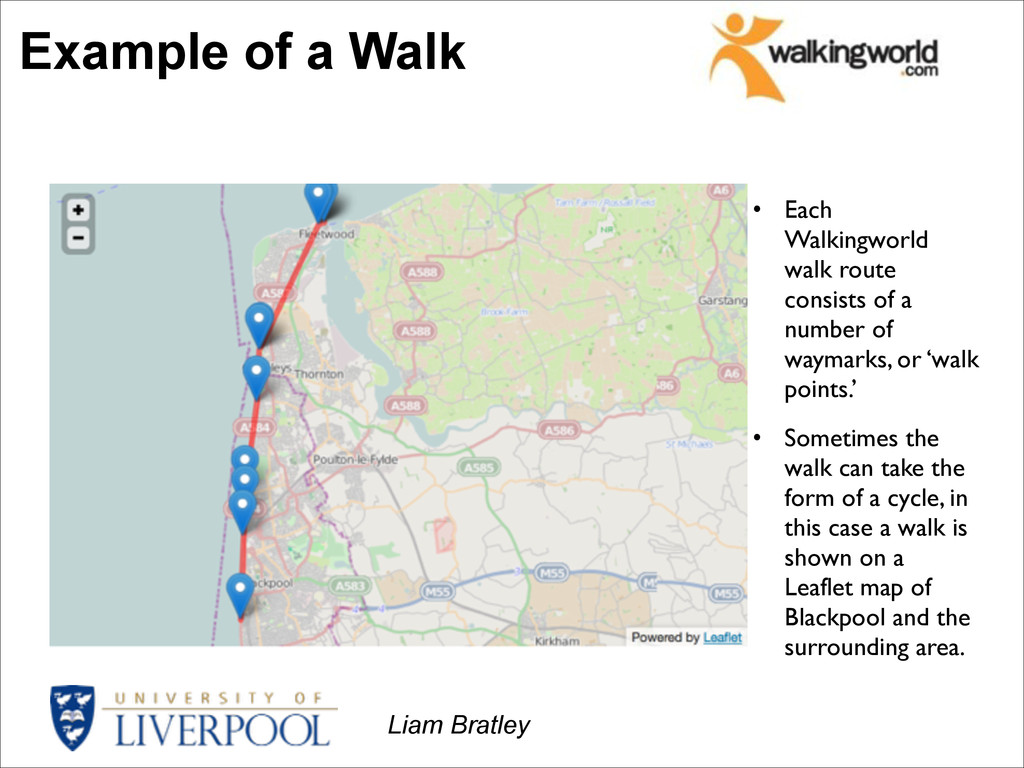
of a number of waymarks, or ‘walk points.’ • Sometimes the walk can take the form of a cycle, in this case a walk is shown on a Leaflet map of Blackpool and the surrounding area. Liam Bratley
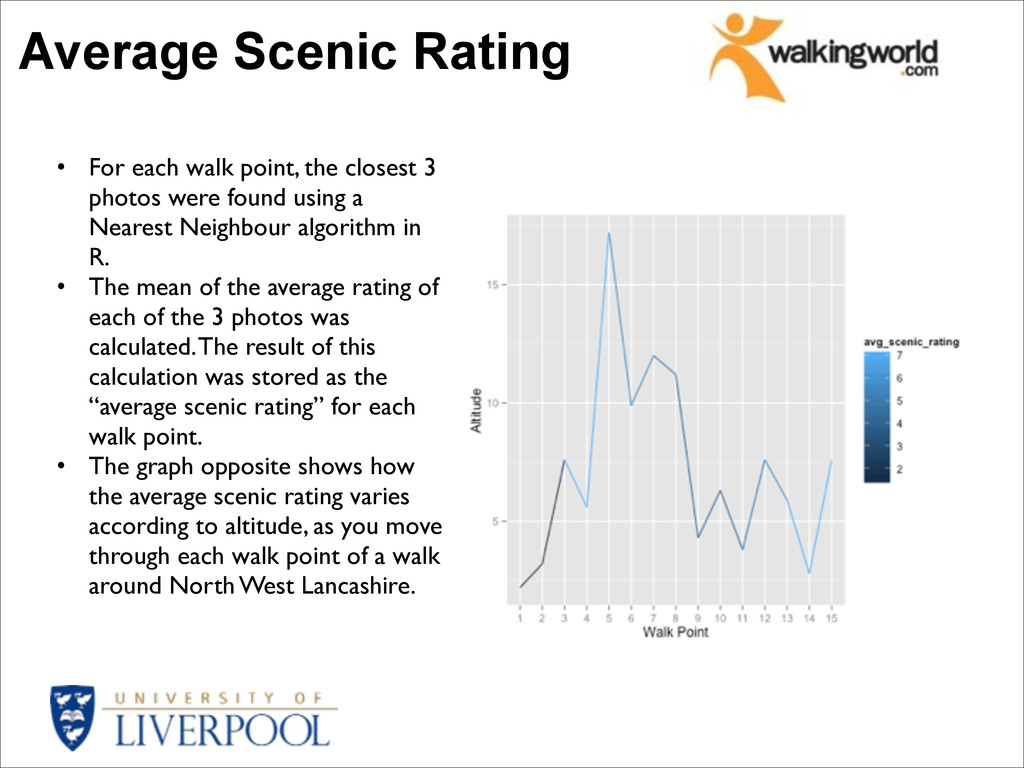
3 photos were found using a Nearest Neighbour algorithm in R. • The mean of the average rating of each of the 3 photos was calculated. The result of this calculation was stored as the “average scenic rating” for each walk point. • The graph opposite shows how the average scenic rating varies according to altitude, as you move through each walk point of a walk around North West Lancashire.
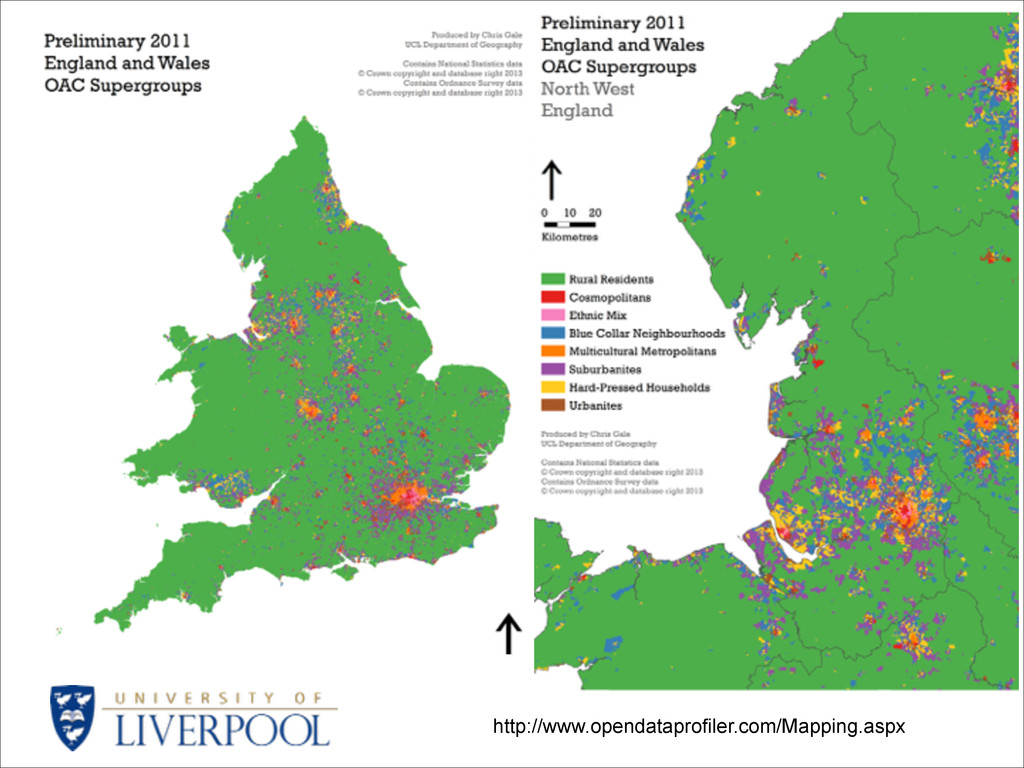
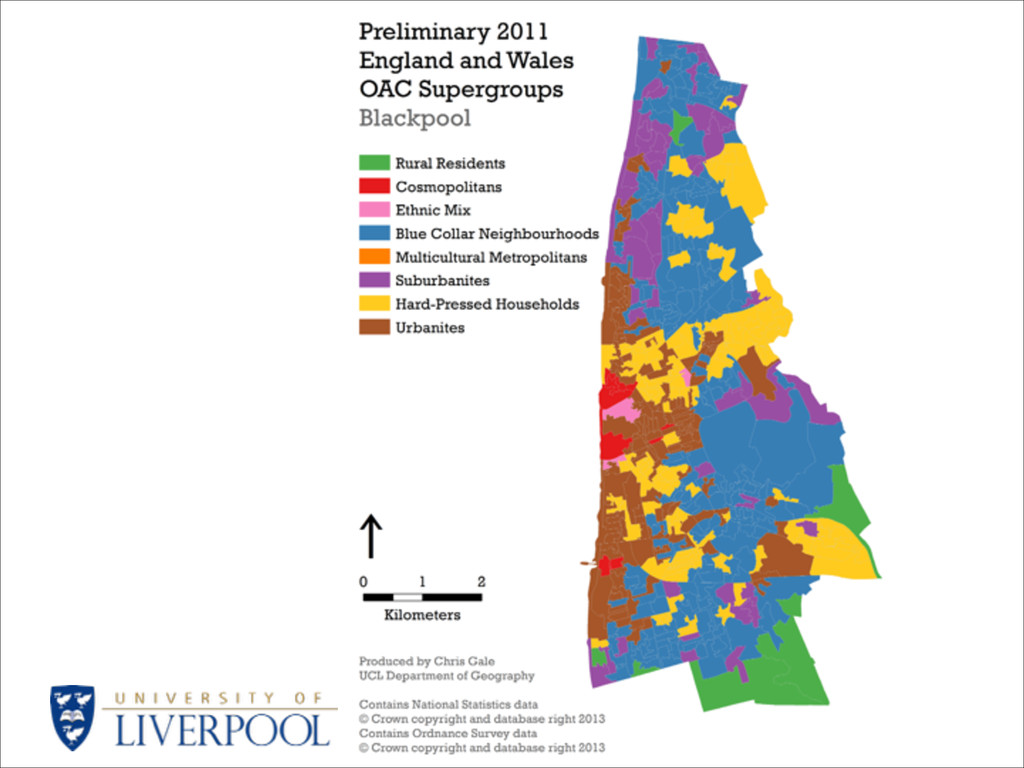
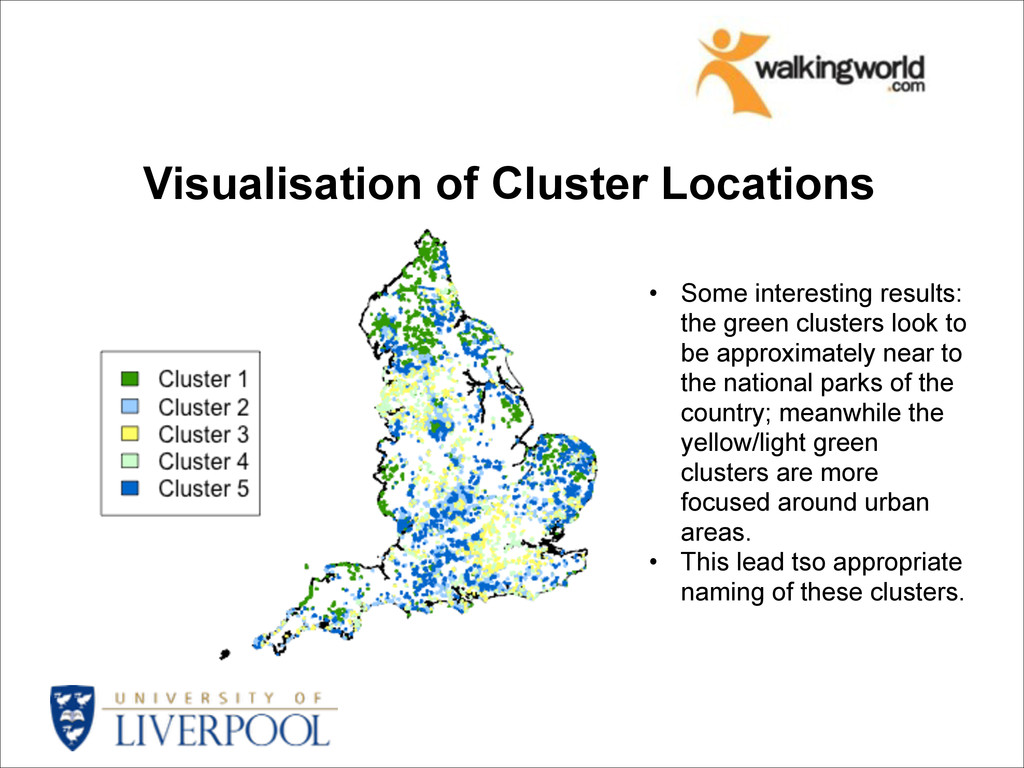
clusters look to be approximately near to the national parks of the country; meanwhile the yellow/light green clusters are more focused around urban areas. • This lead tso appropriate naming of these clusters.
and innovative data uses – Open Data – Volunteered geographic information (Crowd Sourcing) • GIS tools are no longer a barrier • Move of GIS online & mobile – New ways to generate data – New ways to consume information