R for Research: A Gallery of Applications Pt 1 http://www.flickr.com/photos/epsos/5591761716/sizes/o/in/ photostream/ Ritsumeikan University: 18th June 201 R
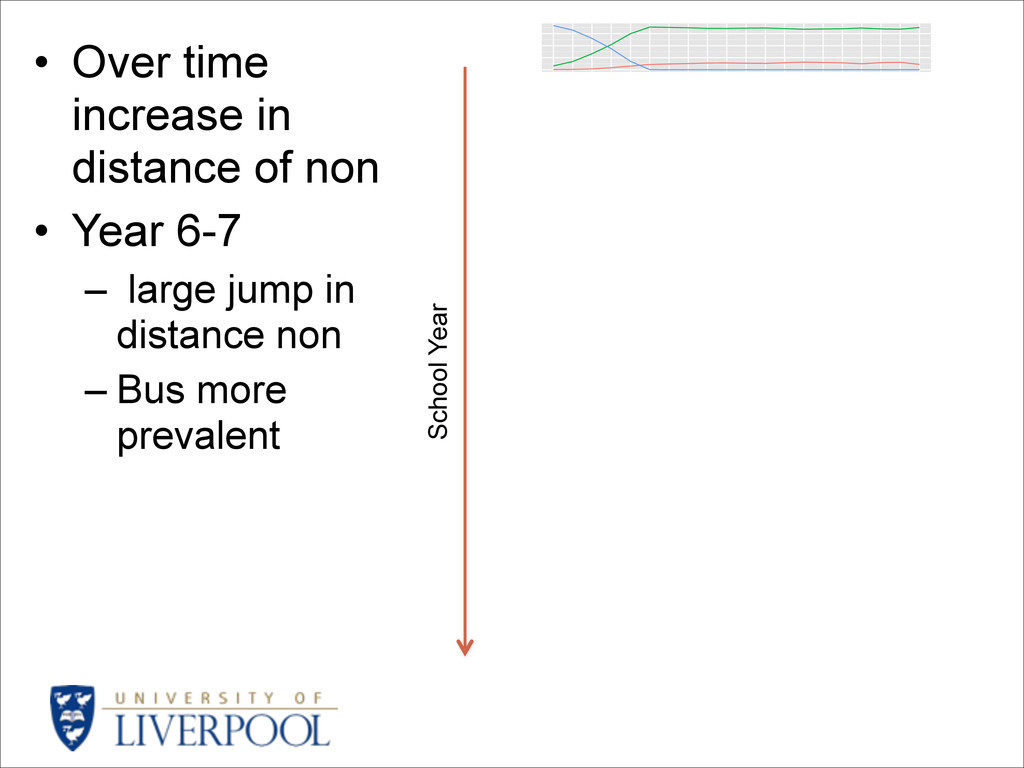
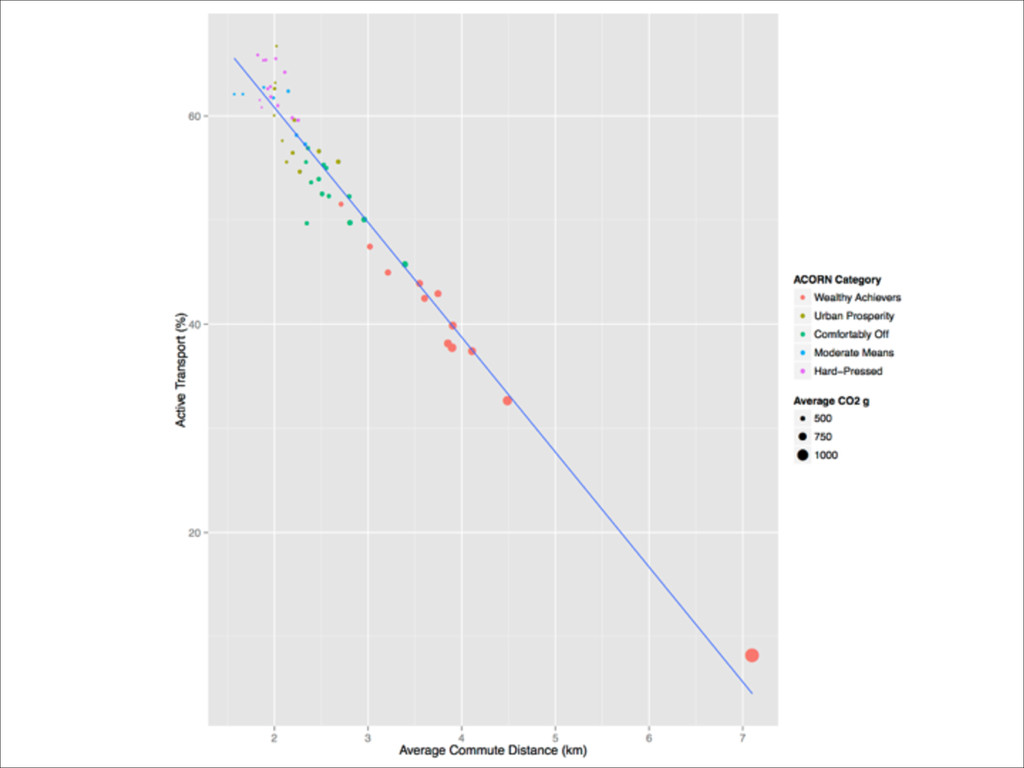
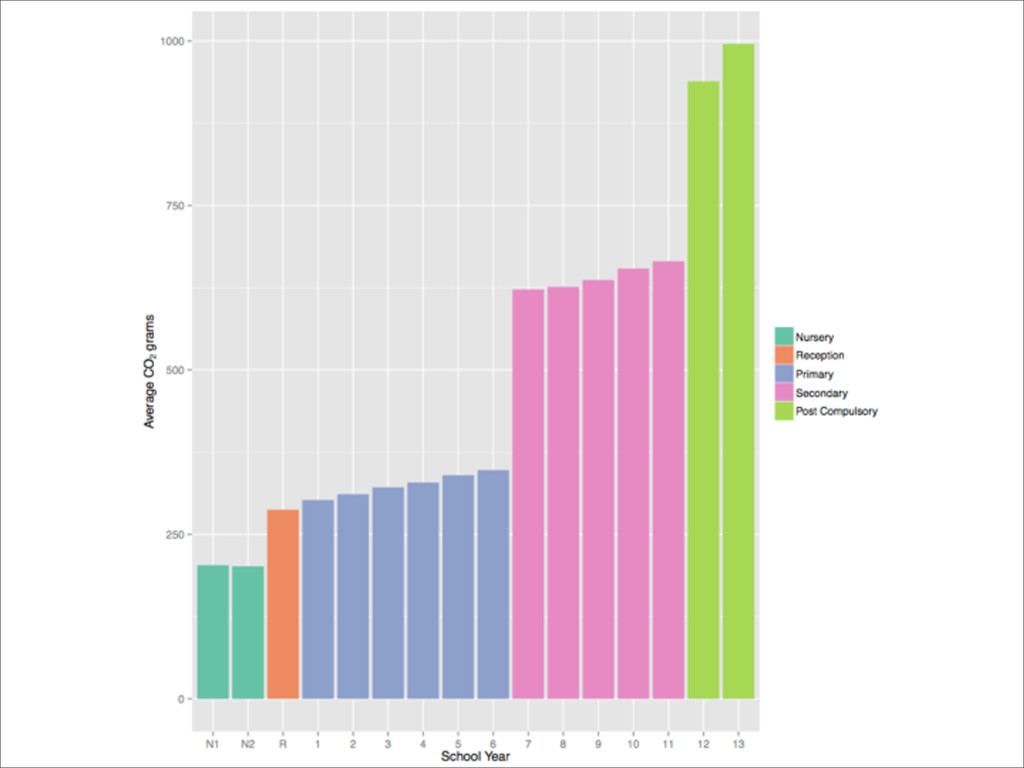
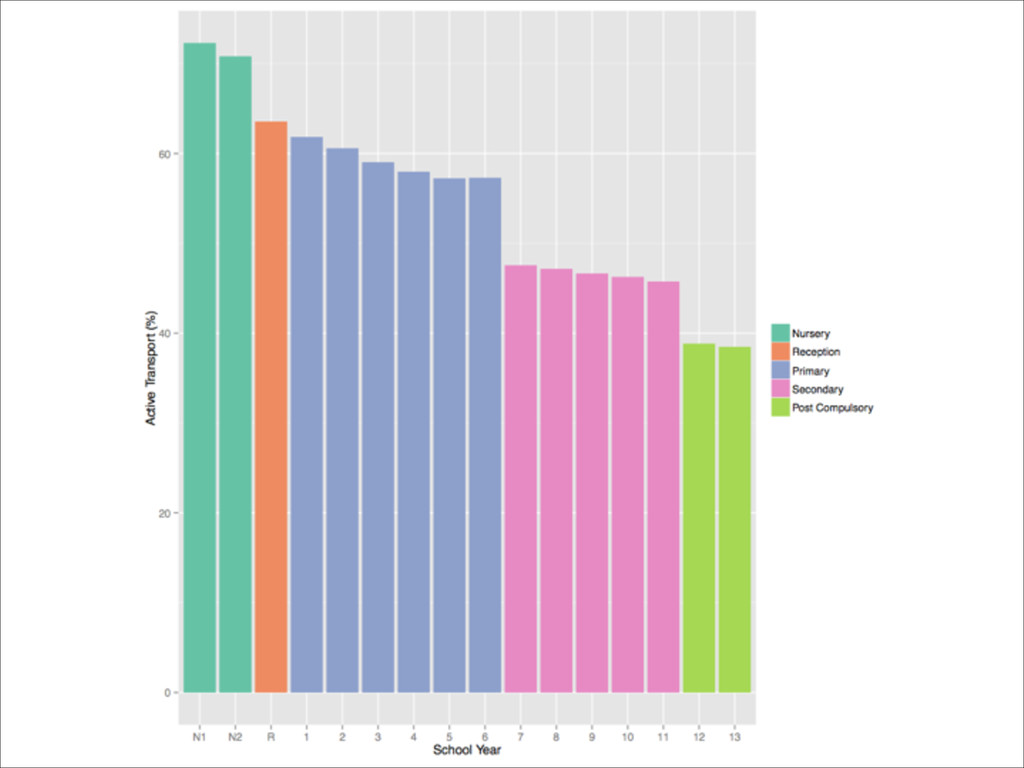
to school are in decline • Pupil-school commute is estimated to contribute around 658k tonnes of CO2 / year • Transport adopted for the pupil-school commute has obvious implications for CO2 emissions
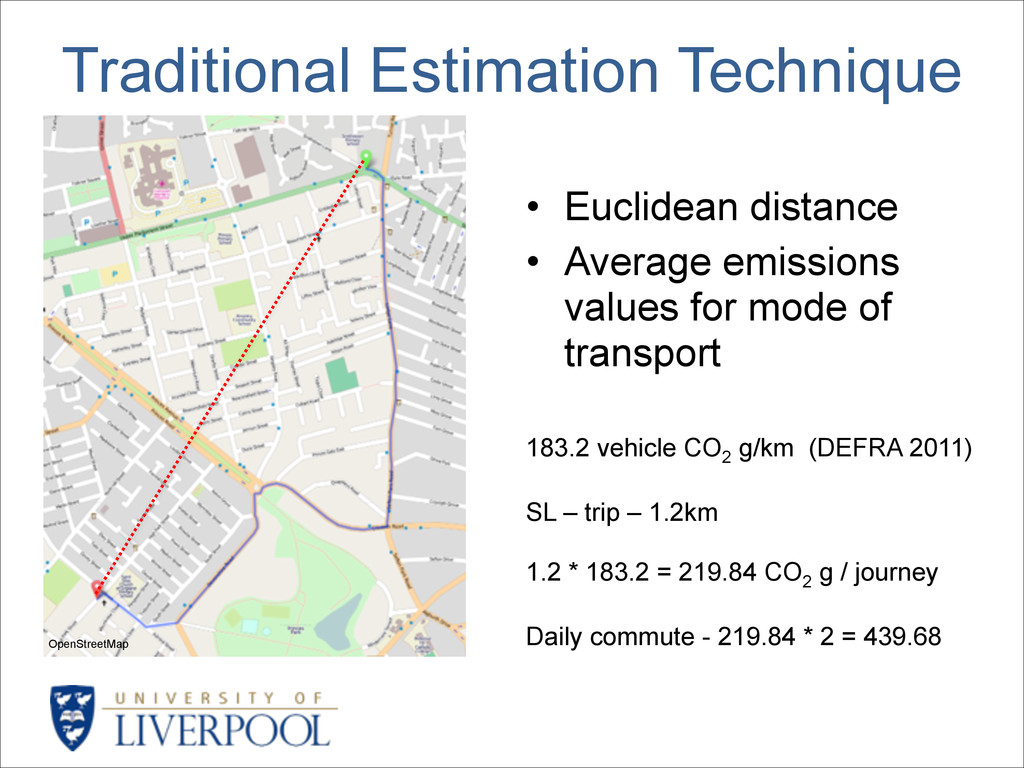
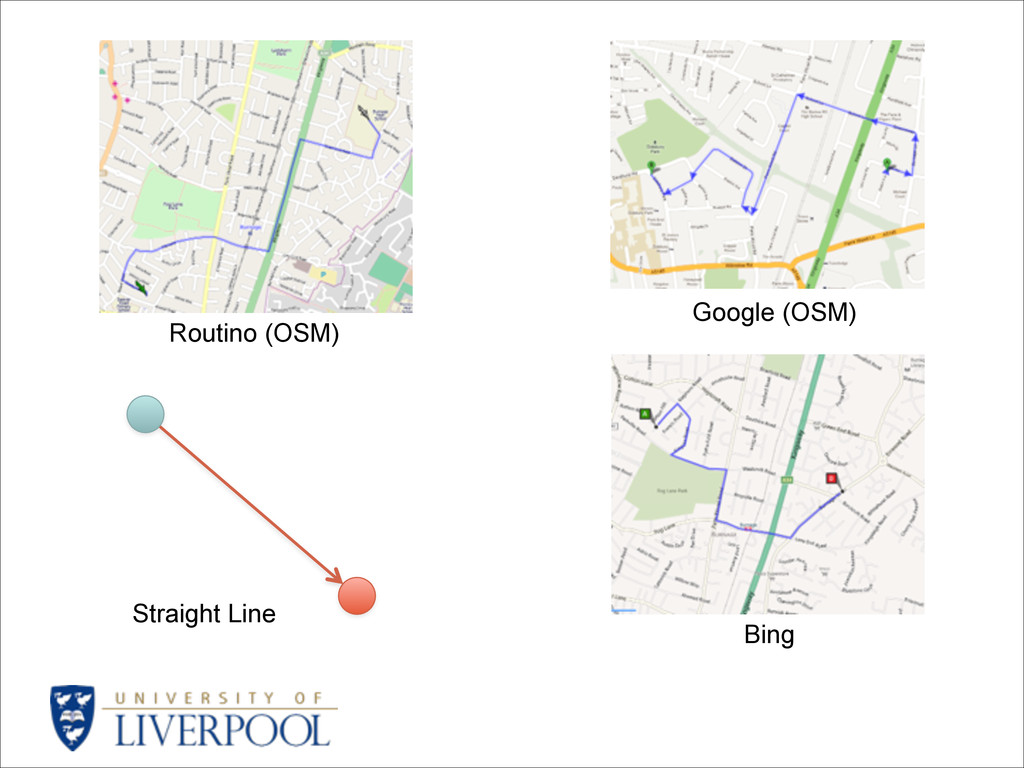
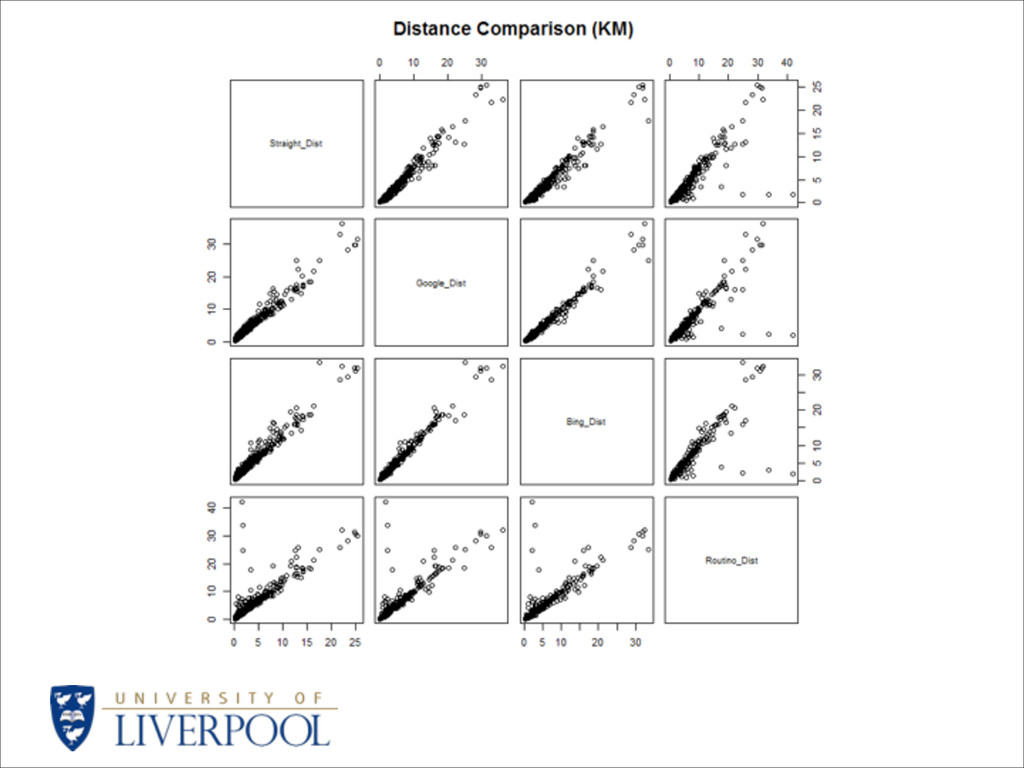
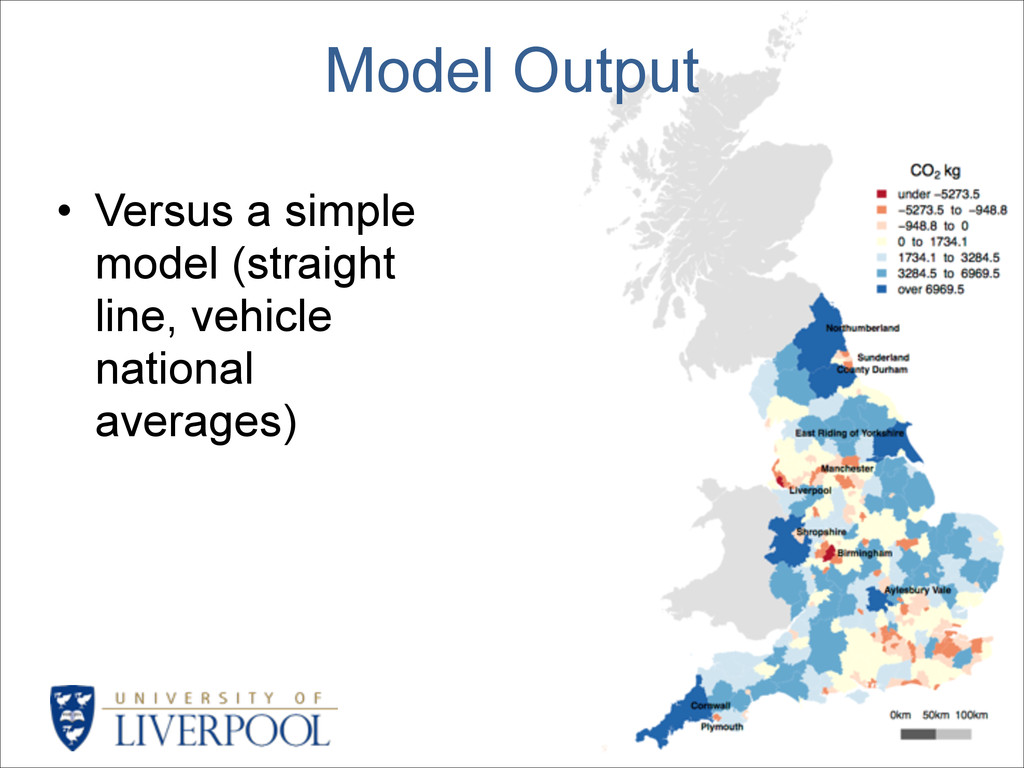
lines will typically underestimate true distances • No sensitivity to different vehicle types – What about train / bus etc? • Geocomputation provides a solution…
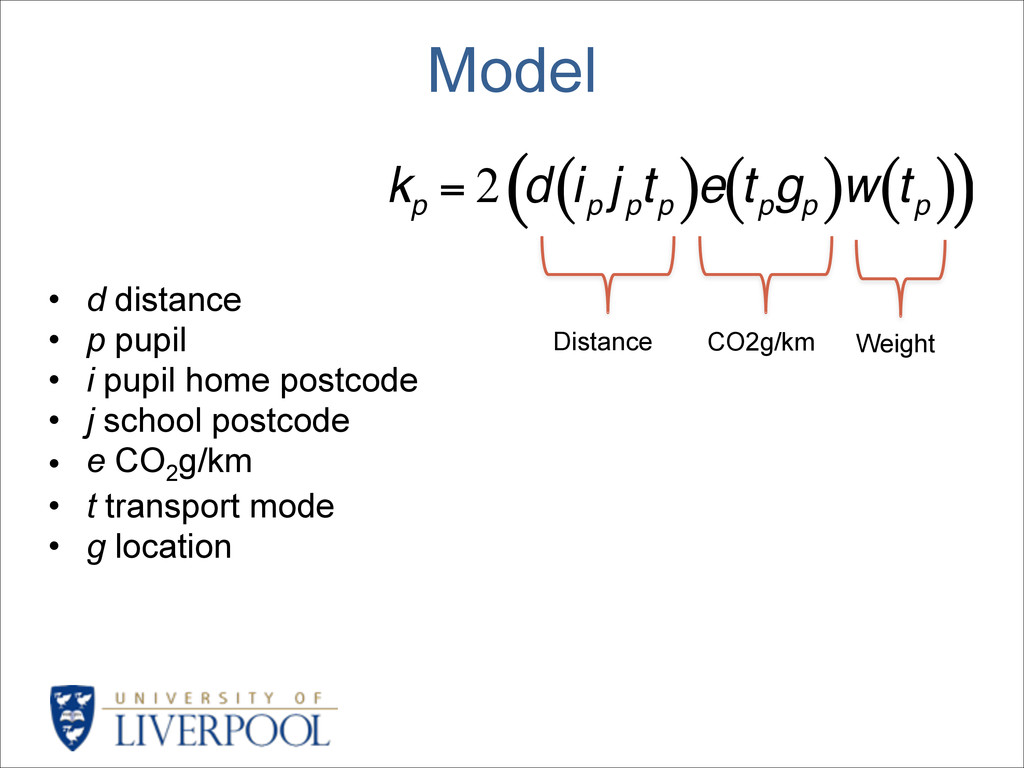
home postcode • j school postcode • e CO2 g/km • t transport mode • g location k p = 2 d i p j p t p ( )e t p g p ( )w t p ( ) ( ) Distance CO2g/km Weight
School Census (PLASC) • Postcode level • 2007 – 2012 – “usual” travel mode • 7,373,505 pupil records after exclusions (e.g. no postcode etc) – multiple years • Mostly state school pupils
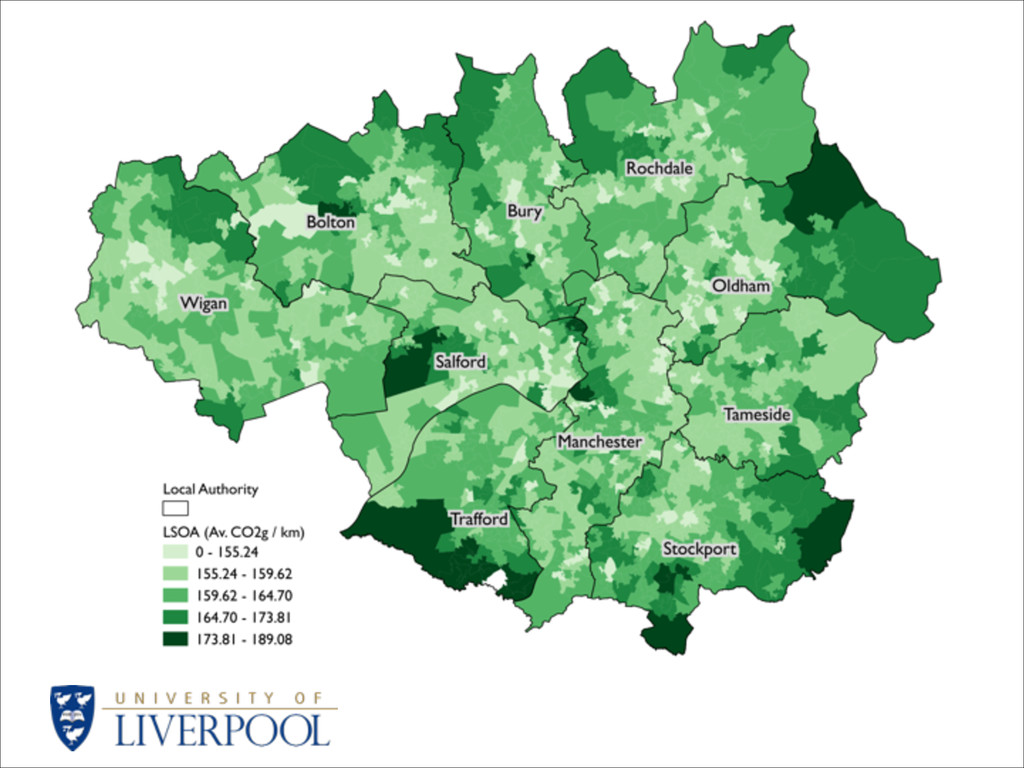
2 g/km for those vehicles registered within these zones – Driver Vehicle Licensing Agency (DVLA) • European legislation directive 91/441/EC – Cars registered after March 2001 • Caveat – Possible underestimation? » 162.9 CO 2 g/km differs from the DEFRA national estimate of 183.2 CO 2 g/km (DEFRA 2011). » Might be specific car types for school run?
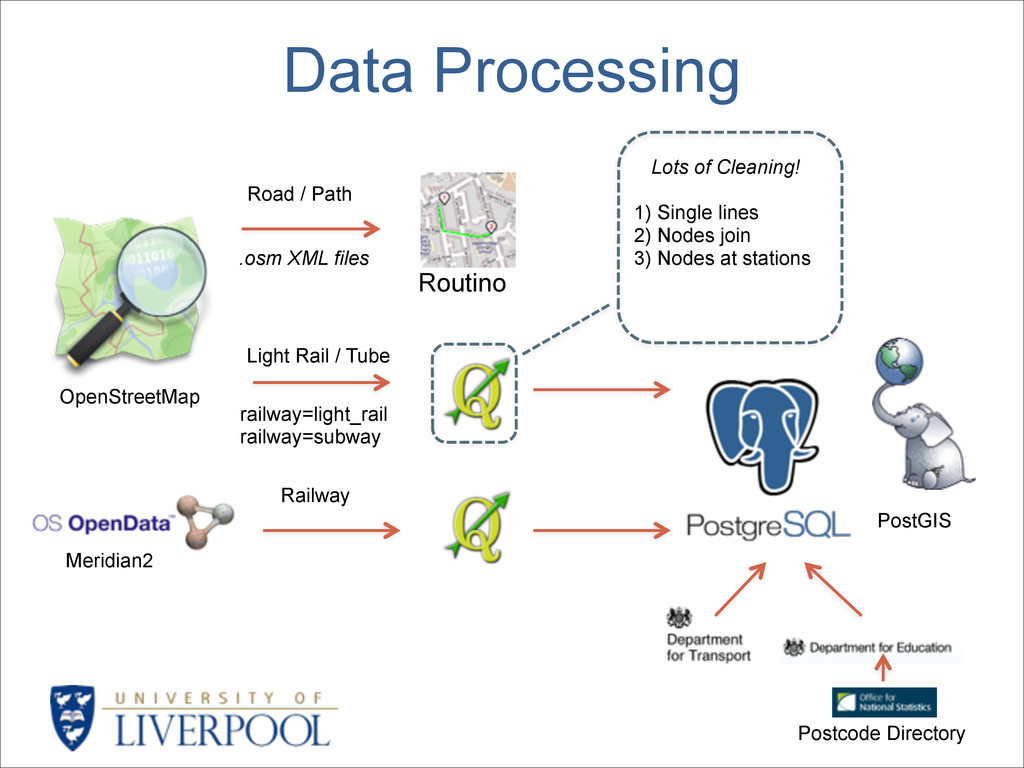
1) Query pupil (origin, destination, mode) Rail / Light Rail 2) Mode Choice? Road Pupil (distance, mode) 3) Car based? Yes Return LSOA Avg. CO2 g/km No Use type averages Pupil (distance, mode, CO2 g/km) 4) Implement the model
stop – route to school? • Multimodal journeys • Data issues – E.g. confusion in London (tube, rail, light rail) • Scaling issues – This all takes a very long time! • Temporal changes – Policy evaluation
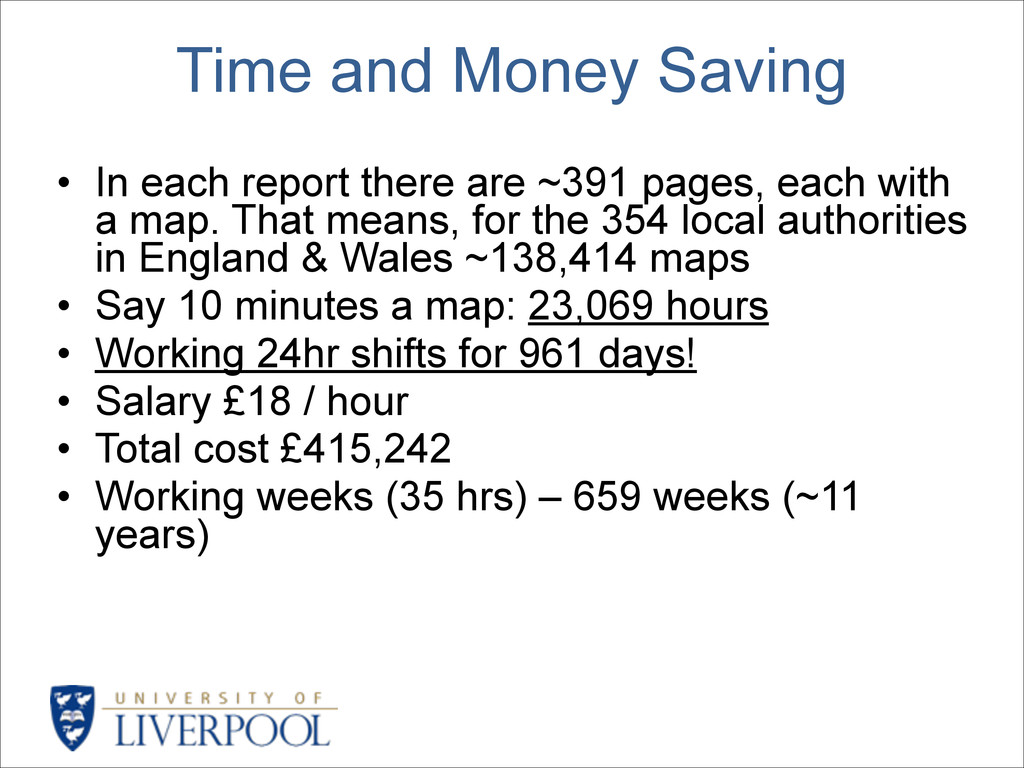
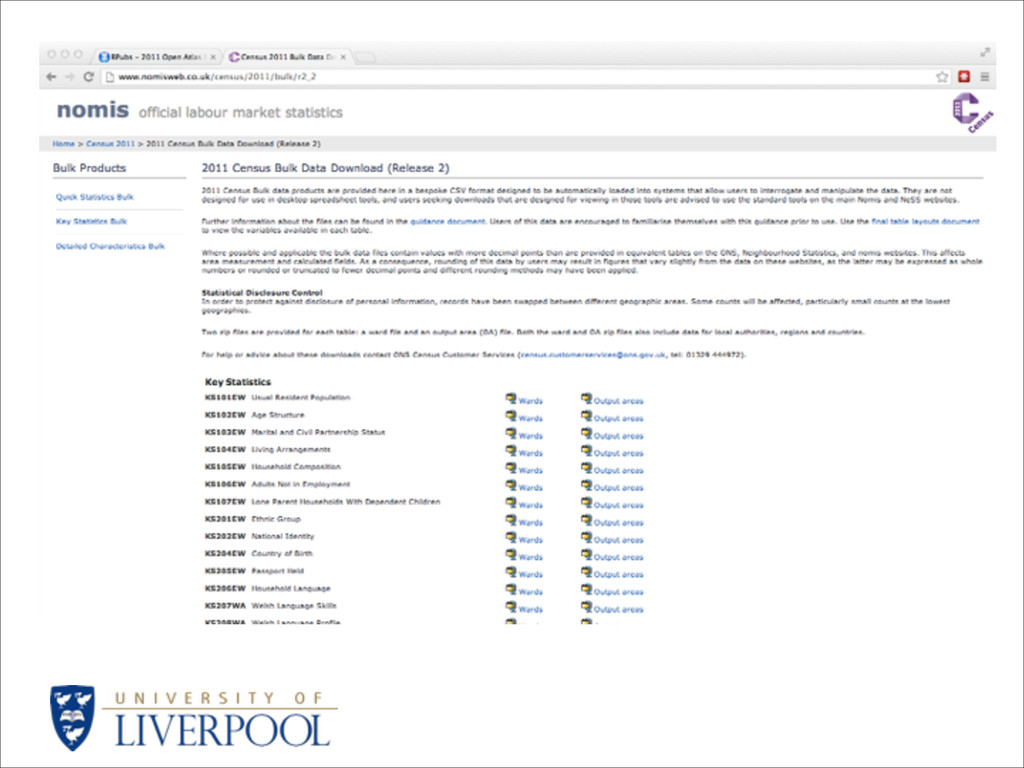
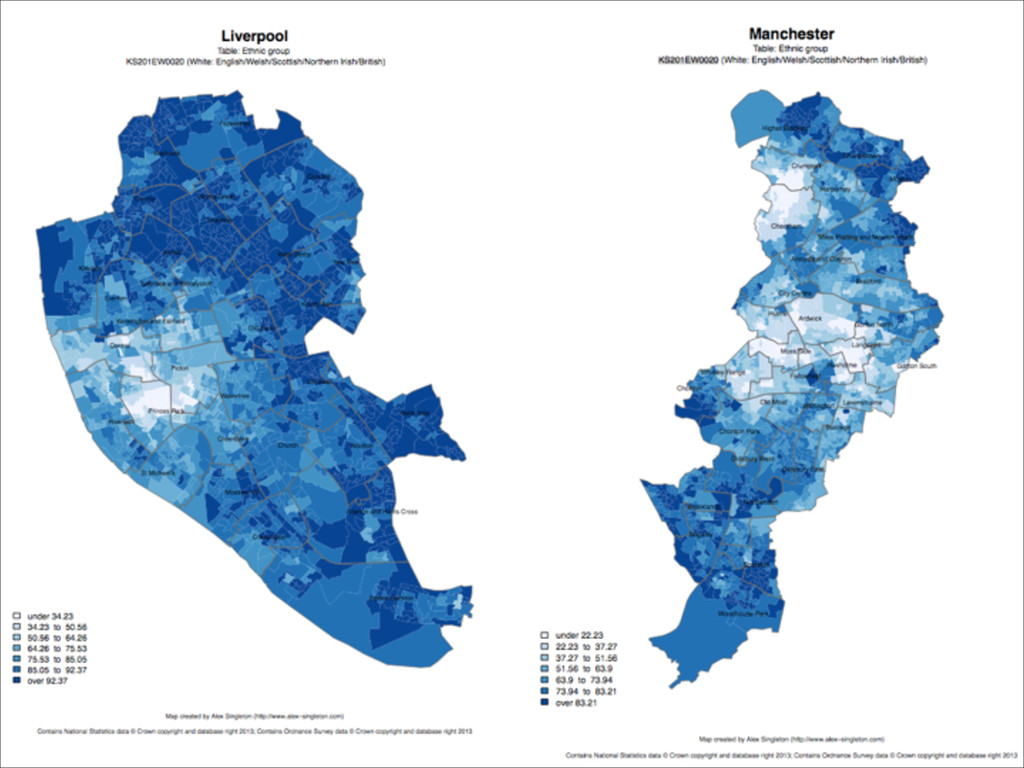
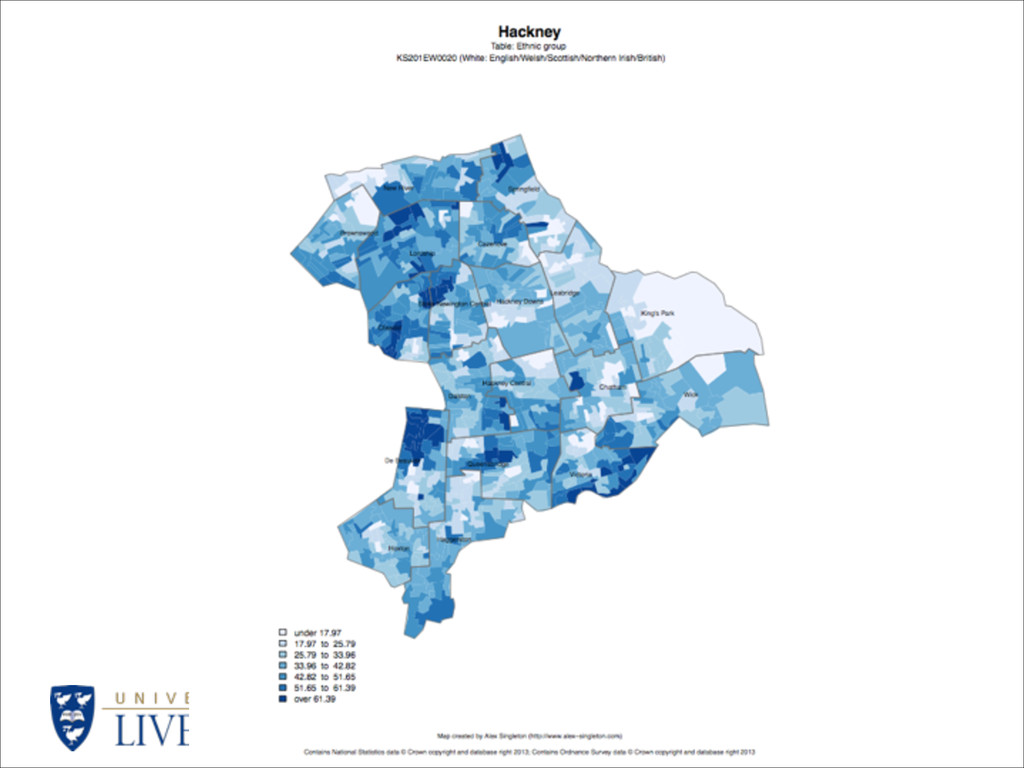
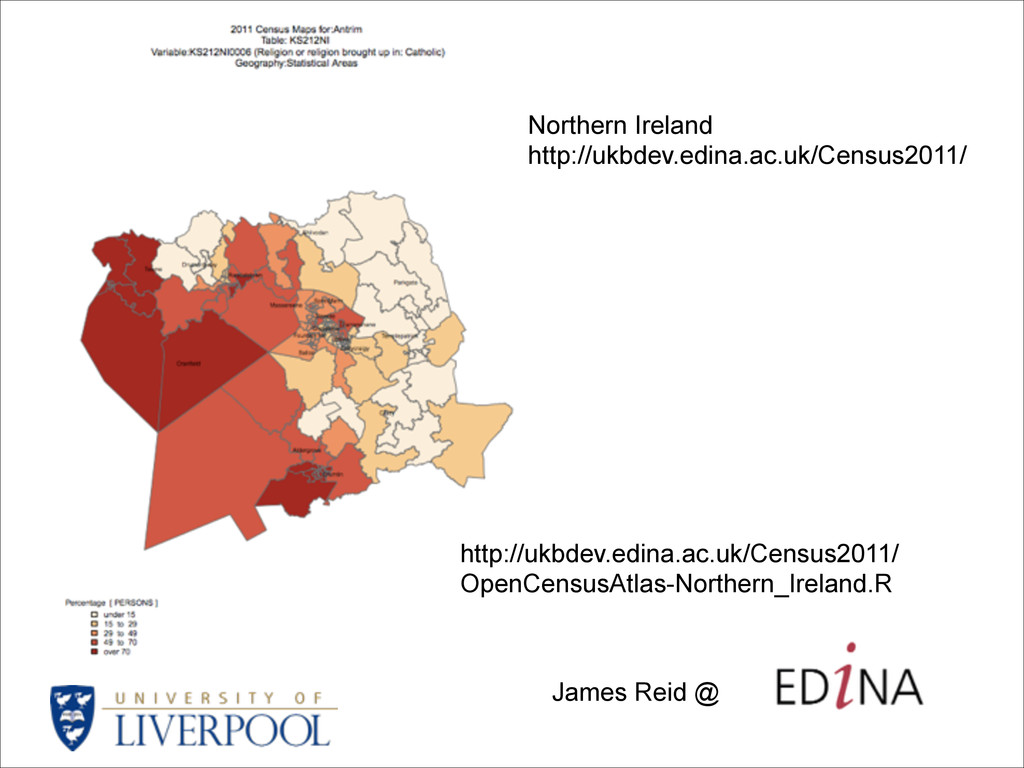
~391 pages, each with a map. That means, for the 354 local authorities in England & Wales ~138,414 maps • Say 10 minutes a map: 23,069 hours • Working 24hr shifts for 961 days! • Salary £18 / hour • Total cost £415,242 • Working weeks (35 hrs) – 659 weeks (~11 years)
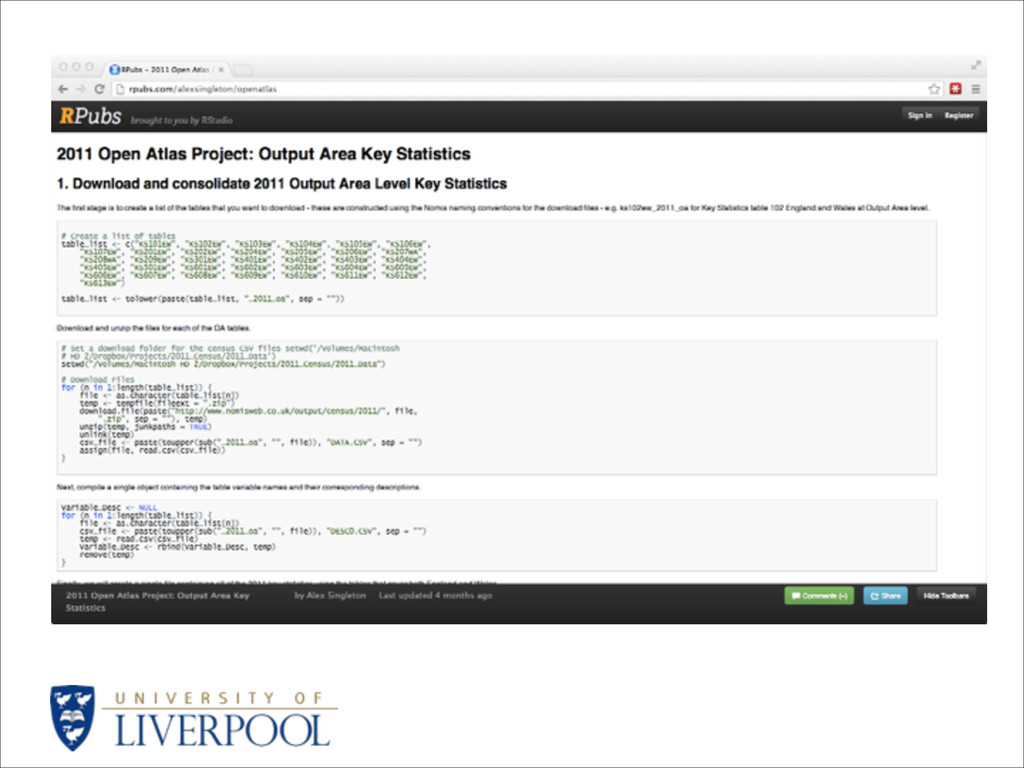
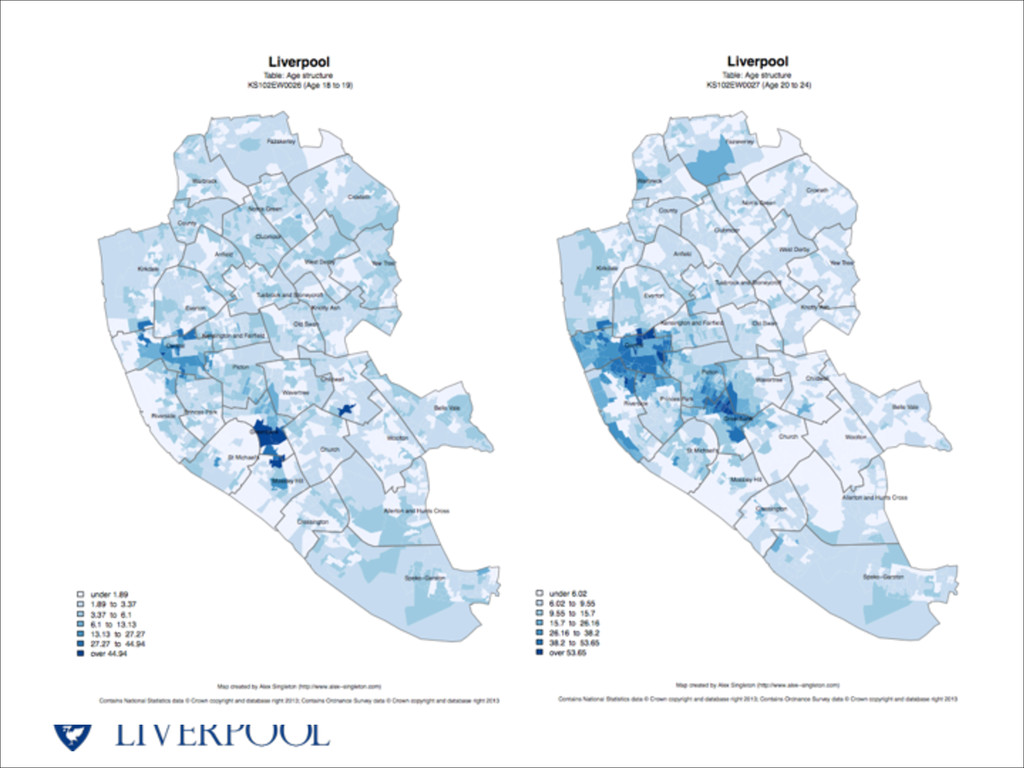
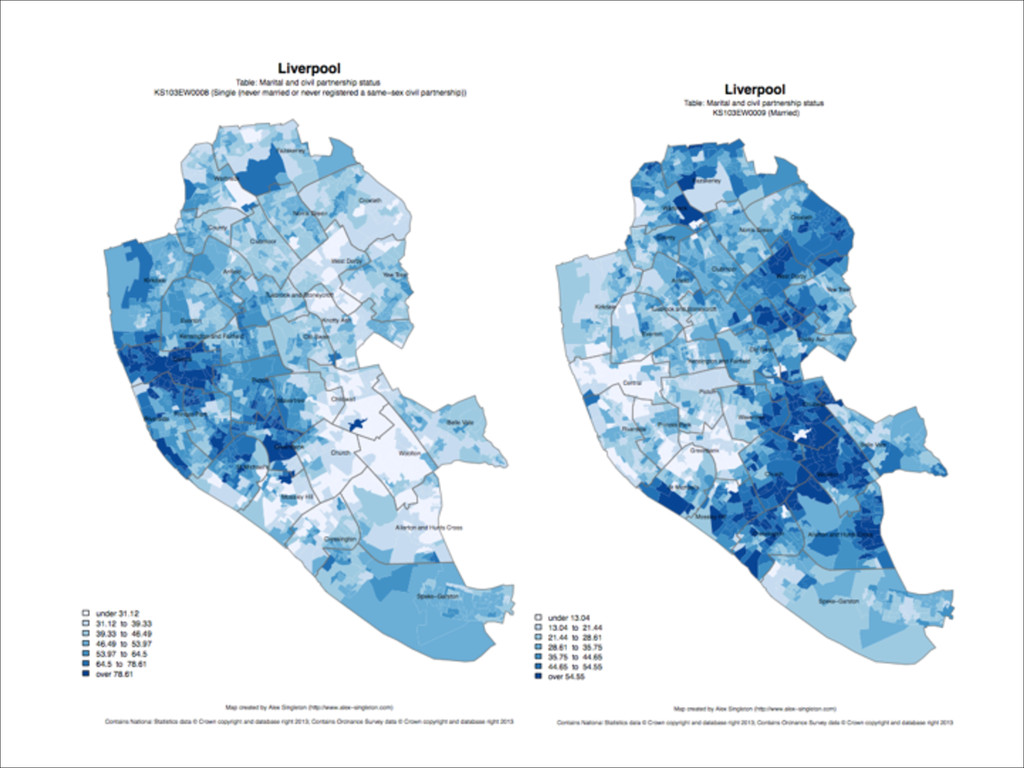
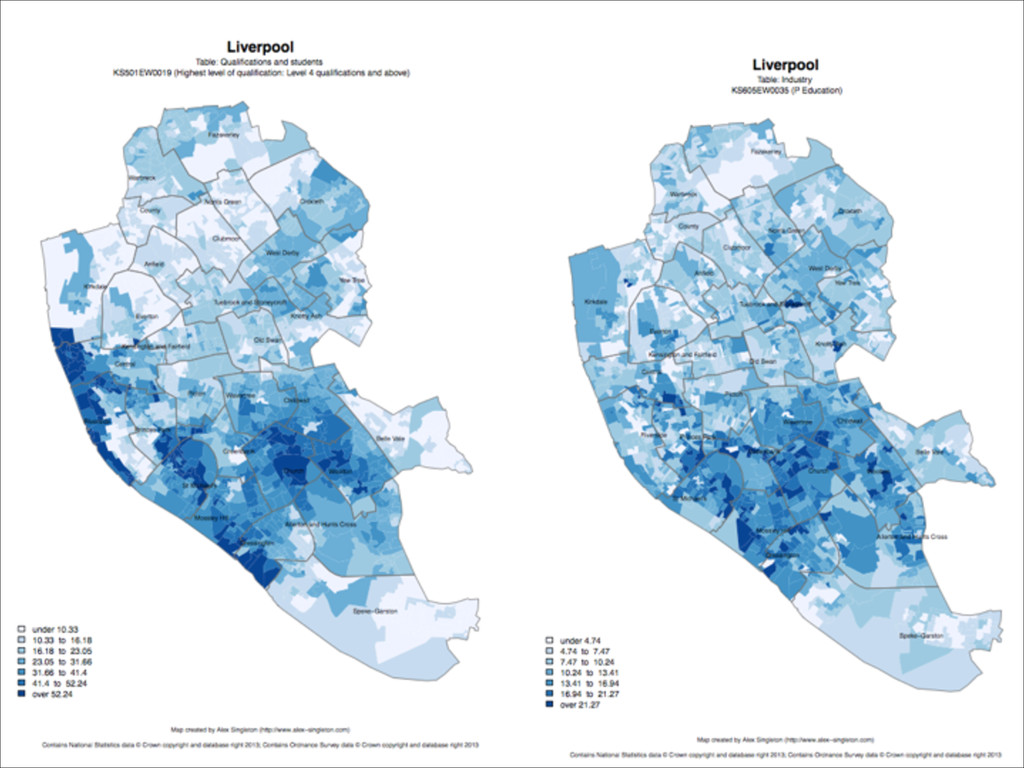
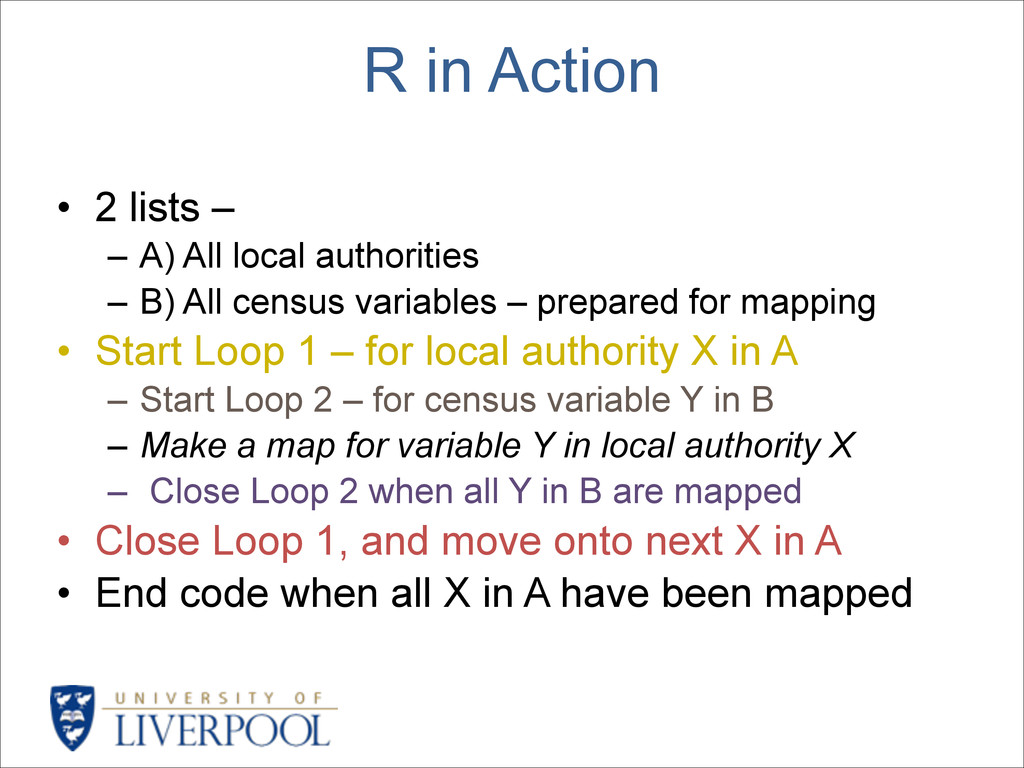
local authorities – B) All census variables – prepared for mapping • Start Loop 1 – for local authority X in A – Start Loop 2 – for census variable Y in B – Make a map for variable Y in local authority X – Close Loop 2 when all Y in B are mapped • Close Loop 1, and move onto next X in A • End code when all X in A have been mapped