Upgrade to Pro — share decks privately, control downloads, hide ads and more …

Webinar | An introduction to statistics in product management

Alpha
December 11, 2015

Webinar | An introduction to statistics in product management

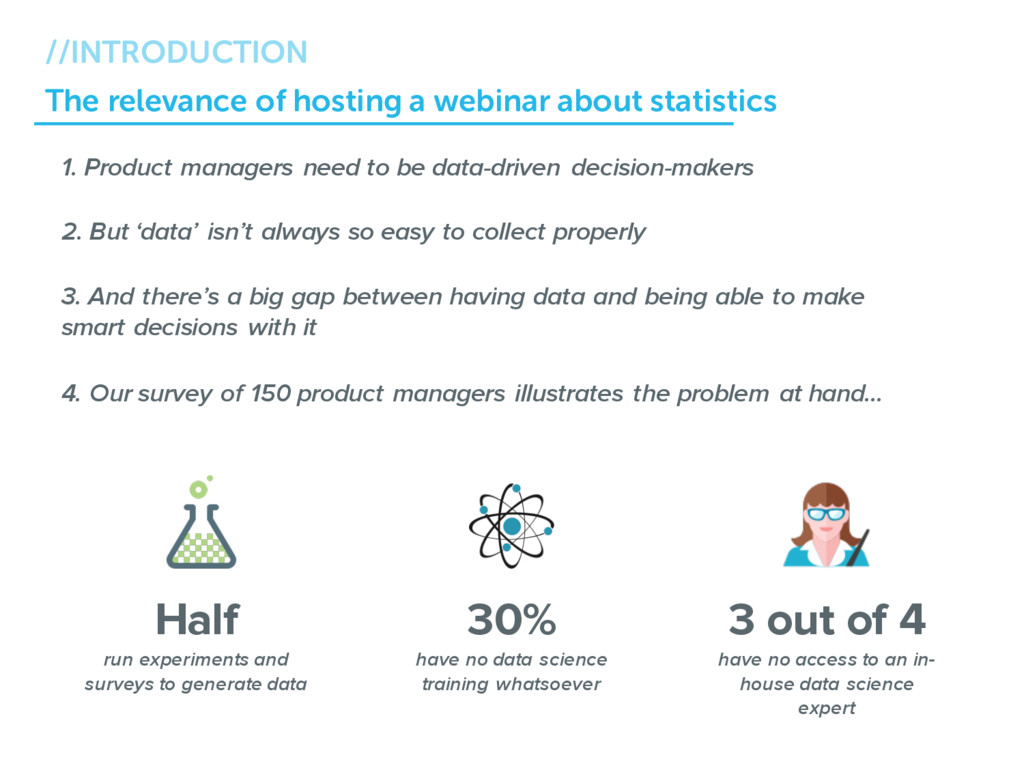
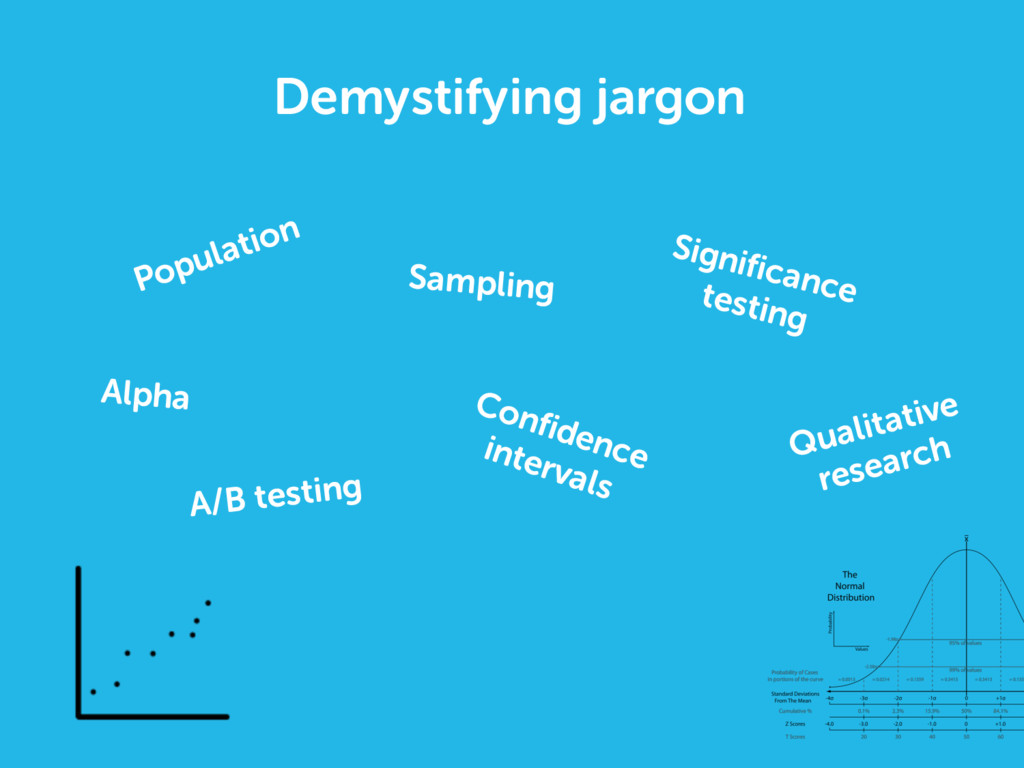
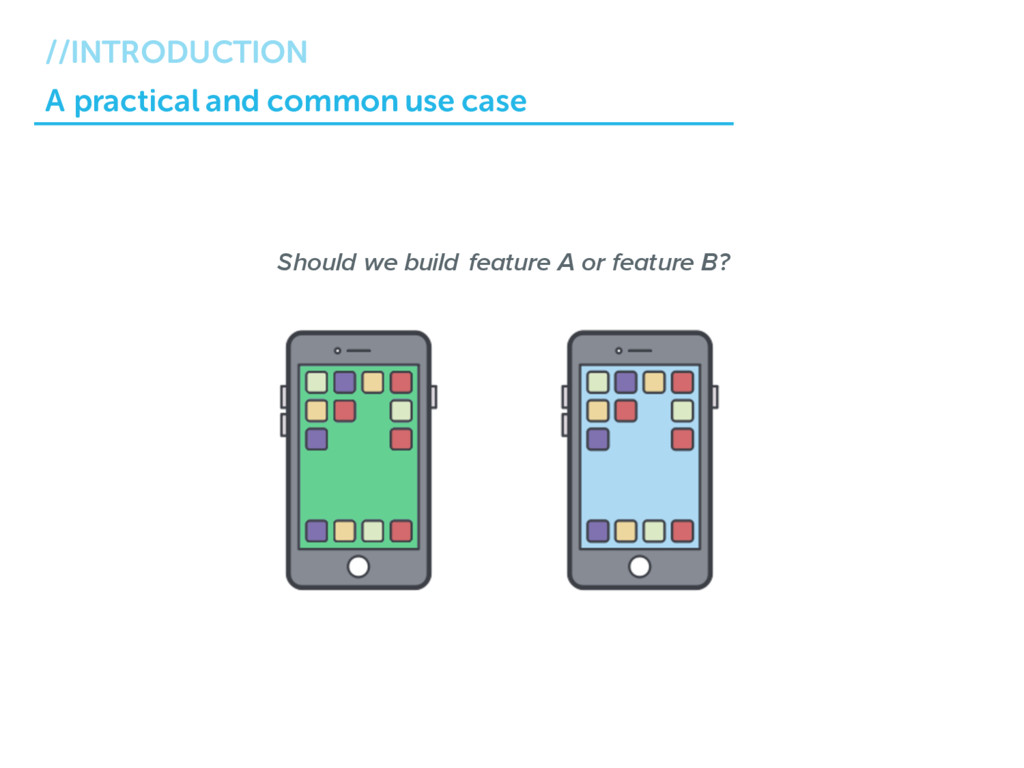
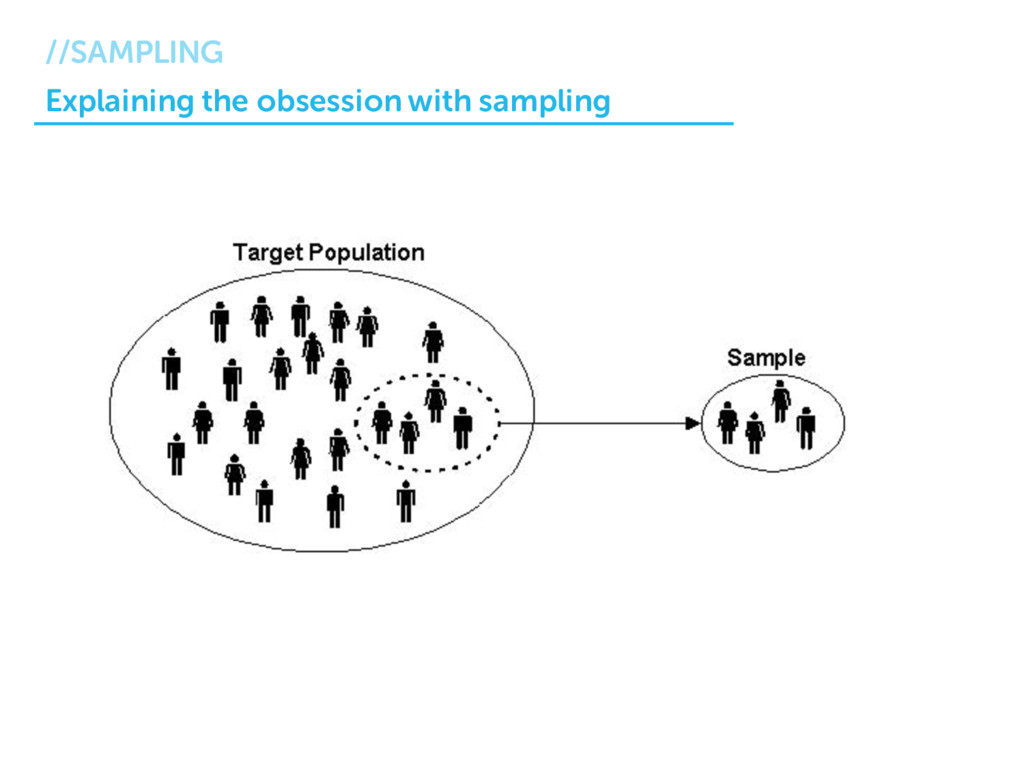
This webinar was hosted on Thursday, December 10, 2015 by Alpha UX and Frontier7. It explores high-level concepts in statistics to help product managers source accurate samples of users for running A/B tests and generating quantitative and qualitative data.

Alpha

December 11, 2015
Tweet

More Decks by Alpha

Other Decks in Business

Transcript

  1. An introduction to statistics in product management Naira Musallam, PhD.

    Co-founder at Frontier7 and Professor at NYU Tim Lawton Co-founder at Frontier7, formerly investment banker Michael Williams Head of Research at Alpha UX. Formerly product analytics at LearnVest From insider jargon to data-driven decision-making
  2. The relevance of hosting a webinar about statistics //INTRODUCTION 4.

    Our survey of 150 product managers illustrates the problem at hand… 30% have no data science training whatsoever 3 out of 4 have no access to an in- house data science expert Half run experiments and surveys to generate data 1. Product managers need to be data-driven decision-makers 2. But ‘data’ isn’t always so easy to collect properly 3. And there’s a big gap between having data and being able to make smart decisions with it
  3. Equation for determining the right sample size //SAMPLING Response Variability

    How similar or different you expect user preferences to be. Sample Accuracy How well your beta group represents your entire user base. Confidence Interval How willing you are to risk getting the wrong answer.
  4. Interpreting results: Confidence Interval //SIGNIFICANCE TESTING n = 1,000 Conversion

    rate = 50% n = 1,000 Conversion rate = 55% Scenario: 99% confidence interval Permitted overlap
  5. Interpreting results: Confidence Interval //SIGNIFICANCE TESTING n = 1,000 Conversion

    rate = 50% n = 1,000 Conversion rate = 55% Scenario: 80% confidence interval Permitted overlap
  6. Interpreting results: Response Variability //SIGNIFICANCE TESTING n = 100 Conversion

    rate = 50% n = 100 Conversion rate = 51% Scenario: Low variability
  7. Interpreting results: Response Variability //SIGNIFICANCE TESTING n = 100 Conversion

    rate = 50% n = 100 Conversion rate = 70% Scenario: High variability
  8. Interpreting results: Sample Size //SIGNIFICANCE TESTING n = 100 Conversion

    rate = 50% n = 100 Conversion rate = 55% Scenario: Small sample size
  9. Interpreting results: Sample Size //SIGNIFICANCE TESTING n = 100,000 Conversion

    rate = 50% n = 100,000 Conversion rate = 55% Scenario: Huge sample size
  10. Statistical significance vs. practical significance //SIGNIFICANCE TESTING Imagine if… You’re

    99.9% confident that Feature A is better than Feature B, but the expected outcome is an increase in revenue of only $5.
  11. Why, when, and how to mix in qualitative data //MIXED

    METHODS RESEARCH Compare results from independent research: Provide more context to quantitative findings: Initial understanding to inform future quantitative research:
  12. Substantiation through iteration //MIXED METHODS RESEARCH Simply put, you will

    get better results. Increased integrity Better context Offset weaknesses
  13. Topics for future webinars //WHAT’S NEXT Having walked through a

    common use case, we’ve given a high-level explanation of: • Sampling • Confidence levels • Significance testing • Qualitative research Building on these topics, we soon hope to announce webinars for: Cohort analysis SQL / Excel analytics Funnel optimization
  14. Automation of data processing and analysis allows for the extraction

    of continuous insights Tim Lawton [email protected] (508) 930-3218 For more information please contact us: Naira Musallam [email protected] (646) 659-4810 www.frontier7.com
  15. The Confidence Interval Method of Determining Sample Size • The

    relationship between sample size and sample error:
  16. With Nominal data (i.e. Yes, No), we can conceptualize answer

    variability with bar charts…the highest variability is 50/50
  17. 33 Design Considerations Approach Type Purpose Limitations Resolutions QUAL +

    quan Simultaneous Enrich description of sample Qualitative sample Utilize normative data for comparison of results QUAL Sequential Test emerging H, determine distribution of phenomenon in population Qualitative sample Draw adequate random sample from same population QUAN + qual Simultaneous To describe part of phenomena that cannot be quantified Quantitative sample Select appropriate theoretical sample from random sample QUAN Sequential To examine unexpected results Quantitative sample Select appropriate theoretical sample from random sample quan qual