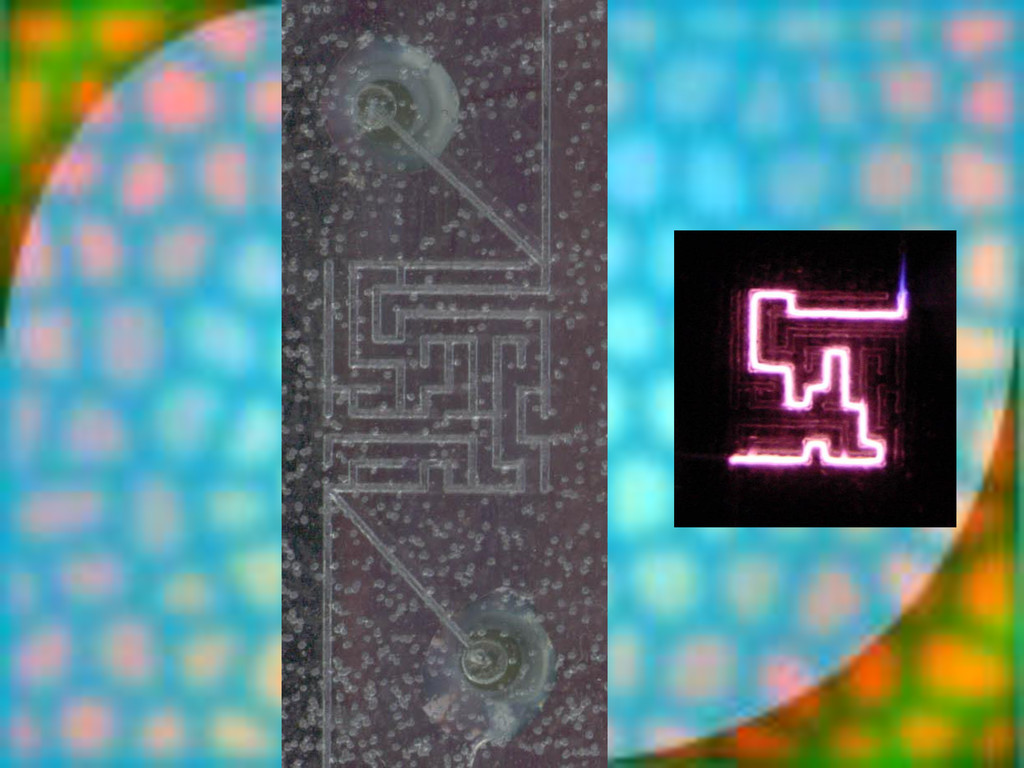
Chemical reactions chemical reactions.ppt [PCR] pcr.ppt Bioreactor antibiotics.ppt Detection methods detection methods.ppt Analog computing analog computing.ppt
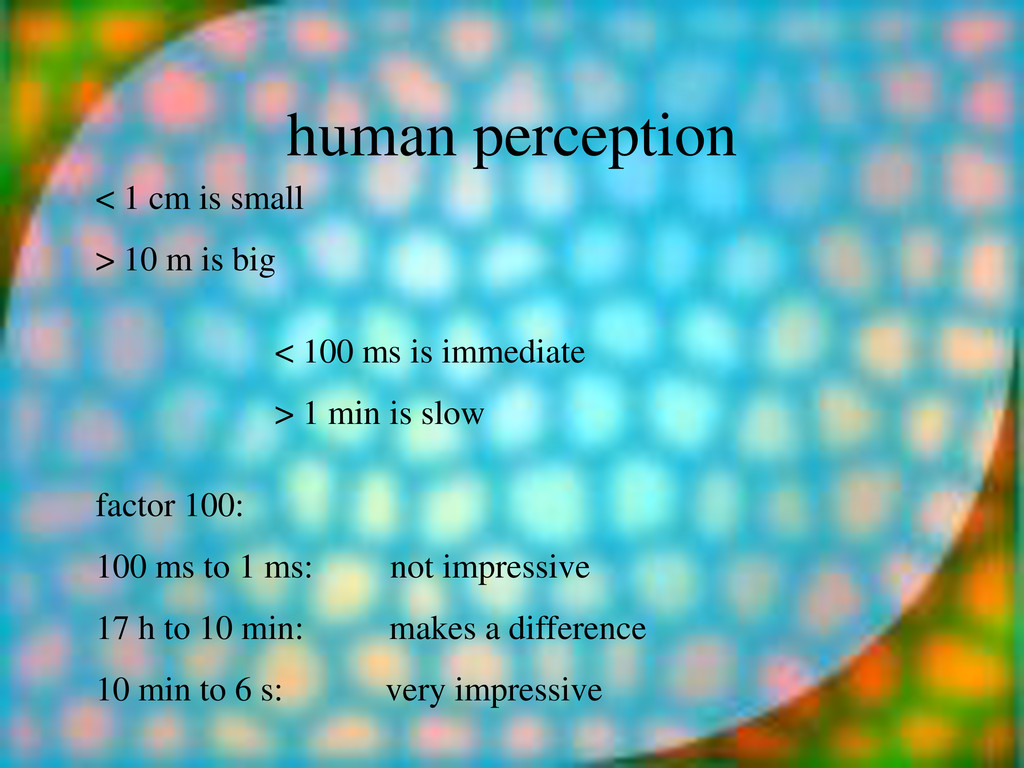
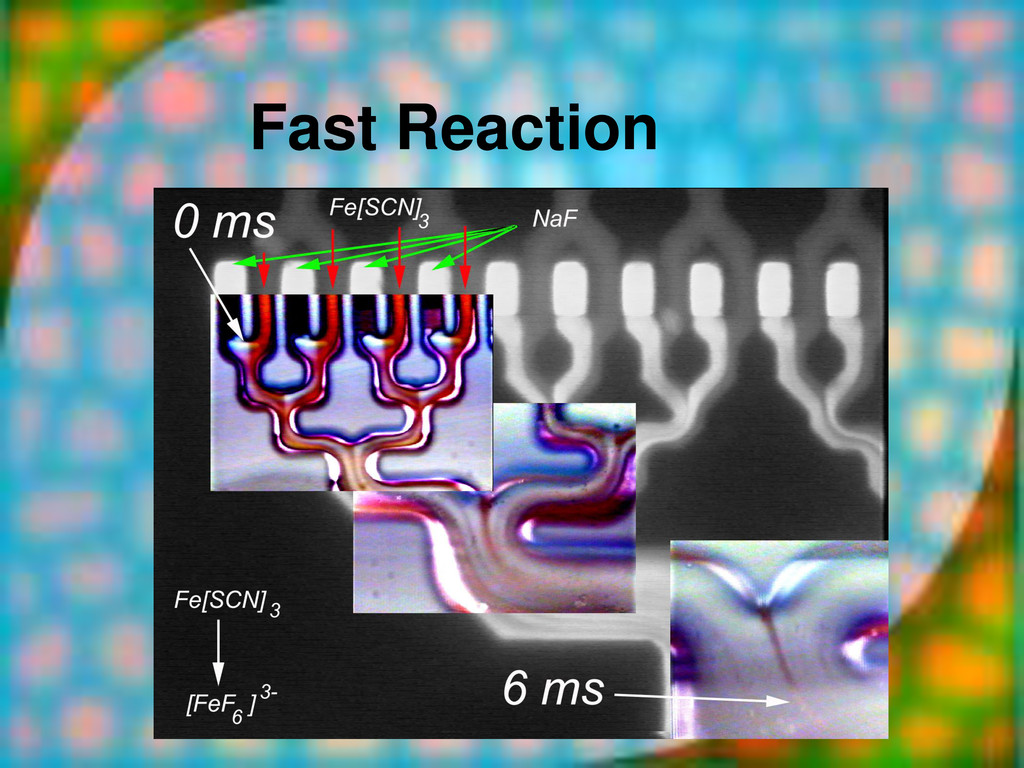
is big < 100 ms is immediate > 1 min is slow factor 100: 100 ms to 1 ms: not impressive 17 h to 10 min: makes a difference 10 min to 6 s: very impressive
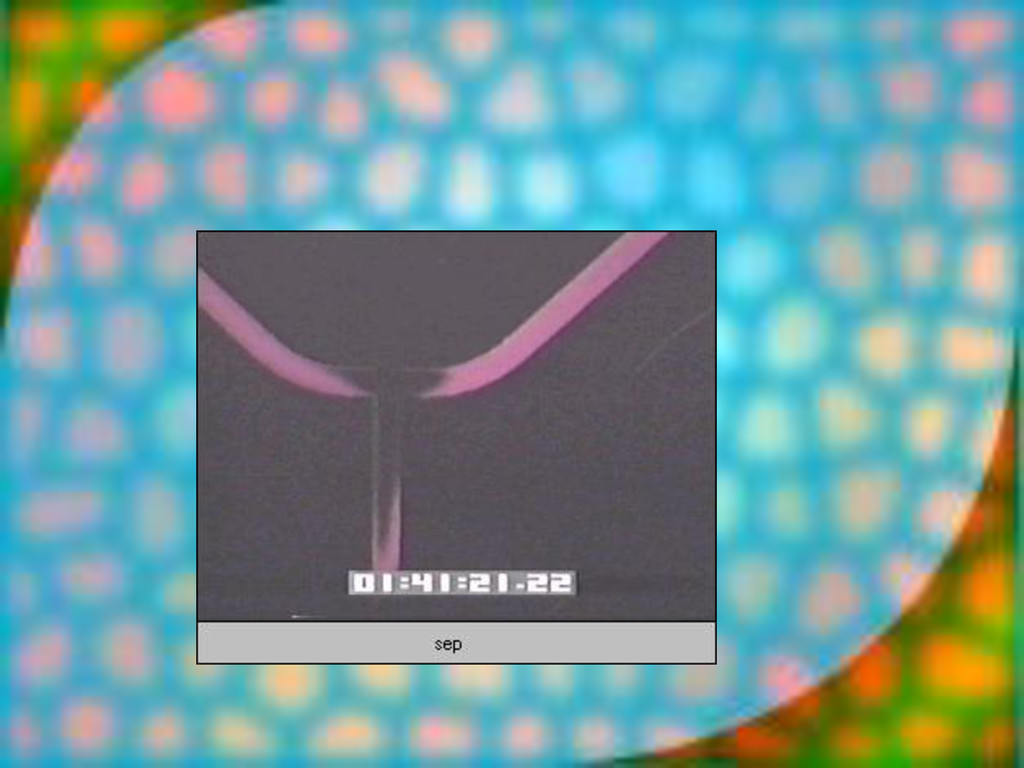
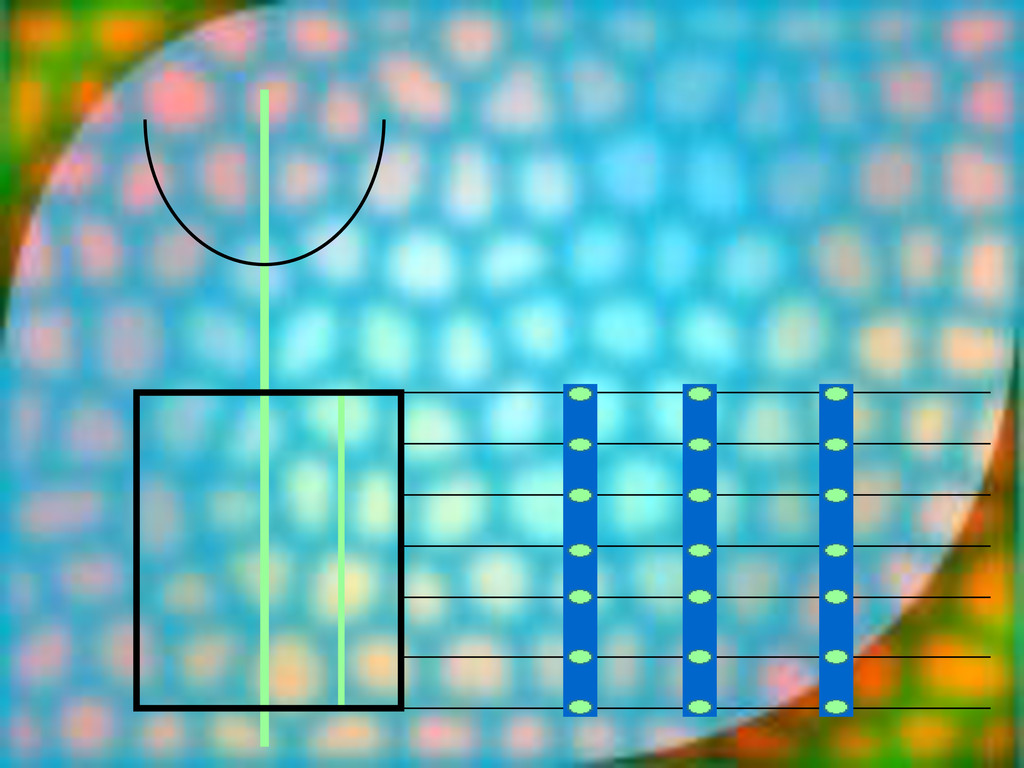
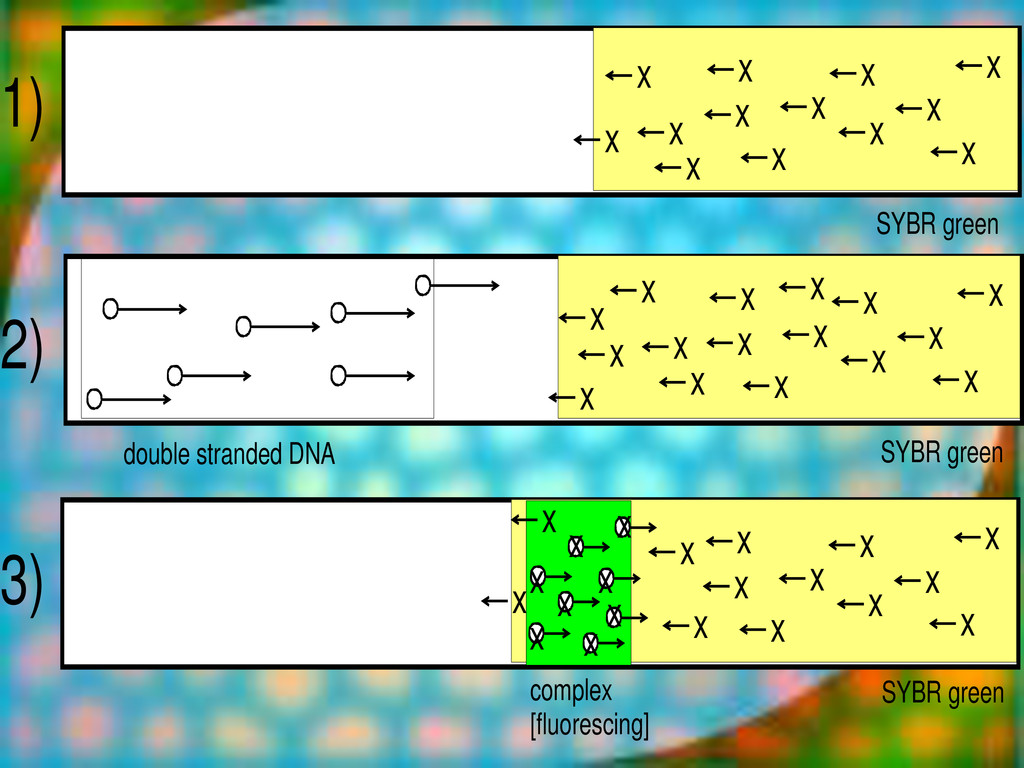
green x x x x x x x x x x x x x double stranded DNA SYBR green x x x x x x x x x x x x x x x x x x x x x x x x SYBR green complex [fluorescing] x x x x 1) 2) 3)
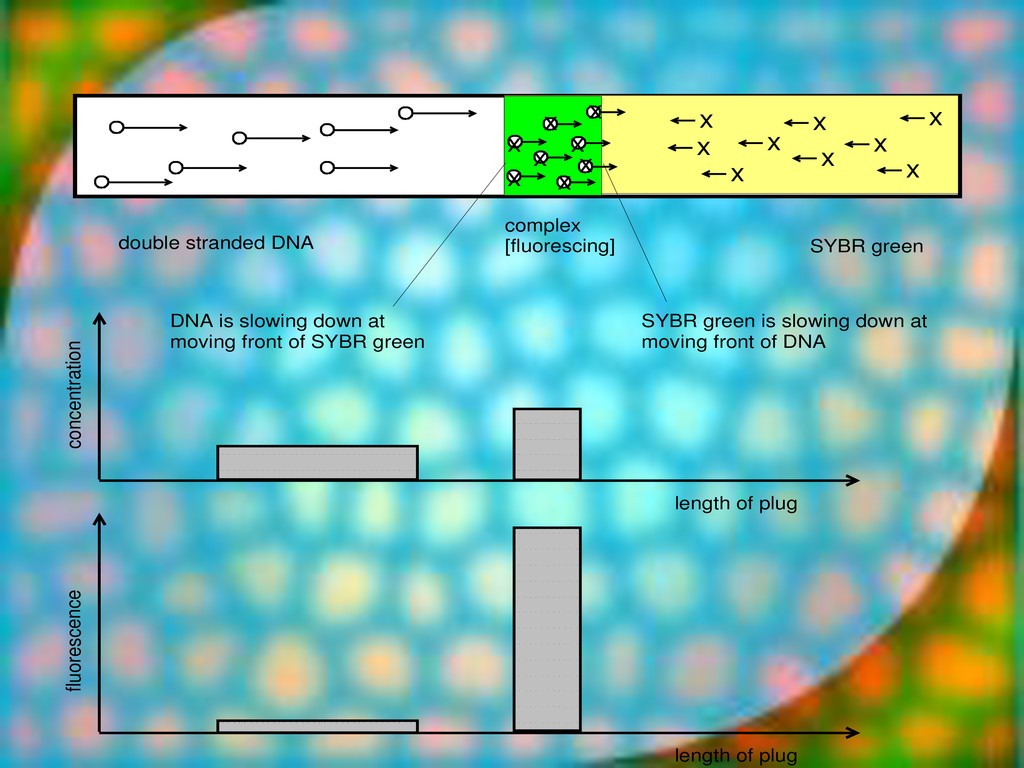
x x x x x x x double stranded DNA SYBR green complex [fluorescing] concentration length of plug DNA is slowing down at moving front of SYBR green SYBR green is slowing down at moving front of DNA fluorescence length of plug
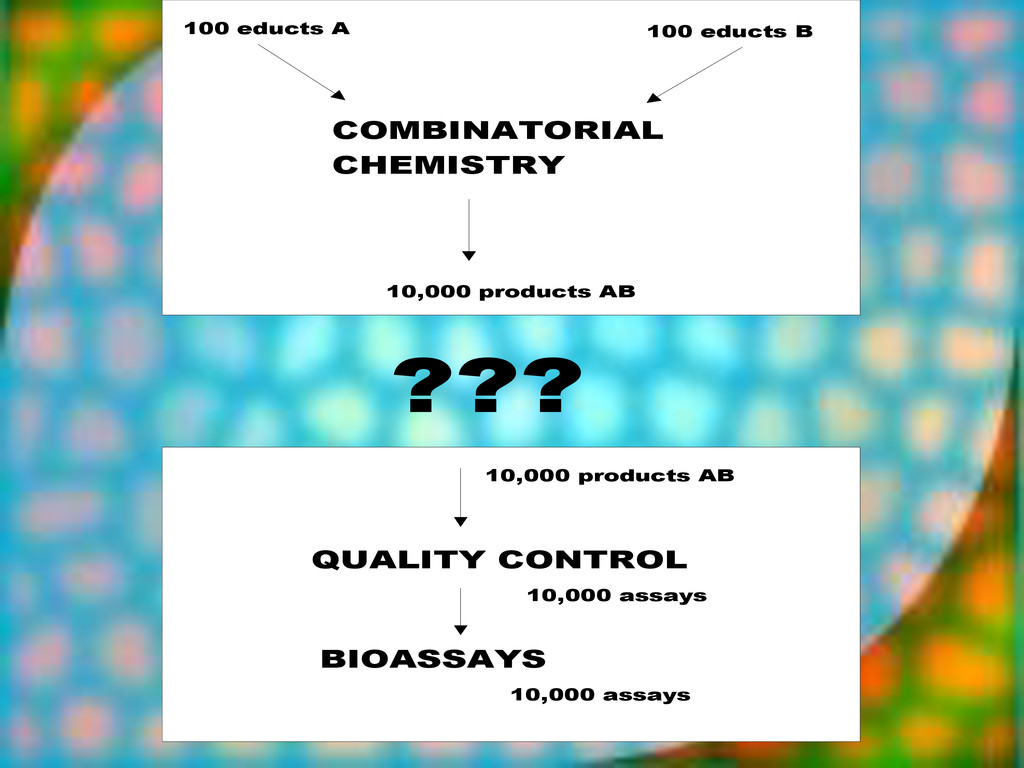
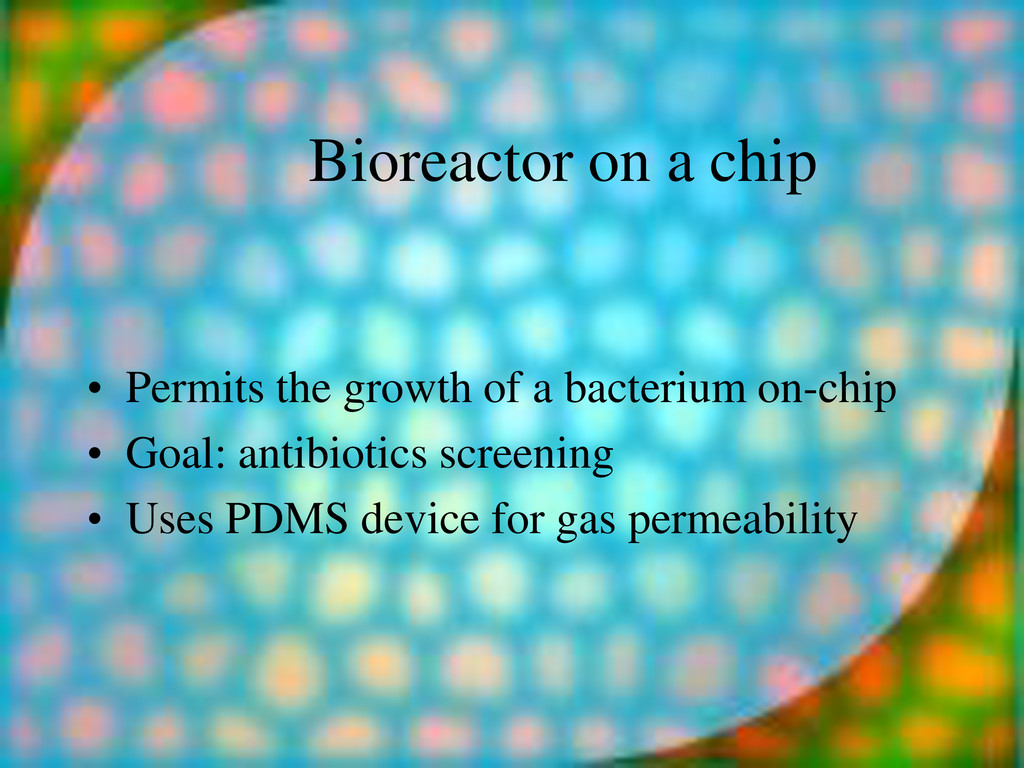
• composed of – synthesis of new compound – isolation, characterisation – bioassay • a significant effort in pharmaceutical industry, involving new technologies
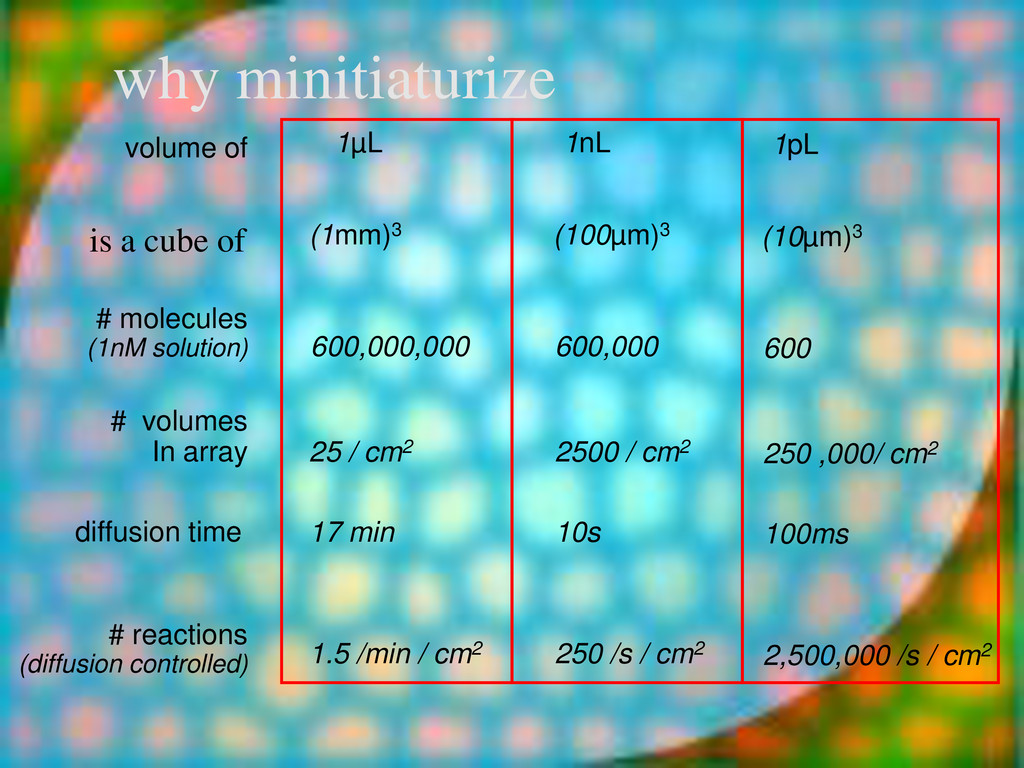
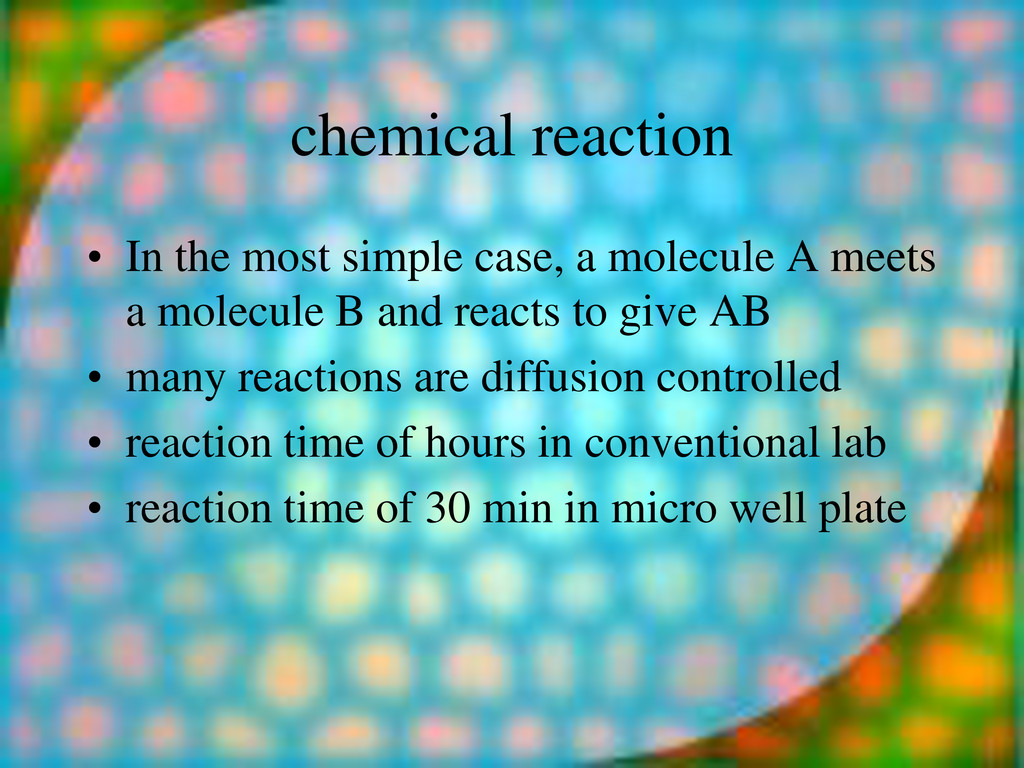
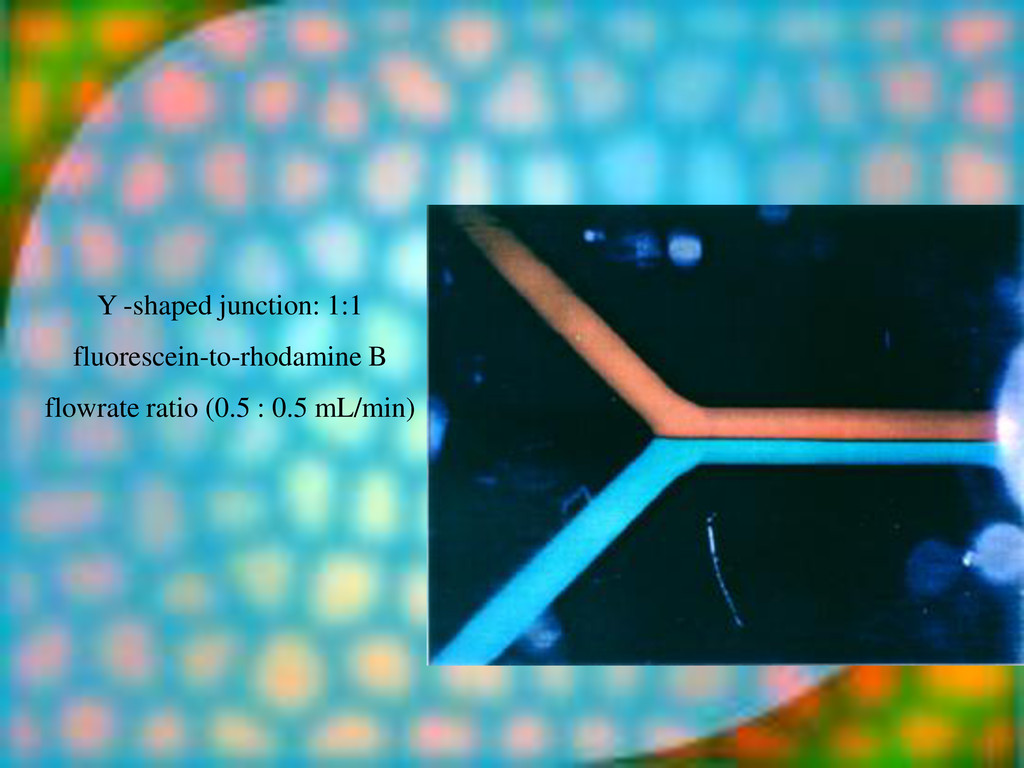
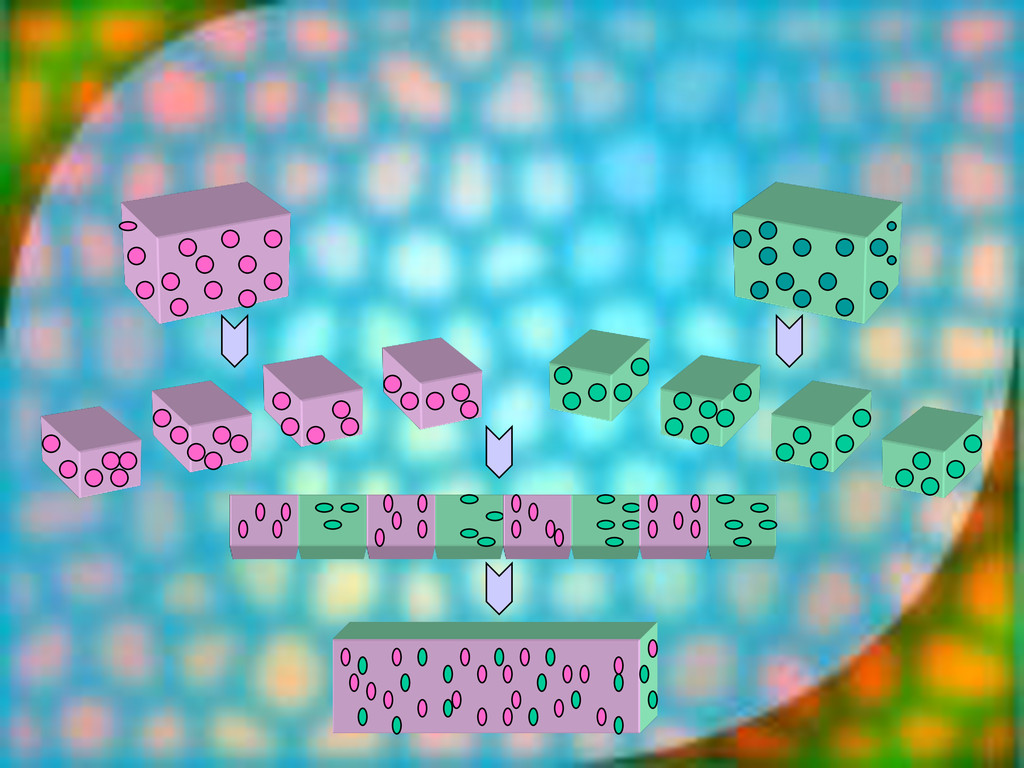
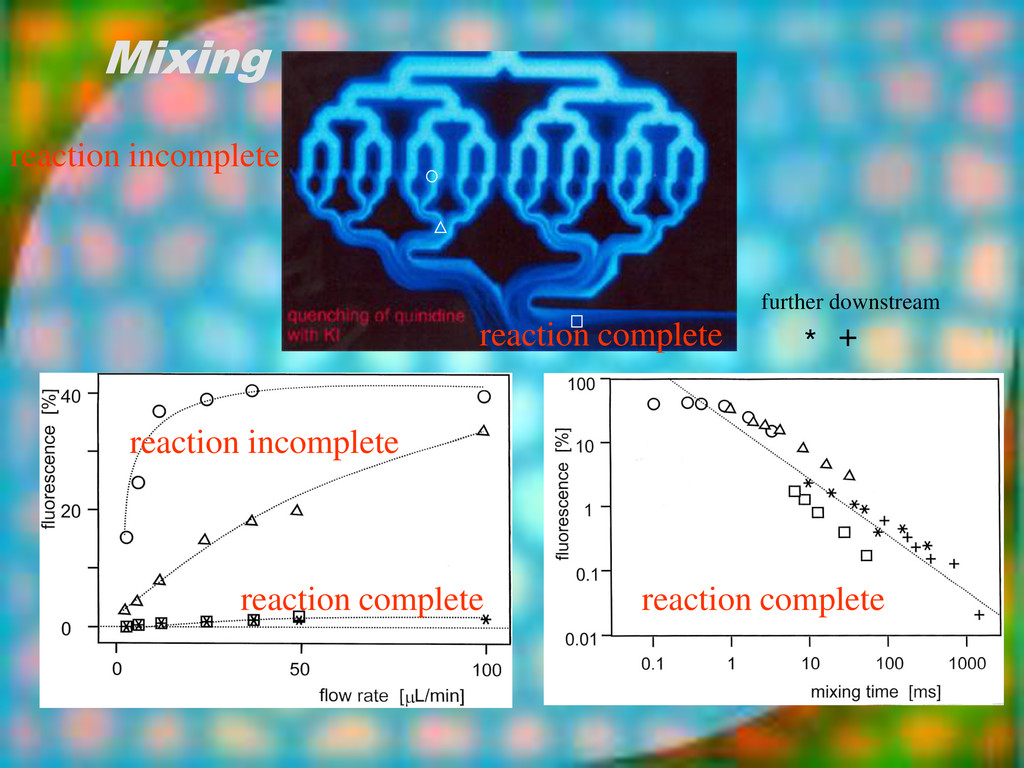
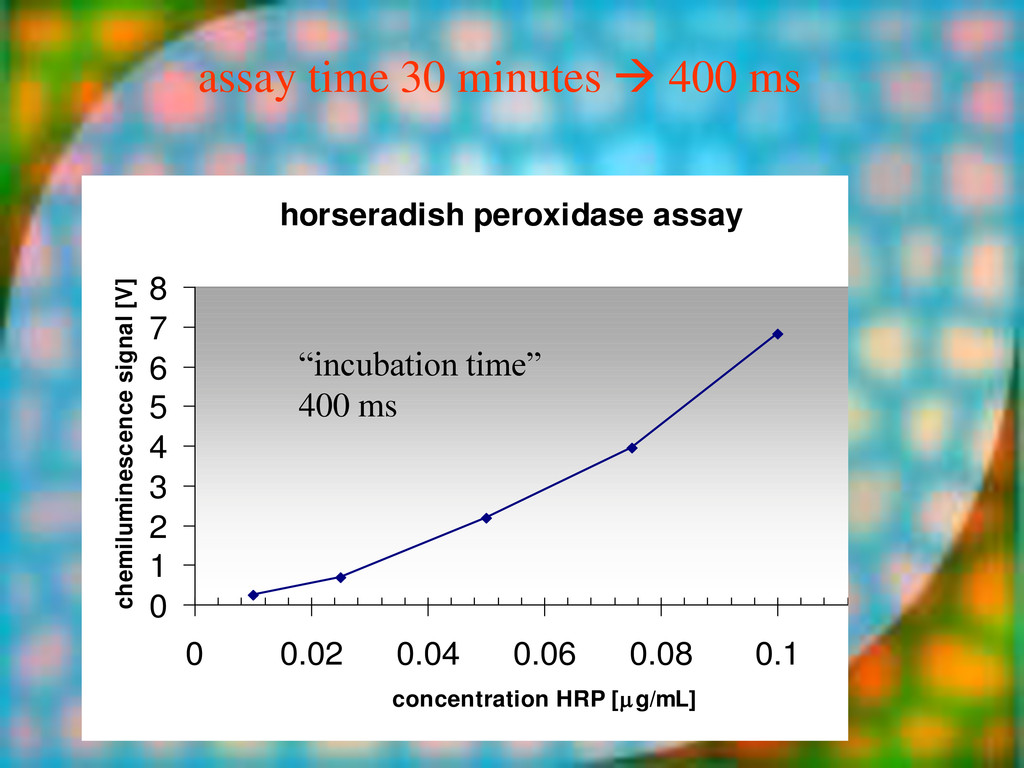
A meets a molecule B and reacts to give AB • many reactions are diffusion controlled • reaction time of hours in conventional lab • reaction time of 30 min in micro well plate
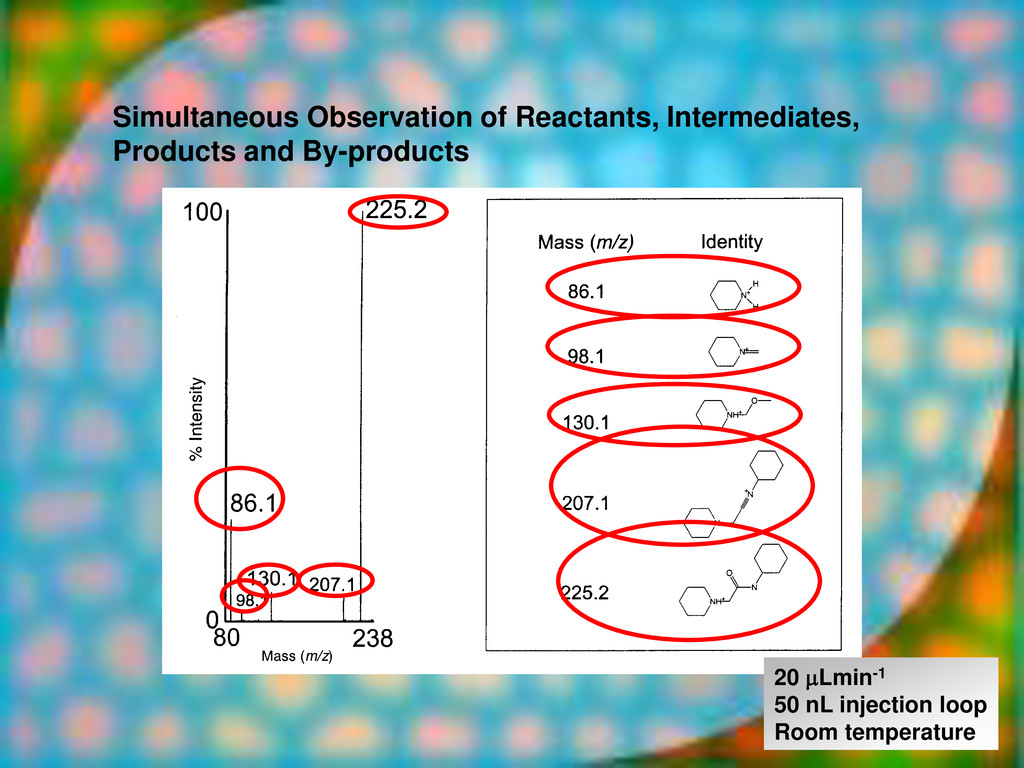
phosphonium brom ide p-nitrobenza ldehyde colourless NaOMe NO2 Me OH colourless P(Ph)3 + + Wittig reaction N + O O Cl Cl Cl Cl O O Cl Cl Cl N Enamine Chloranil blue 2,3,5-trichlor-6-(2-piperidin -1-yl)-[1,4]- benzoquinone Synthesis of a substituted aminovinyl-p-quinone SYNTHESIS
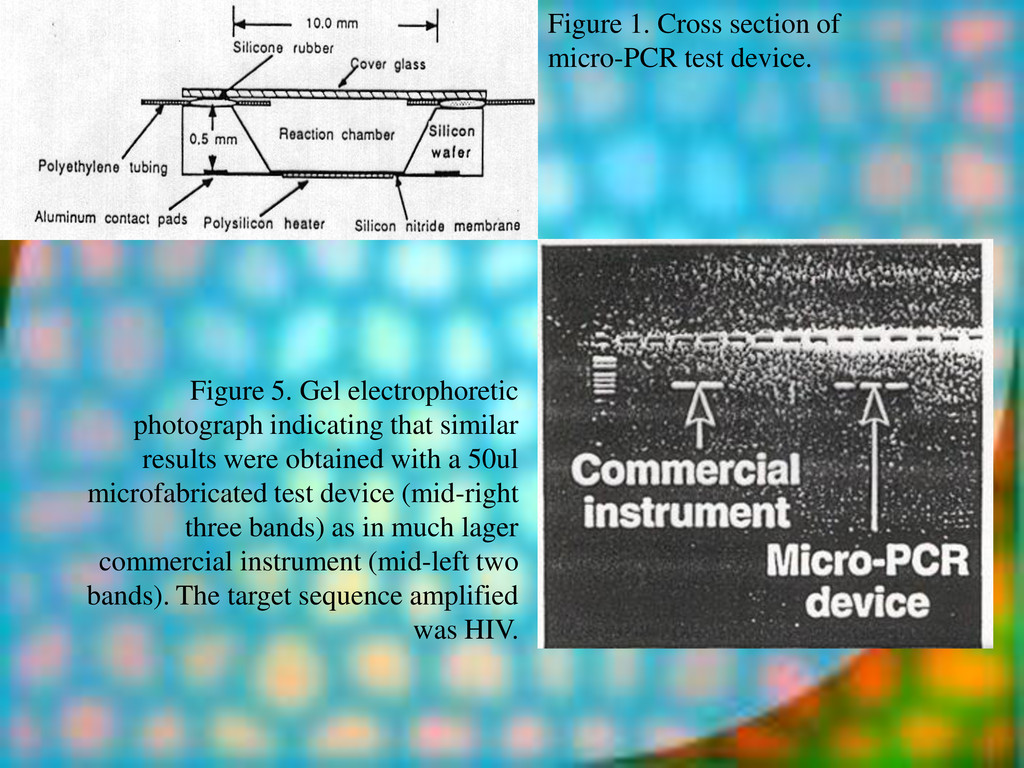
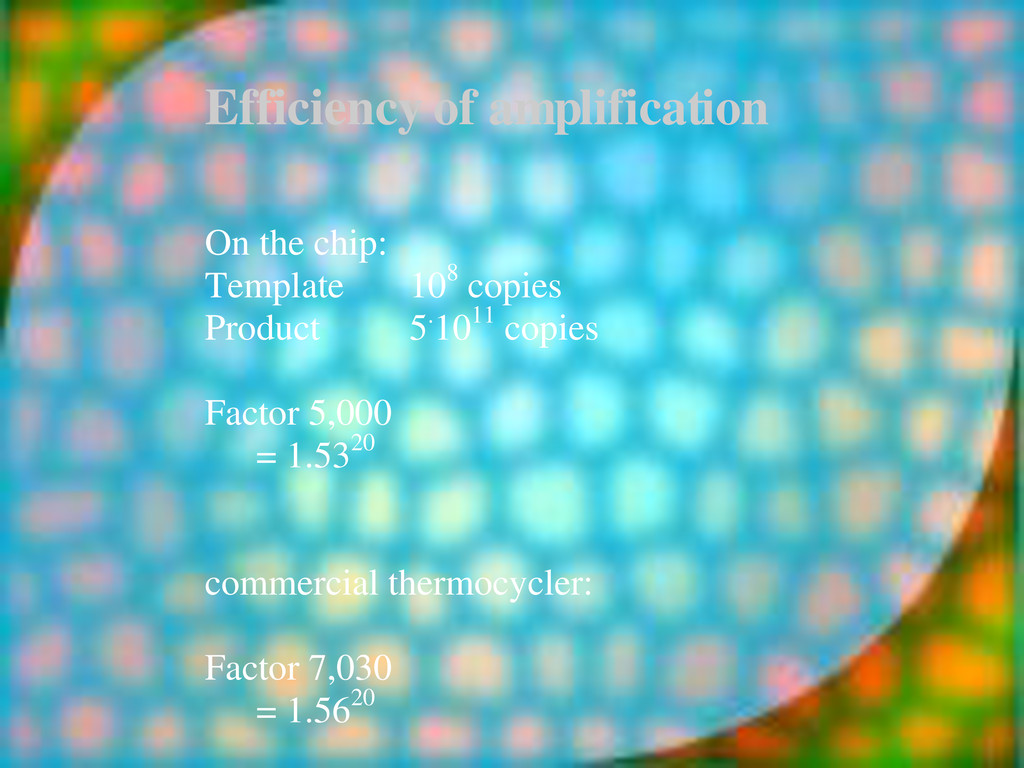
of a specific DNA sequence in a sample • each cycle doubles the amount of DNA • most commonly used procedure in biology • commercial instruments would do 20 cycles in 50 minutes
Gel electrophoretic photograph indicating that similar results were obtained with a 50ul microfabricated test device (mid-right three bands) as in much lager commercial instrument (mid-left two bands). The target sequence amplified was HIV.
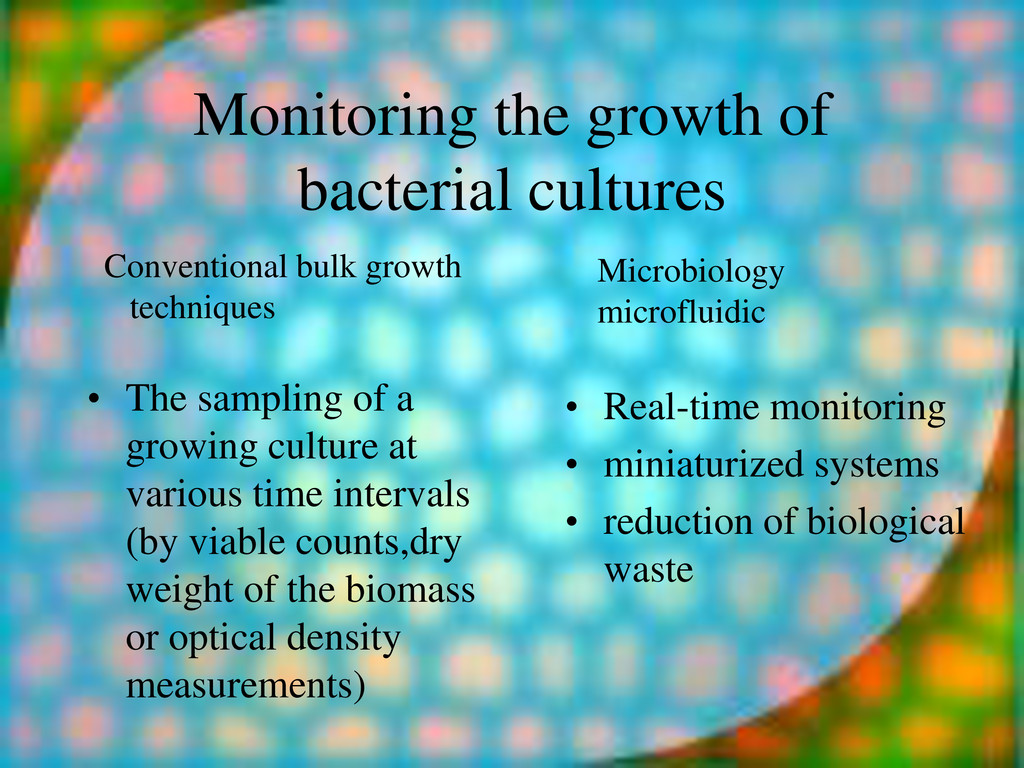
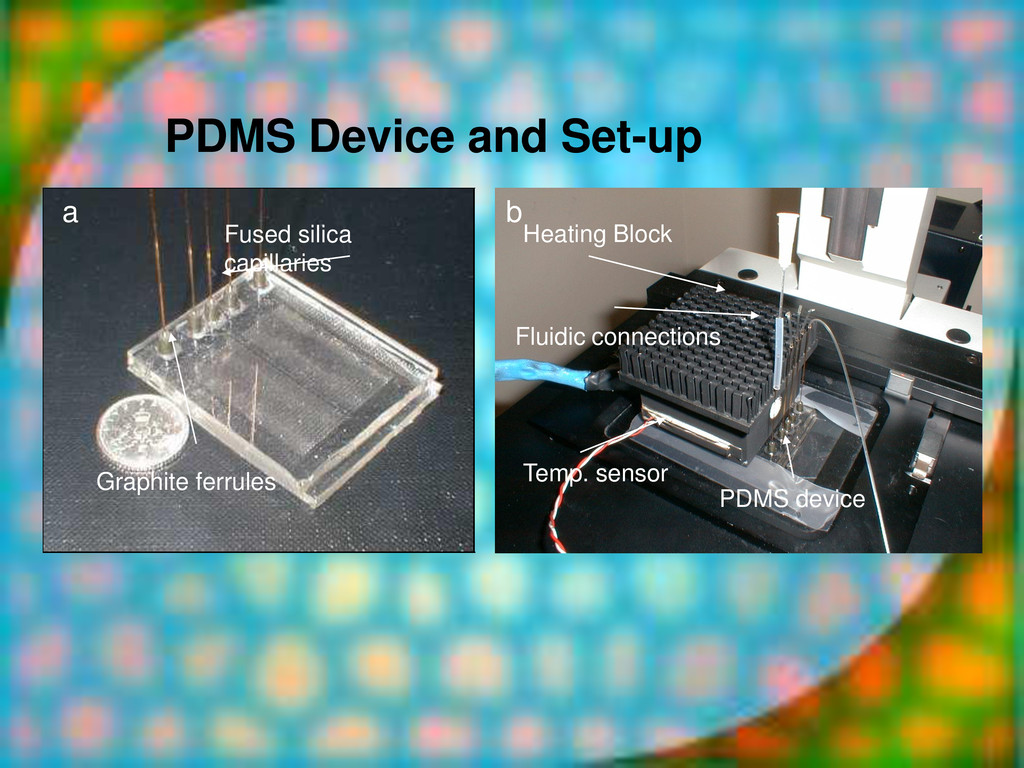
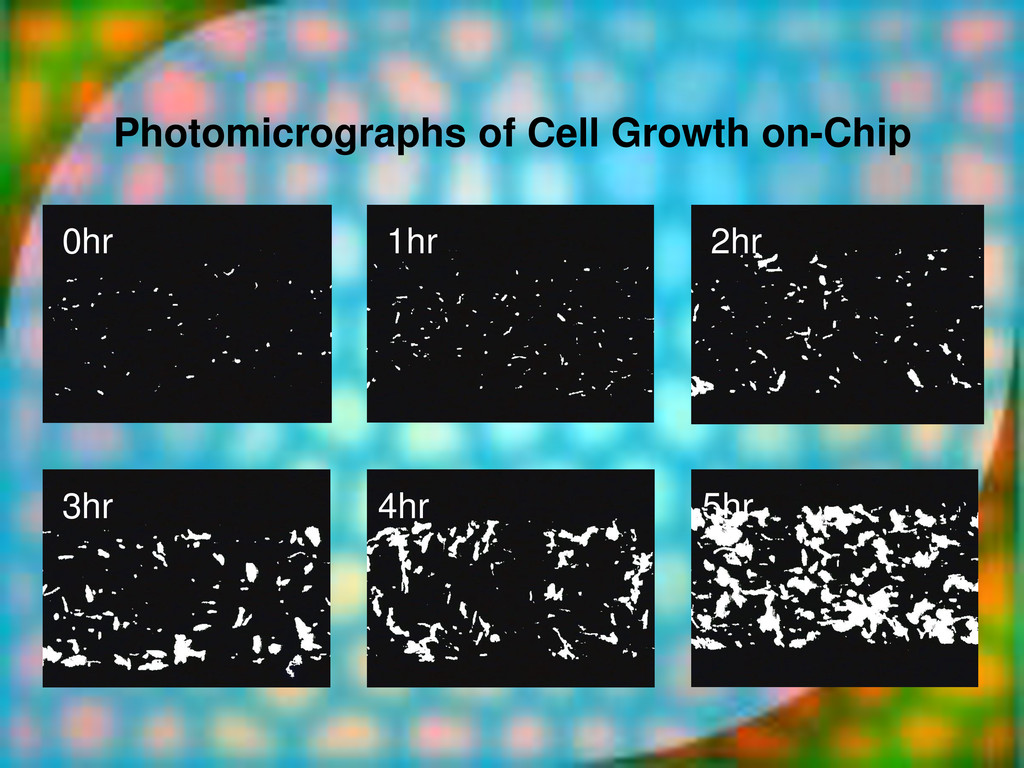
a growing culture at various time intervals (by viable counts,dry weight of the biomass or optical density measurements) • Real-time monitoring • miniaturized systems • reduction of biological waste Conventional bulk growth techniques Microbiology microfluidic
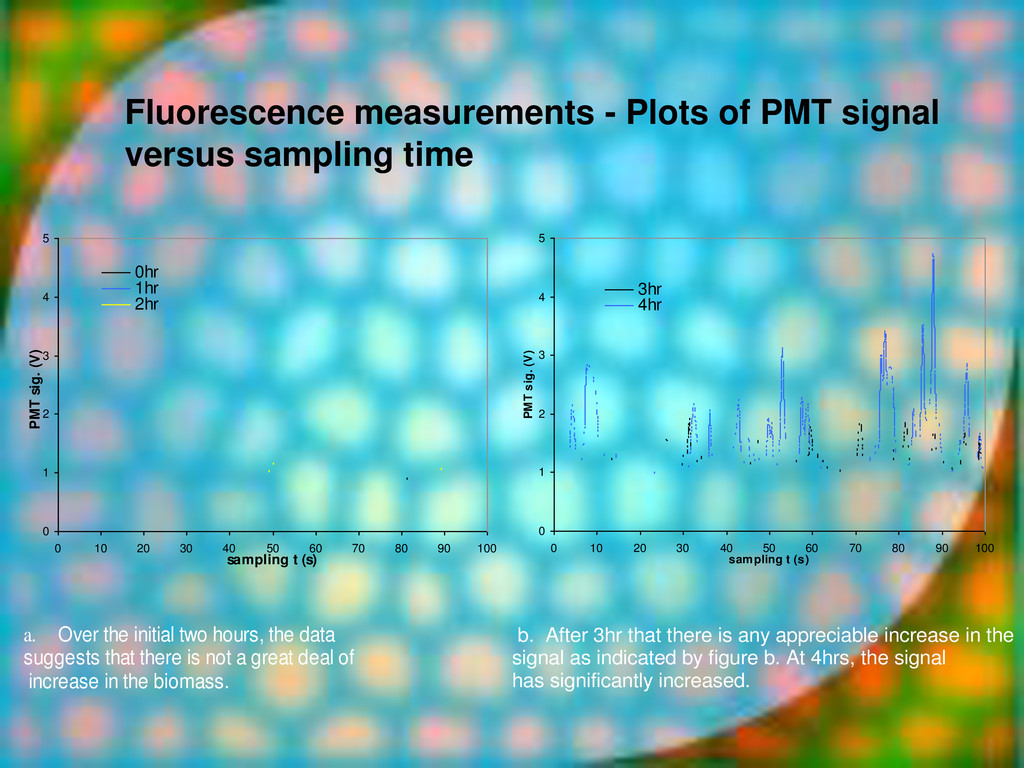
0 1 2 3 4 5 0 10 20 30 40 50 60 70 80 90 100 sampling t (s) PMT sig. (V) 0hr 1hr 2hr a. Over the initial two hours, the data suggests that there is not a great deal of increase in the biomass. 0 1 2 3 4 5 0 10 20 30 40 50 60 70 80 90 100 sampling t (s) PMT sig. (V) 3hr 4hr b. After 3hr that there is any appreciable increase in the signal as indicated by figure b. At 4hrs, the signal has significantly increased.
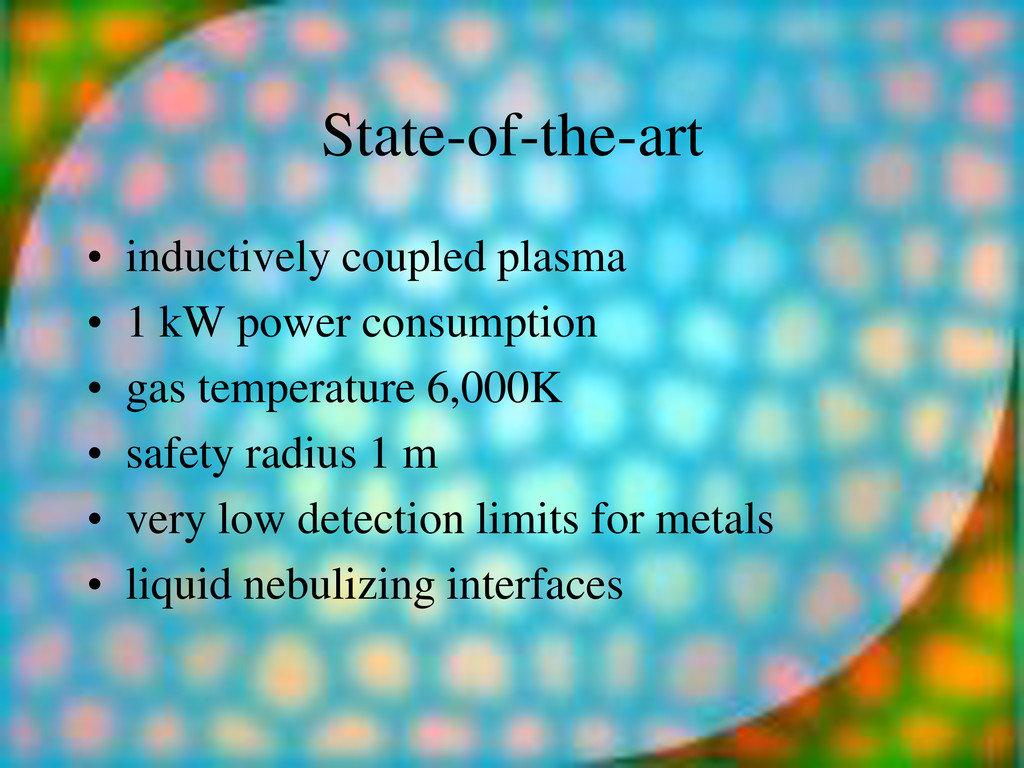
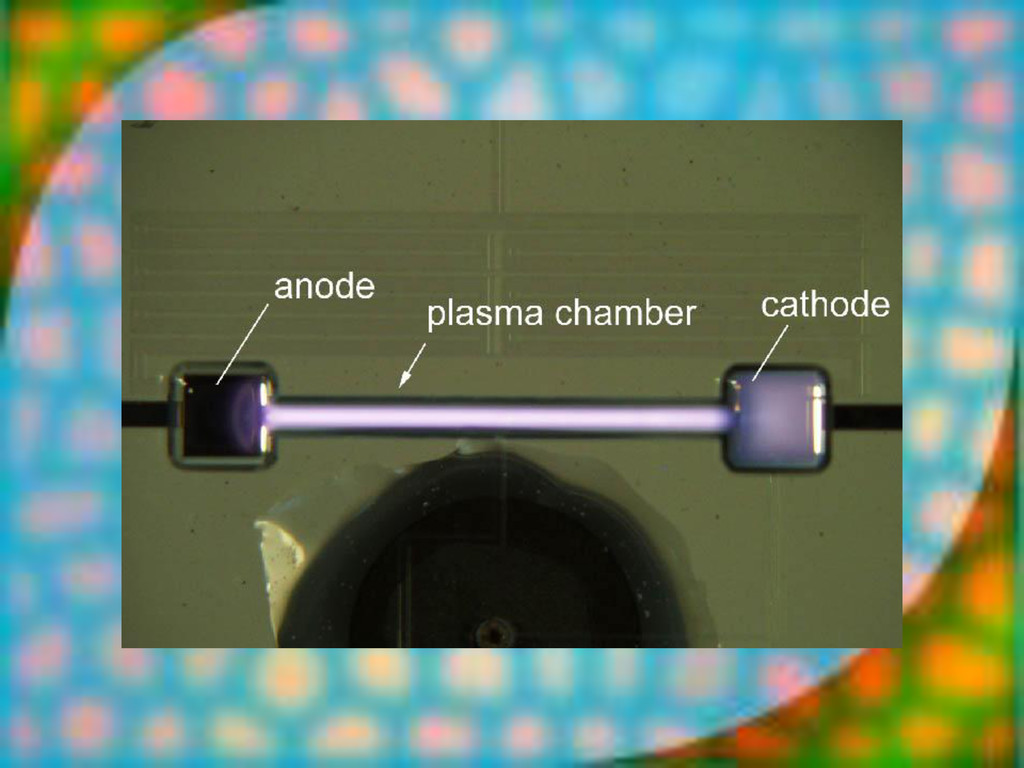
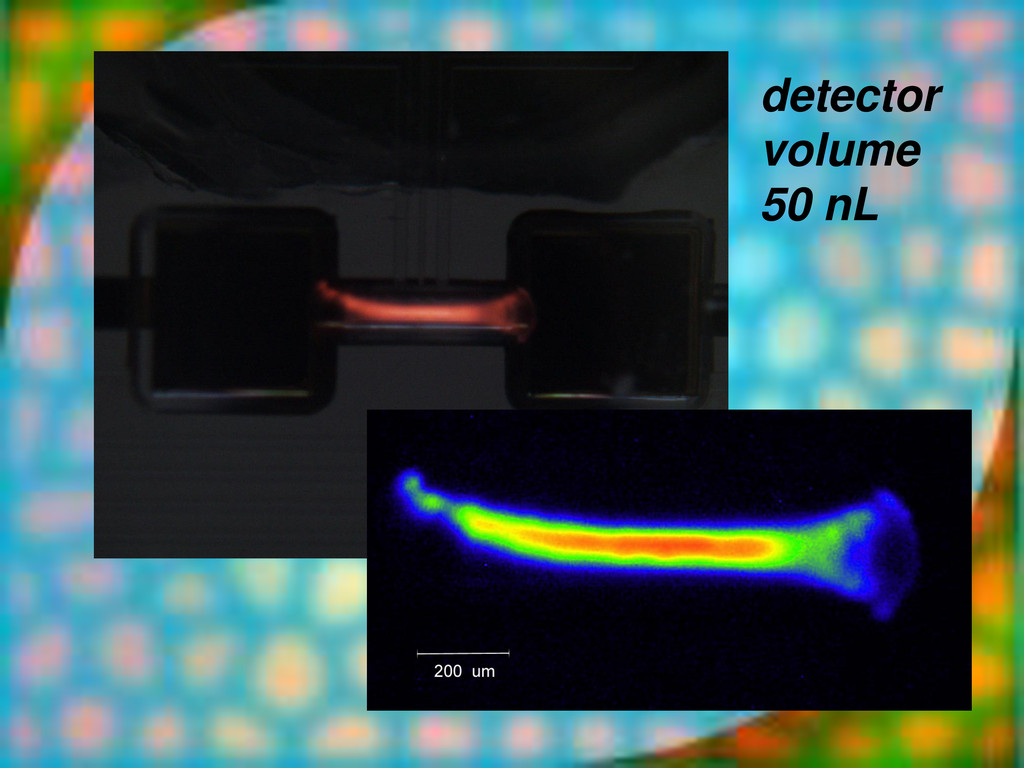
consumption • gas temperature 400K • can be touched during operation • acceptable detection limits for volatiles • problem: liquid samples plasma liq.ppt analog computing.ppt
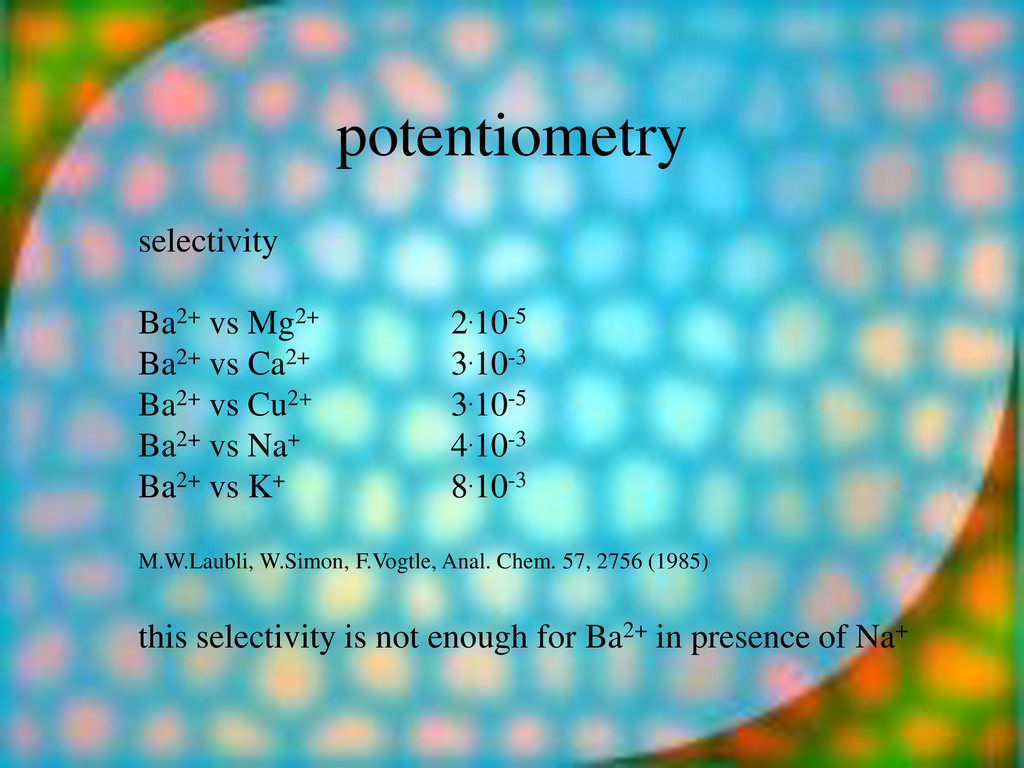
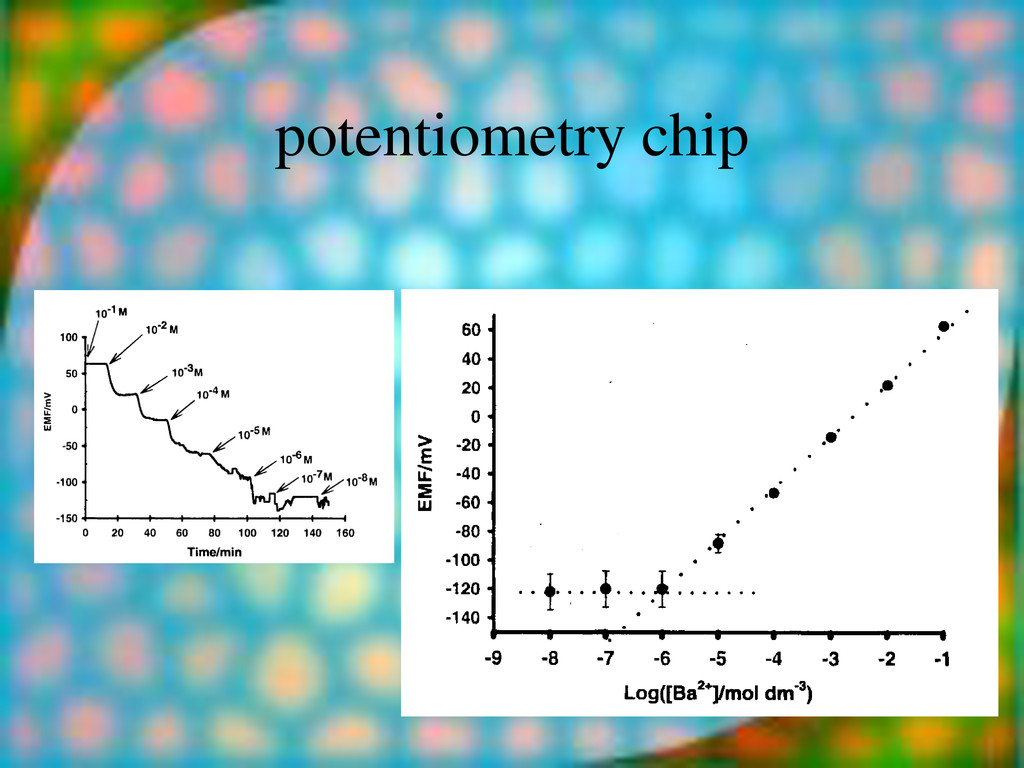
Ba2+ vs Cu2+ 3.10-5 Ba2+ vs Na+ 4.10-3 Ba2+ vs K+ 8.10-3 M.W.Laubli, W.Simon, F.Vogtle, Anal. Chem. 57, 2756 (1985) this selectivity is not enough for Ba2+ in presence of Na+
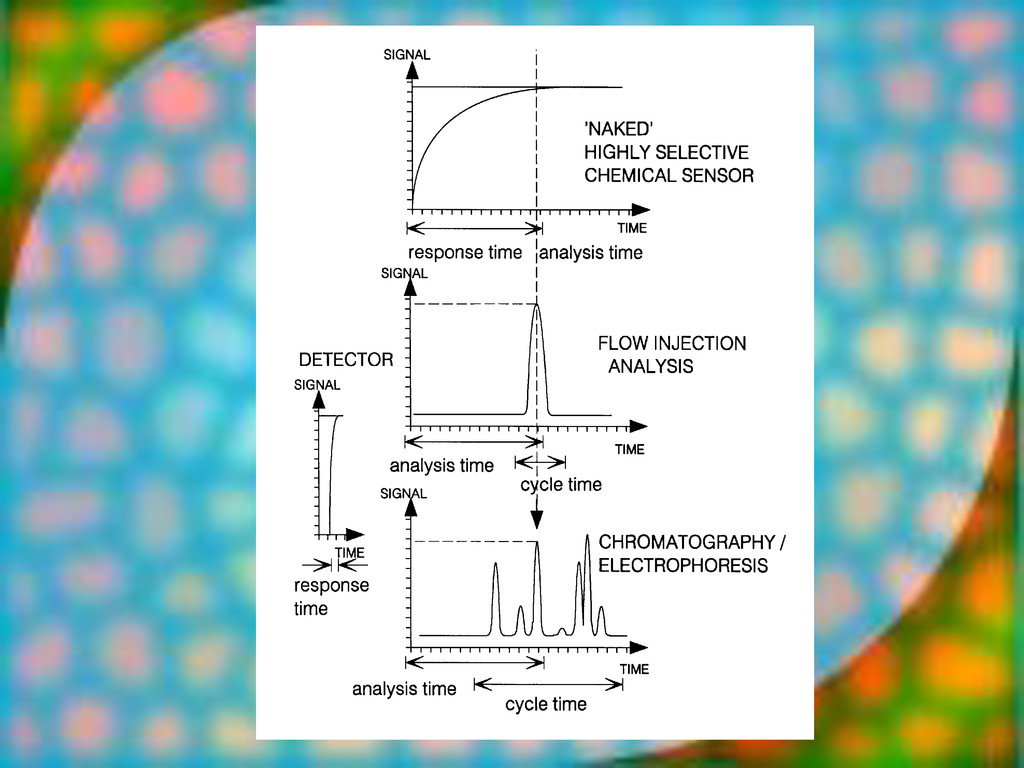
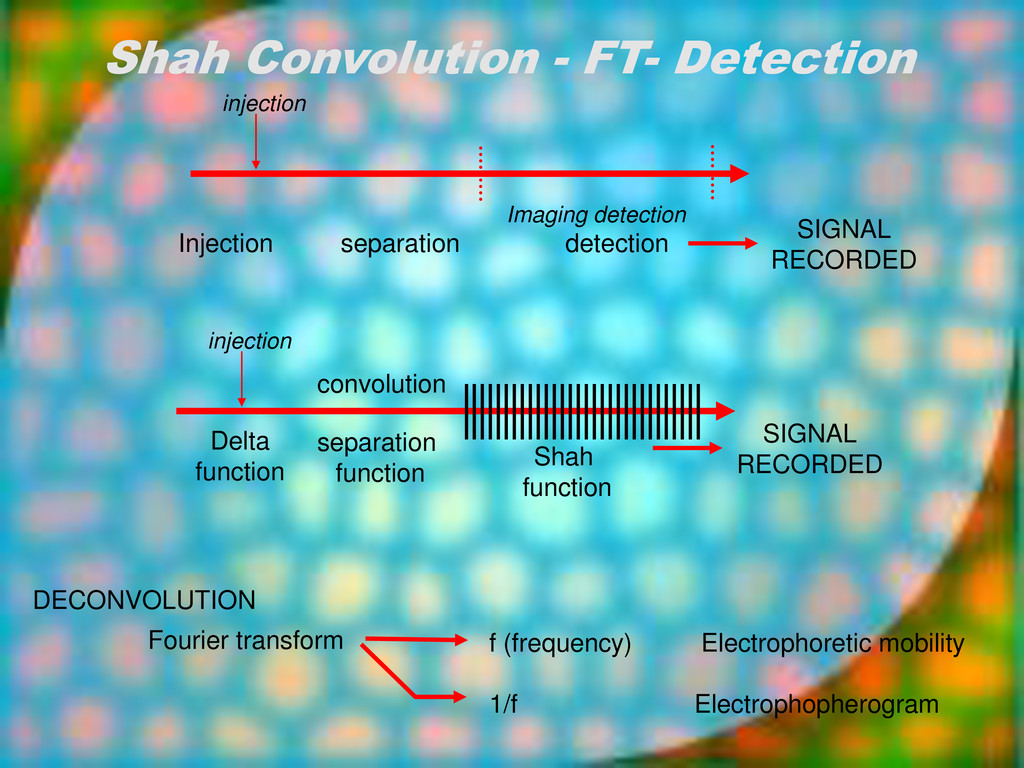
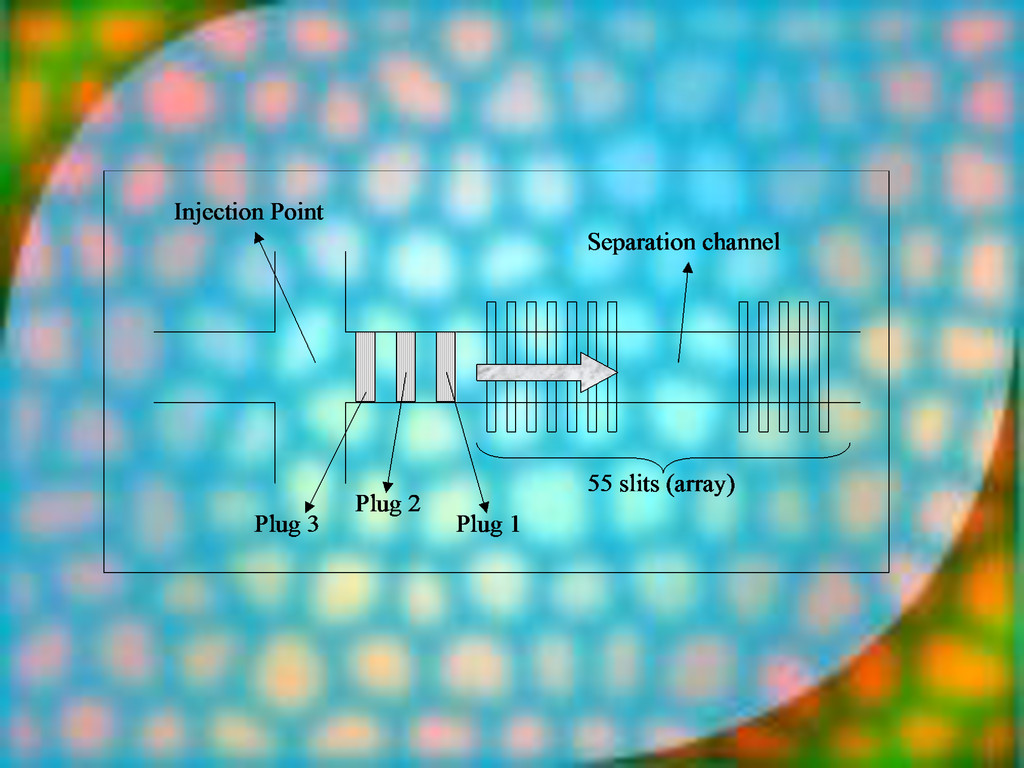
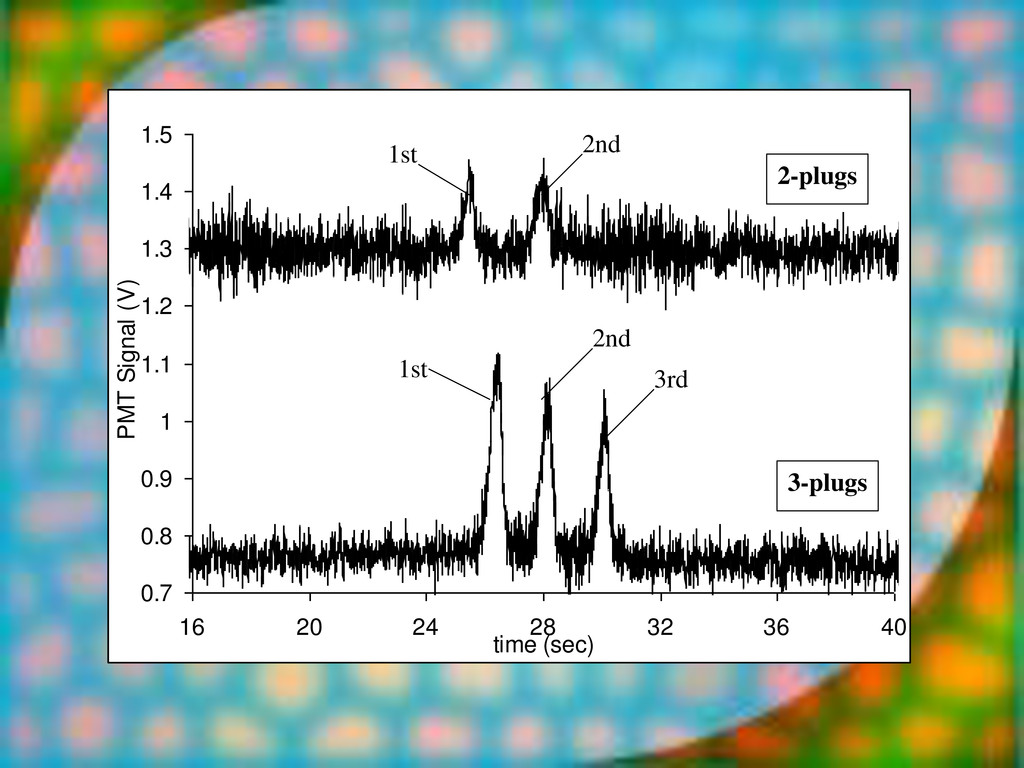
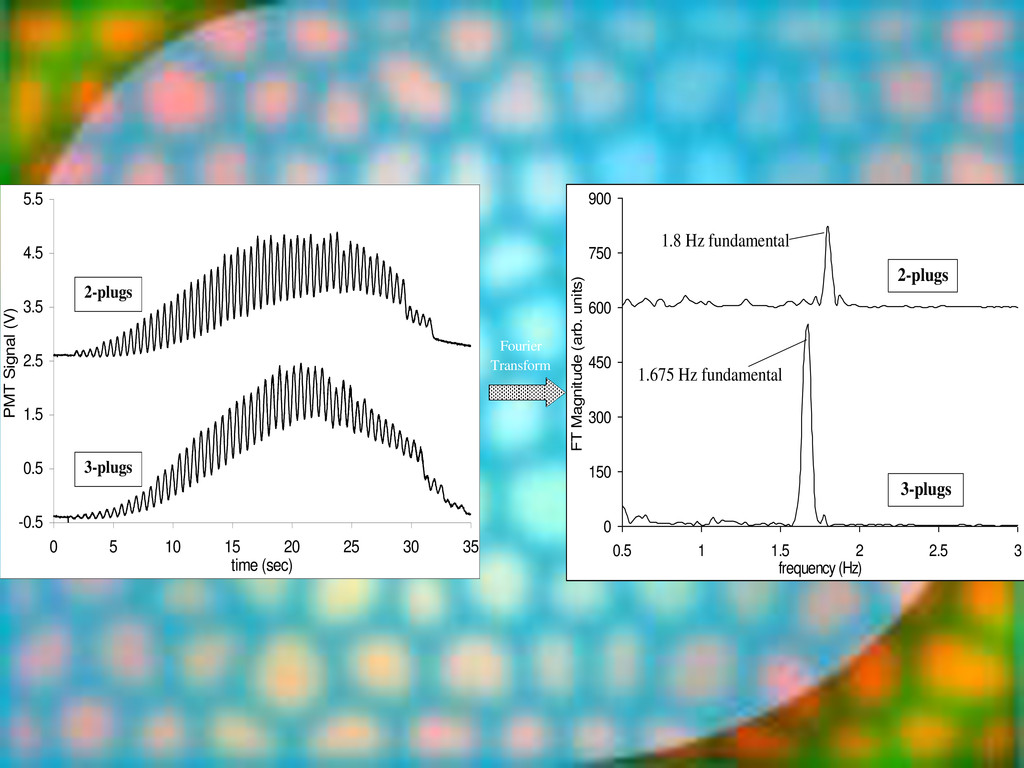
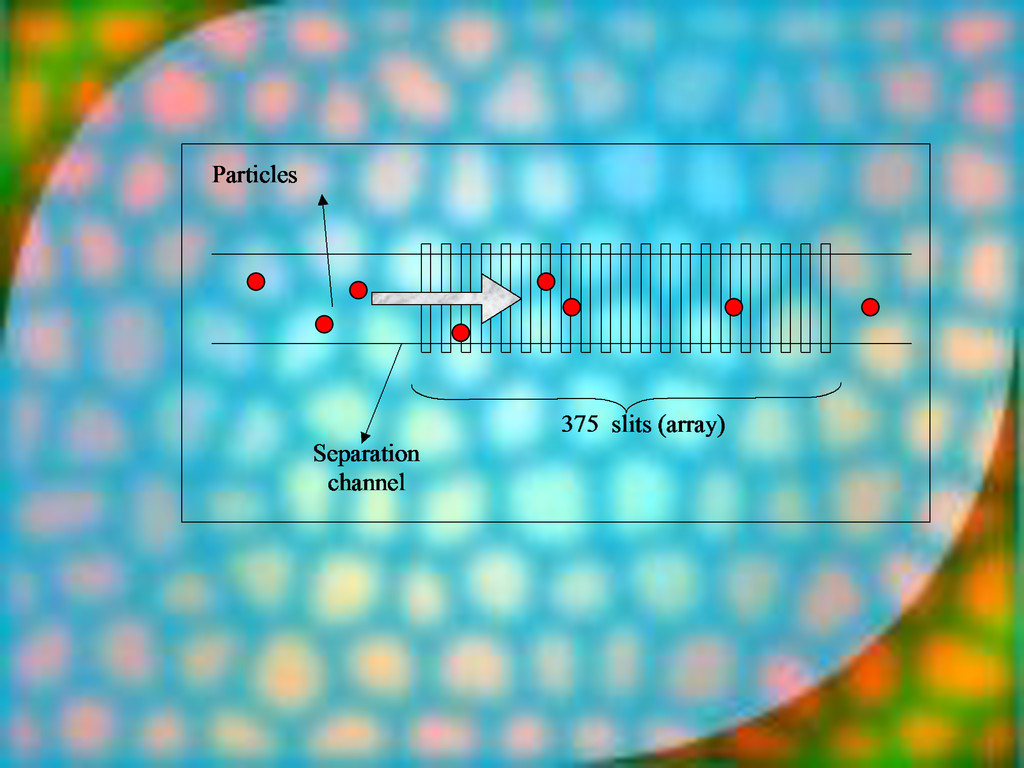
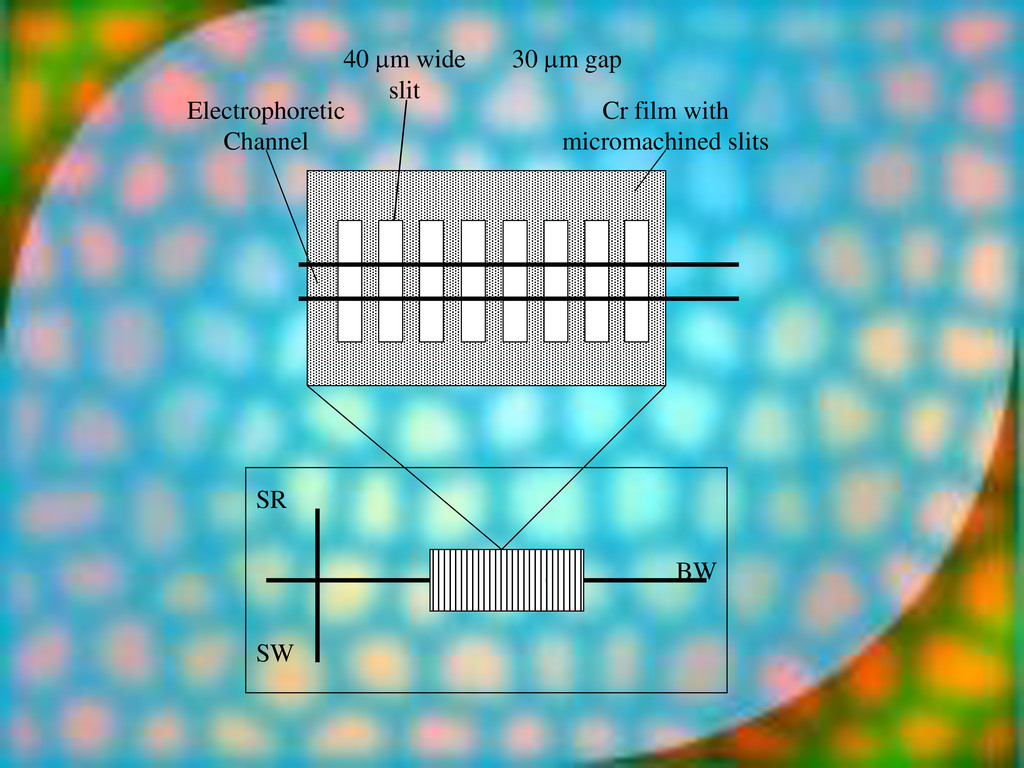
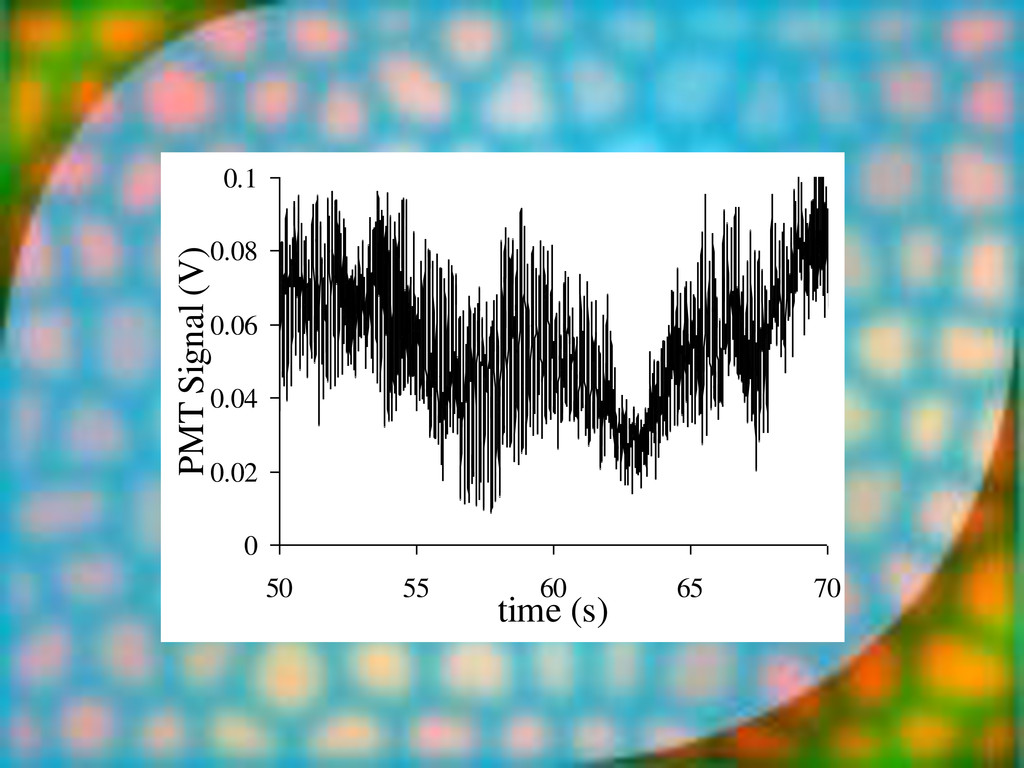
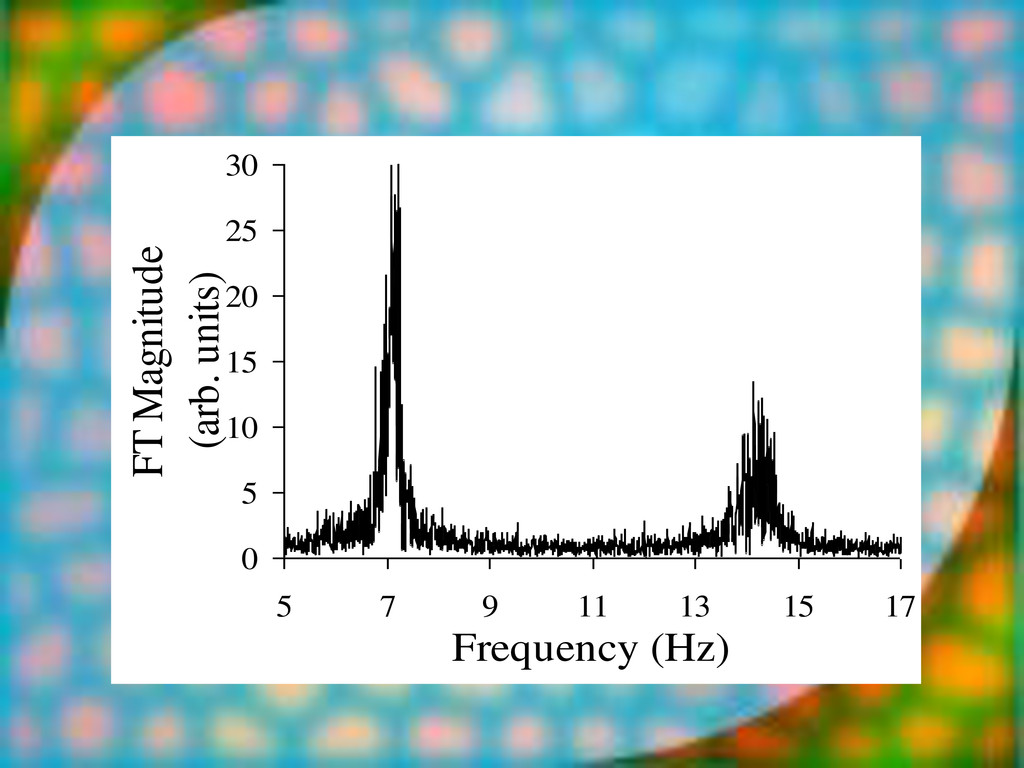
Convolution - FT- Detection injection Delta function convolution Shah function SIGNAL RECORDED DECONVOLUTION separation Fourier transform f (frequency) Electrophoretic mobility 1/f Electrophopherogram
UK European Commission, B Schlumberger, UK Casect, UK Agilent, D Forensic Lab, UK Asahi Kasei, Japan Lab of the Government Chemist, UK CSEM, Switzerland Amersham Pharmacia, UK Kodak, UK Glaxo Wellcome, UK Glaxo-Wellcome Heidelberg Instruments Hybaid MICROFABRICATION Alberta Microelectronics Centre, Canada Caliper Technologies, California MESA, University of Twente, The Netherlands CSEM, Switzerland !
![contents Why small? why small.ppt Chip technology microfabrication.ppt [Electrophoresis] electrophoresis.ppt](https://files.speakerdeck.com/presentations/4ab233302e9b0131dc8066d07d2effc2/slide_3.jpg)
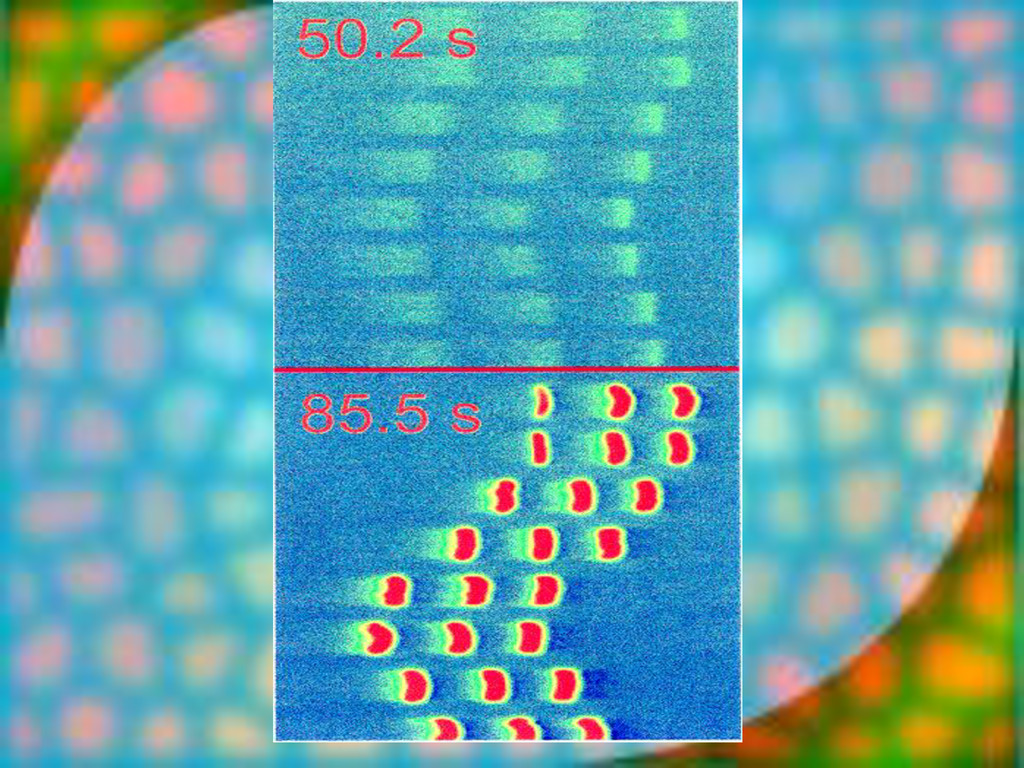
![13-Nov-13 blinkermuh fluorescence [arb. units] time [s] 0 40 80](https://files.speakerdeck.com/presentations/4ab233302e9b0131dc8066d07d2effc2/slide_13.jpg)
![CE on chip • Scaling laws electrophoresis scaling.ppt • [Short]](https://files.speakerdeck.com/presentations/4ab233302e9b0131dc8066d07d2effc2/slide_14.jpg)
![T.M.Woudenberg, E.S.Winn-Deen, M.Albin [Applied Biosystems, Foster City, CA] High-density PCR](https://files.speakerdeck.com/presentations/4ab233302e9b0131dc8066d07d2effc2/slide_85.jpg)
![potentiometry CE chip conc [arb. units] 0 1 2 3](https://files.speakerdeck.com/presentations/4ab233302e9b0131dc8066d07d2effc2/slide_150.jpg)
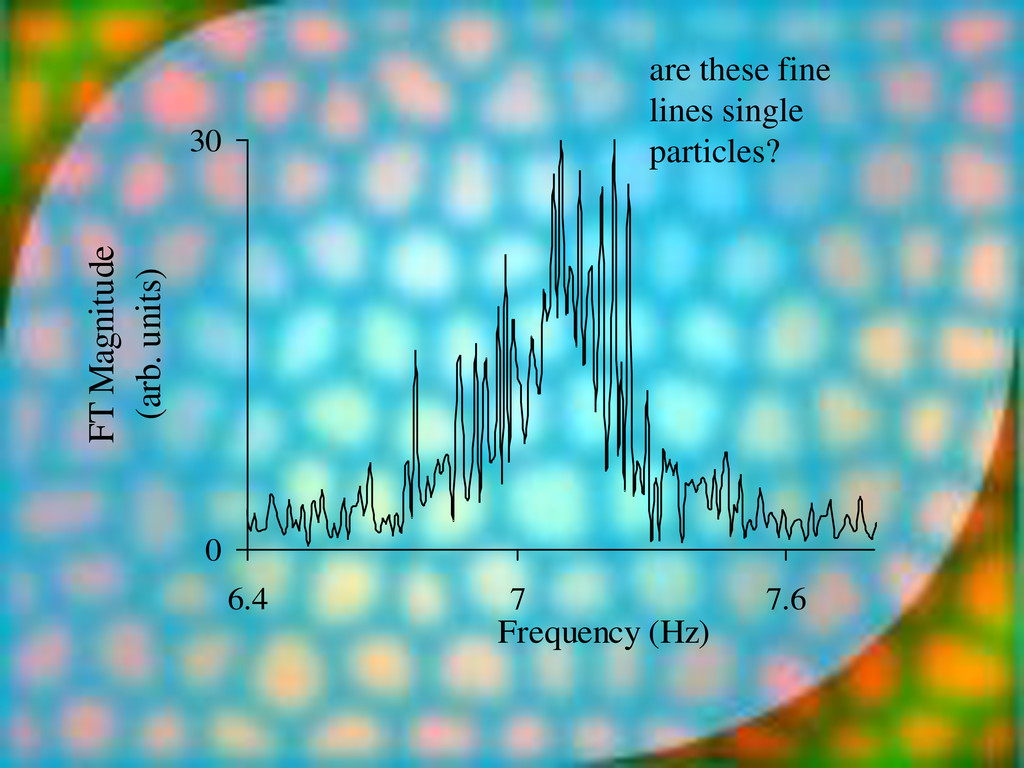
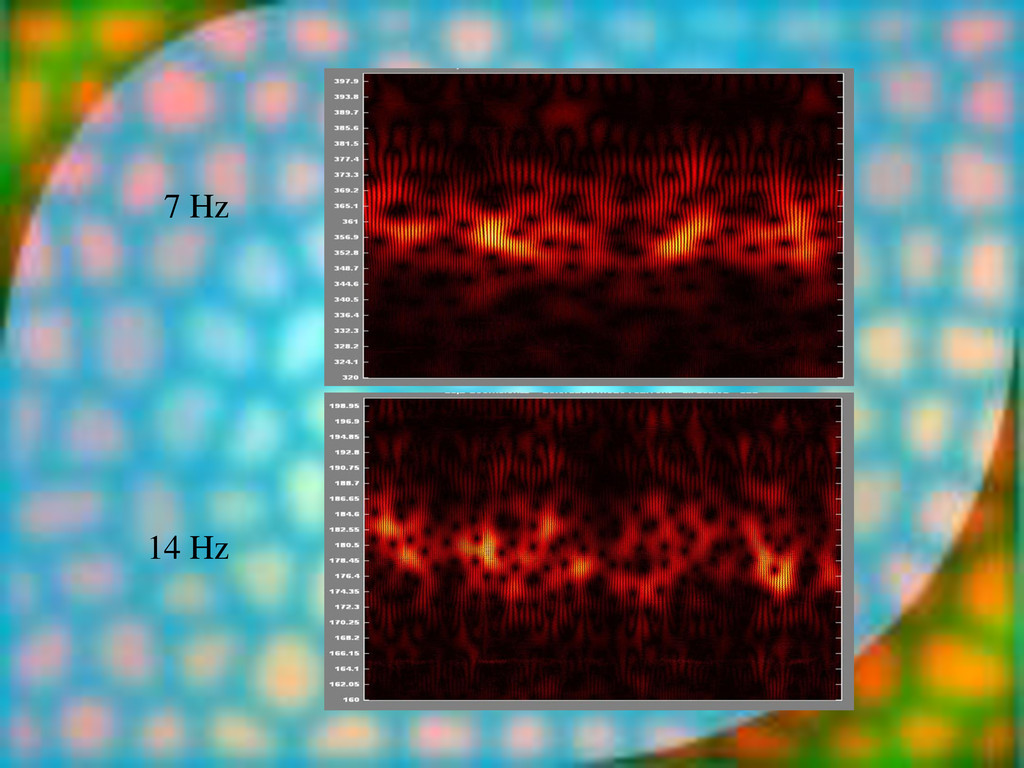
![wavelet transform 7Hz area time [s] 20 0 frequency [Hz]](https://files.speakerdeck.com/presentations/4ab233302e9b0131dc8066d07d2effc2/slide_168.jpg)