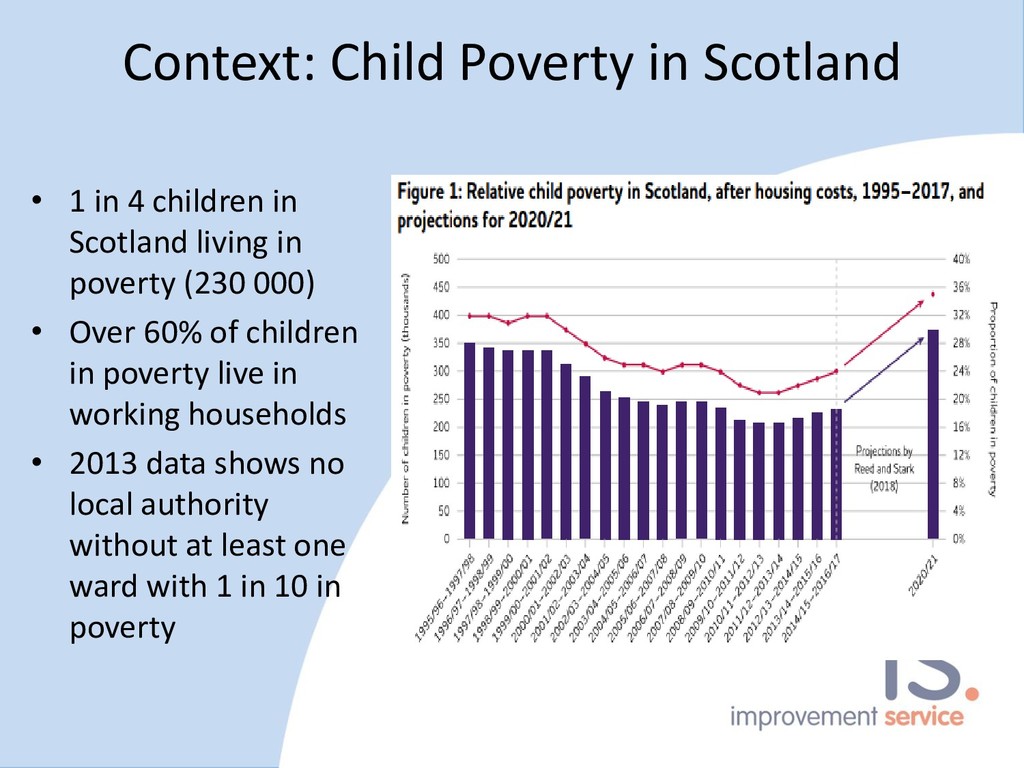
in Scotland living in poverty (230 000) • Over 60% of children in poverty live in working households • 2013 data shows no local authority without at least one ward with 1 in 10 in poverty
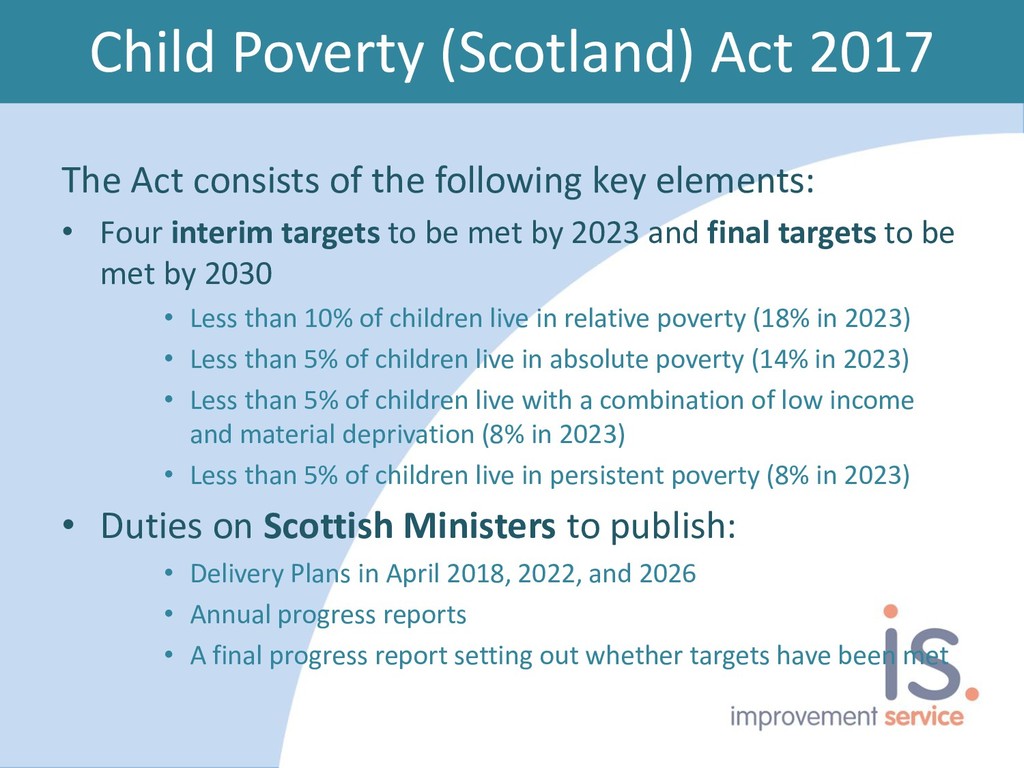
following key elements: • Four interim targets to be met by 2023 and final targets to be met by 2030 • Less than 10% of children live in relative poverty (18% in 2023) • Less than 5% of children live in absolute poverty (14% in 2023) • Less than 5% of children live with a combination of low income and material deprivation (8% in 2023) • Less than 5% of children live in persistent poverty (8% in 2023) • Duties on Scottish Ministers to publish: • Delivery Plans in April 2018, 2022, and 2026 • Annual progress reports • A final progress report setting out whether targets have been met
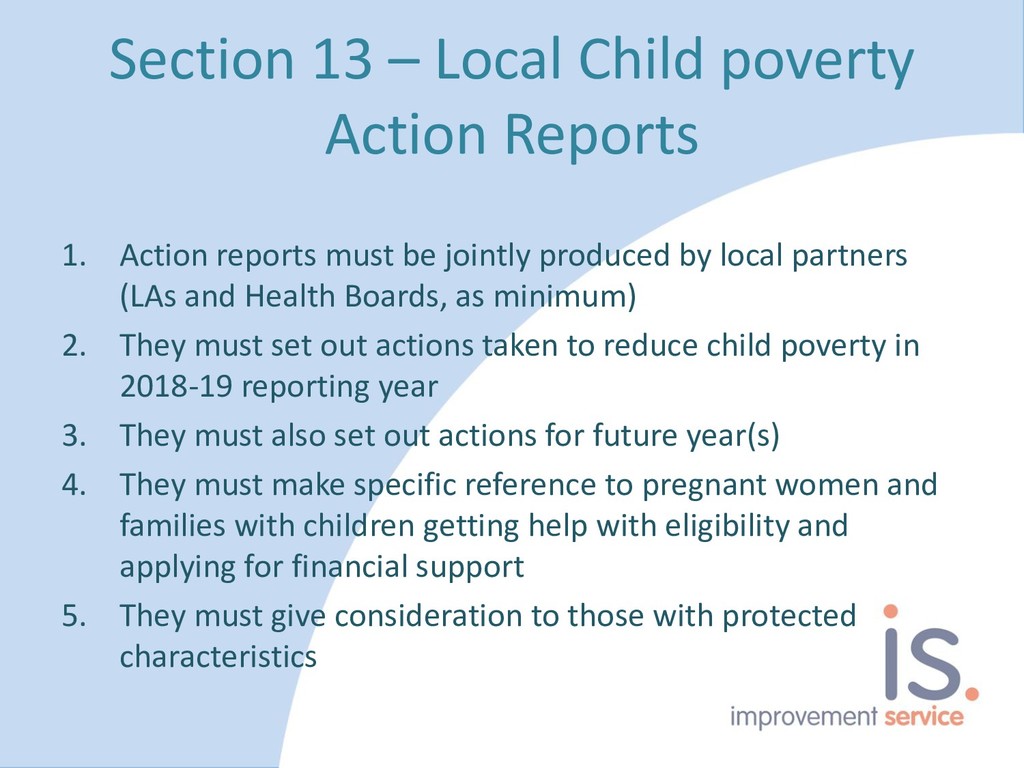
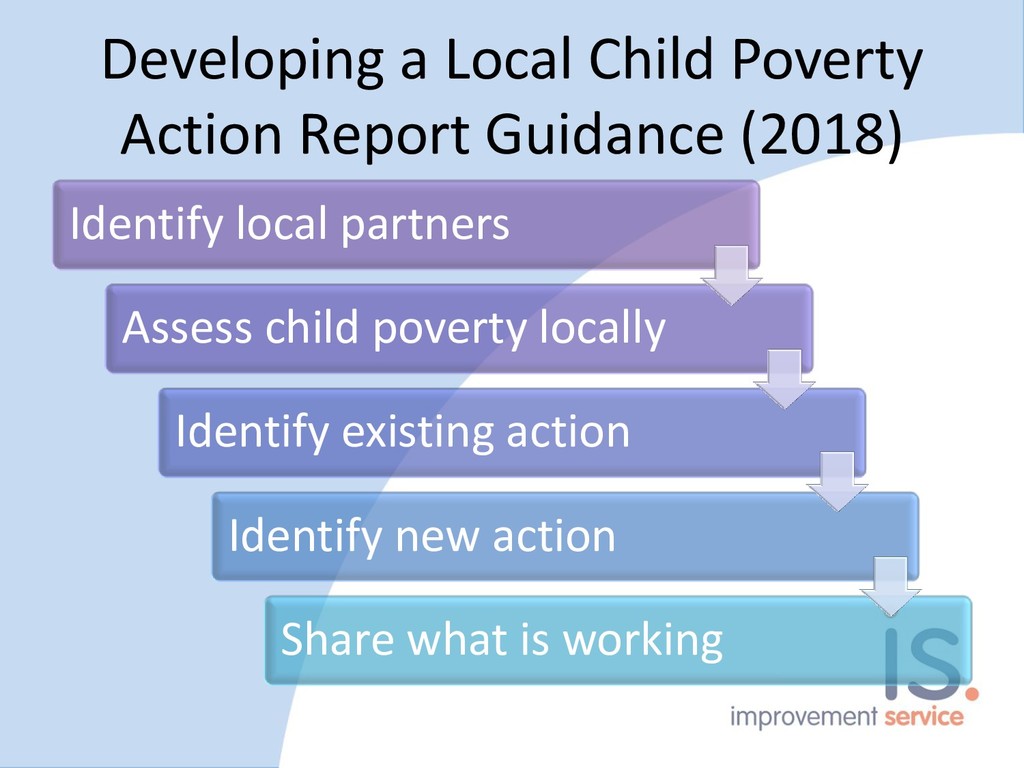
reports must be jointly produced by local partners (LAs and Health Boards, as minimum) 2. They must set out actions taken to reduce child poverty in 2018-19 reporting year 3. They must also set out actions for future year(s) 4. They must make specific reference to pregnant women and families with children getting help with eligibility and applying for financial support 5. They must give consideration to those with protected characteristics
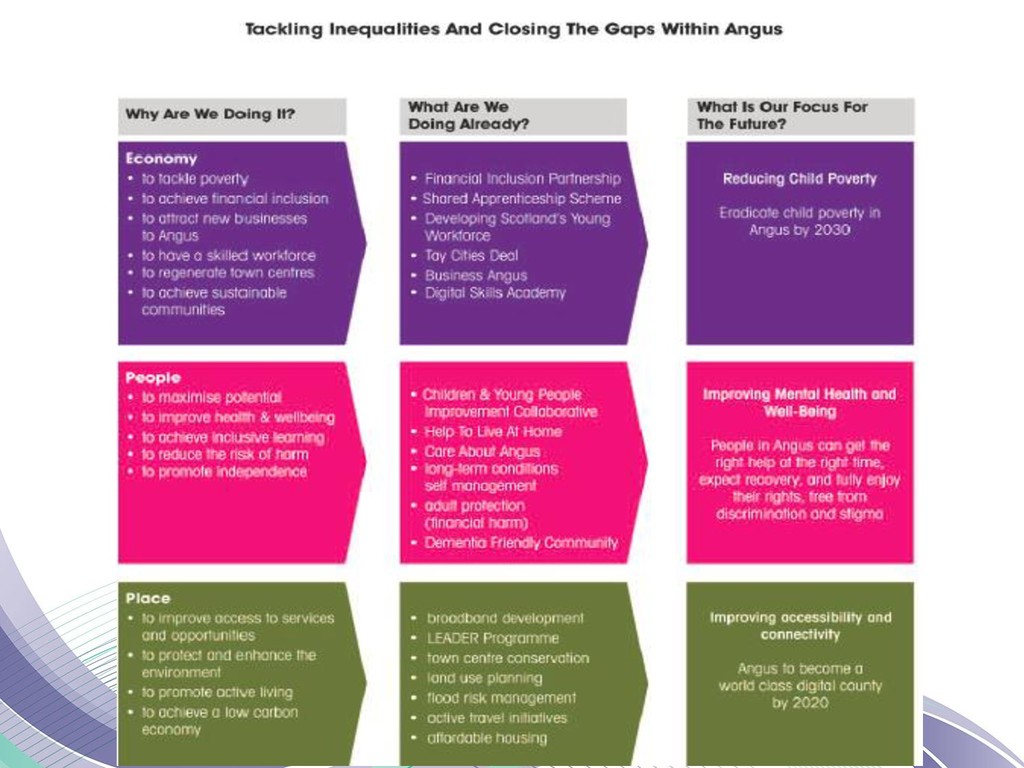
huge opportunity – to recognise and address structural issues that undermine other areas of work – to pull in new players – include economic development, procurement, business support, employers – a lever to make child poverty a top priority – a mechanism to measure progress
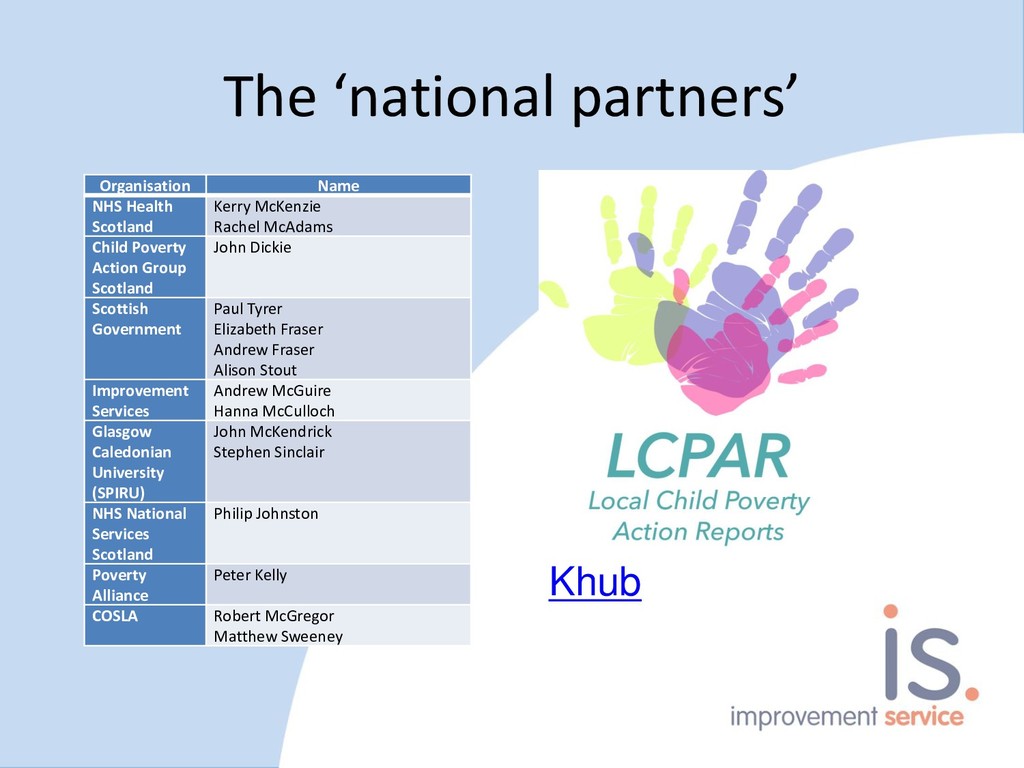
McKenzie Rachel McAdams Child Poverty Action Group Scotland John Dickie Scottish Government Paul Tyrer Elizabeth Fraser Andrew Fraser Alison Stout Improvement Services Andrew McGuire Hanna McCulloch Glasgow Caledonian University (SPIRU) John McKendrick Stephen Sinclair NHS National Services Scotland Philip Johnston Poverty Alliance Peter Kelly COSLA Robert McGregor Matthew Sweeney
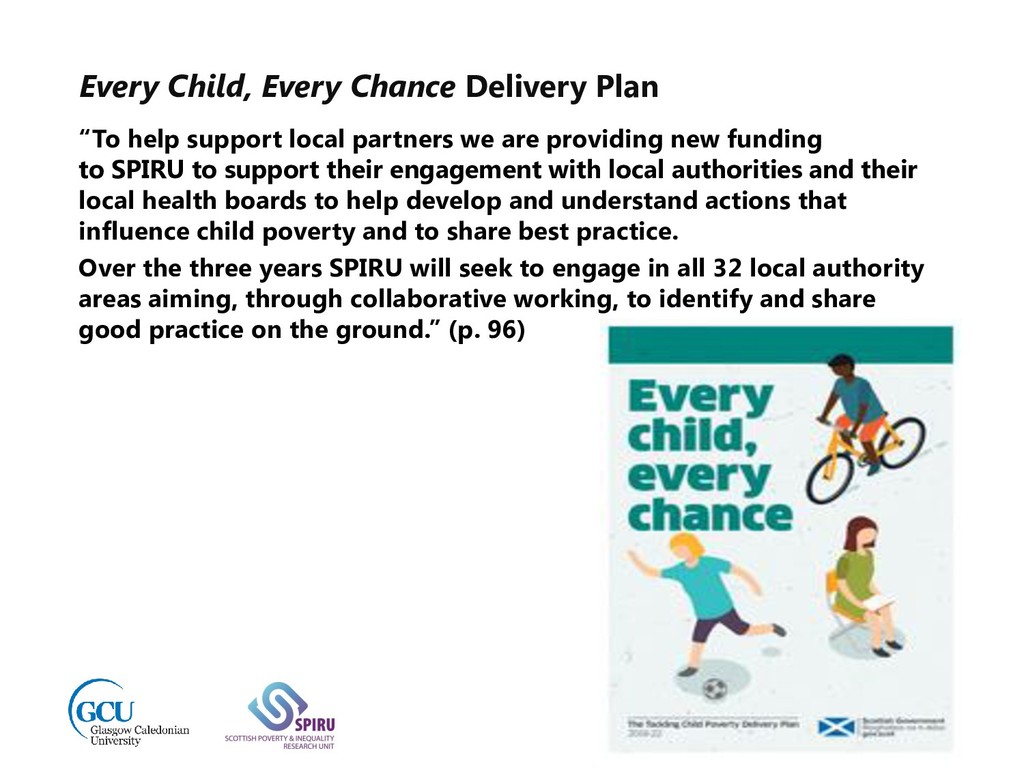
partners we are providing new funding to SPIRU to support their engagement with local authorities and their local health boards to help develop and understand actions that influence child poverty and to share best practice. Over the three years SPIRU will seek to engage in all 32 local authority areas aiming, through collaborative working, to identify and share good practice on the ground.” (p. 96)
Action Reports • Tailored support to particular authorities • ‘Data Deep Dive’: investigating local information and evidence sources • Effective practice case studies database • Action Learning Set on transport and household poverty - liaising with Poverty Alliance Get Heard Scotland project
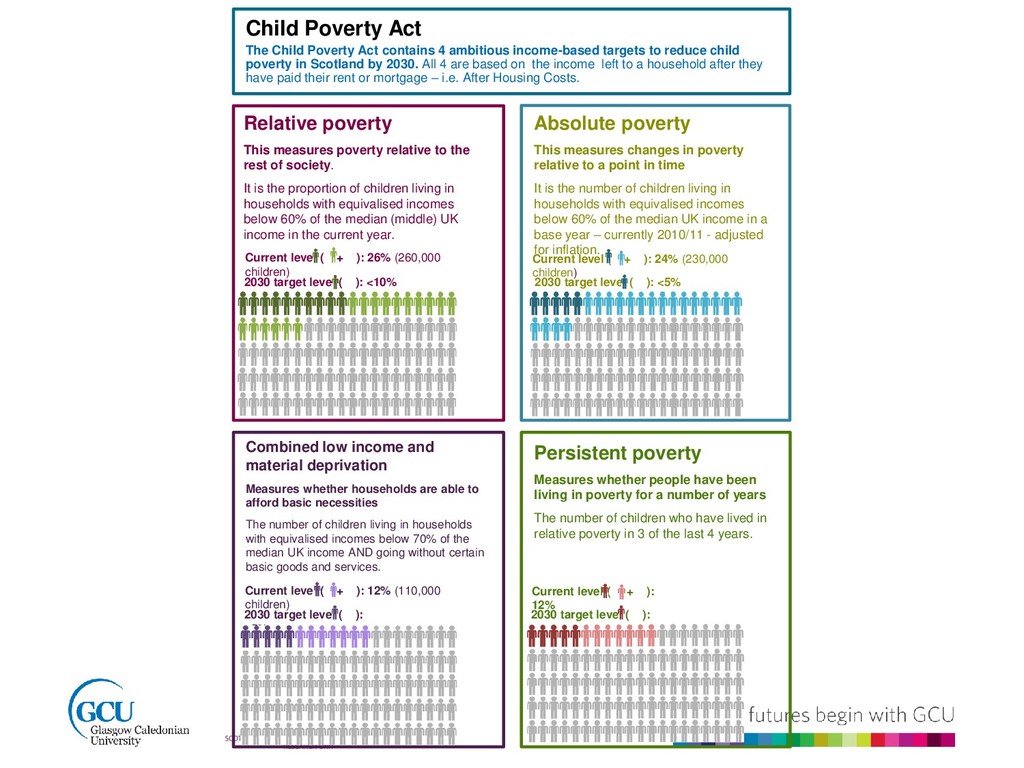
income-based targets to reduce child poverty in Scotland by 2030. All 4 are based on the income left to a household after they have paid their rent or mortgage – i.e. After Housing Costs. Relative poverty This measures poverty relative to the rest of society. It is the proportion of children living in households with equivalised incomes below 60% of the median (middle) UK income in the current year. Absolute poverty This measures changes in poverty relative to a point in time It is the number of children living in households with equivalised incomes below 60% of the median UK income in a base year – currently 2010/11 - adjusted for inflation. Combined low income and material deprivation Measures whether households are able to afford basic necessities The number of children living in households with equivalised incomes below 70% of the median UK income AND going without certain basic goods and services. Persistent poverty Measures whether people have been living in poverty for a number of years The number of children who have lived in relative poverty in 3 of the last 4 years. Current level ( + ): 26% (260,000 children) 2030 target level ( ): <10% Current level ( + ): 24% (230,000 children) 2030 target level ( ): <5% Current level ( + ): 12% (110,000 children) 2030 target level ( ): <5% Current level ( + ): 12% 2030 target level ( ): <5%
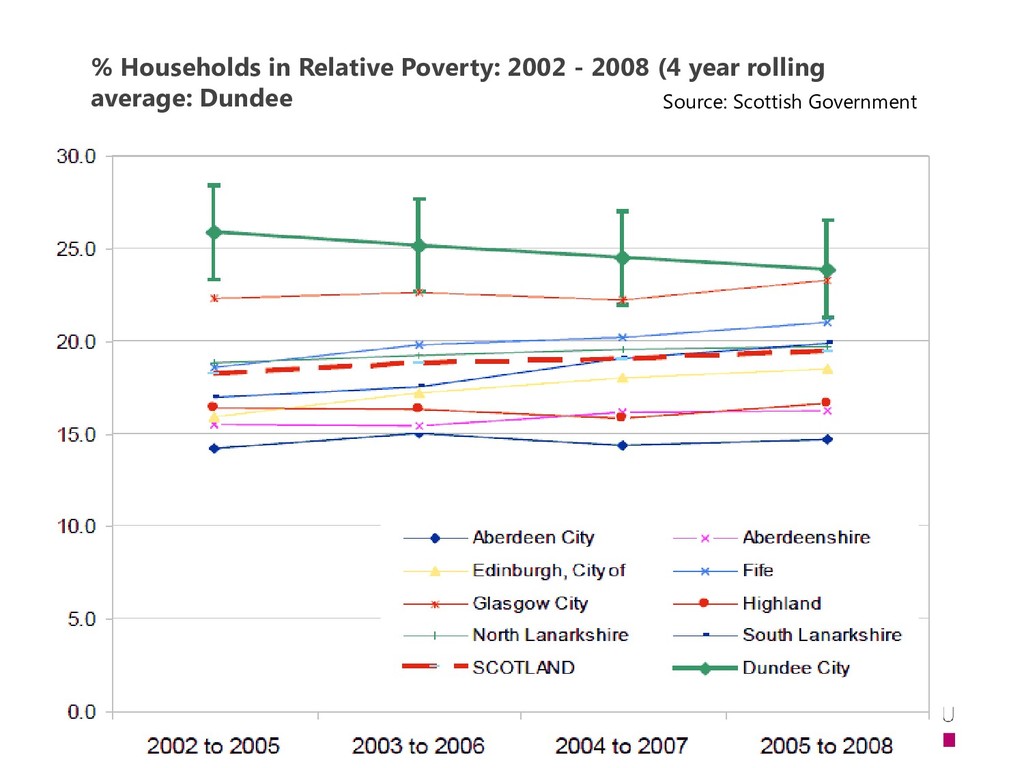
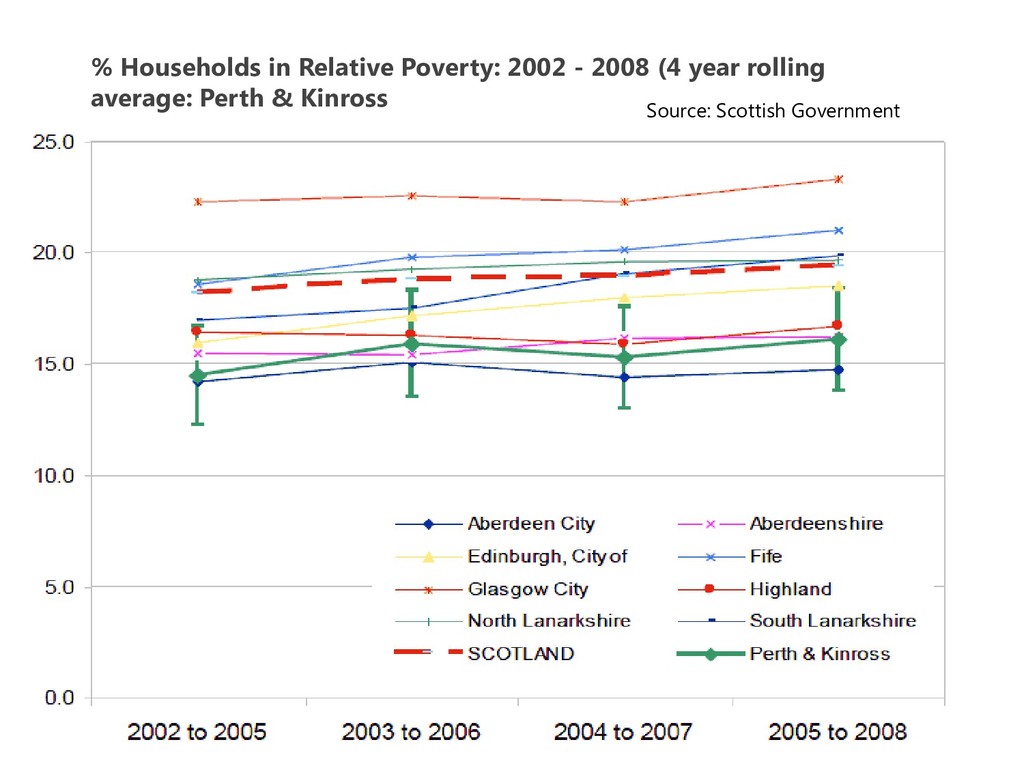
analysed below local authority level • Local authorities, health boards and CPPs cannot directly effect national targets • National data sources provide a (useful) general picture of poverty • Examples….
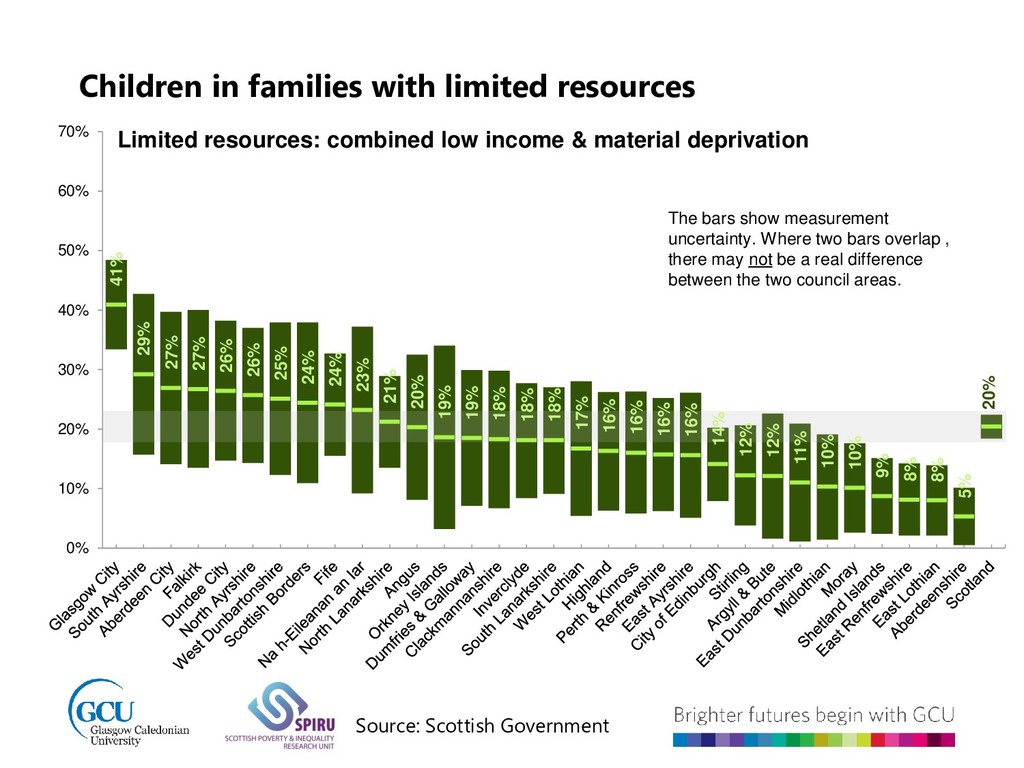
26% 26% 25% 24% 24% 23% 21% 20% 19% 19% 18% 18% 18% 17% 16% 16% 16% 16% 14% 12% 12% 11% 10% 10% 9% 8% 8% 5% 20% 0% 10% 20% 30% 40% 50% 60% 70% Limited resources: combined low income & material deprivation The bars show measurement uncertainty. Where two bars overlap , there may not be a real difference between the two council areas. Source: Scottish Government
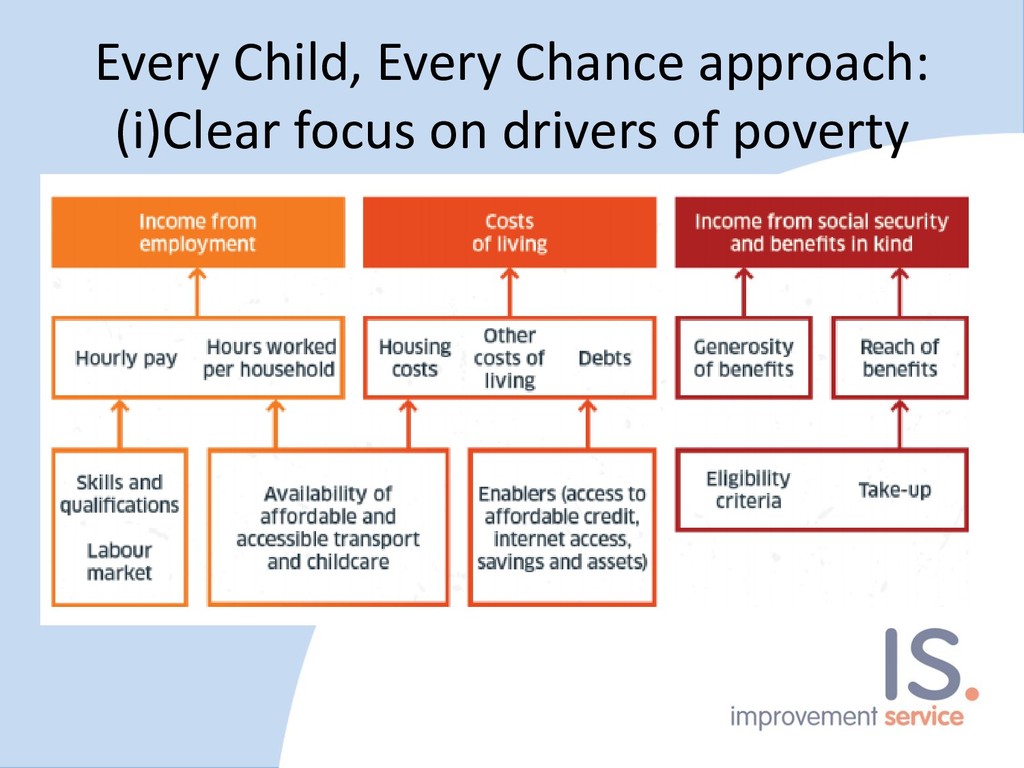
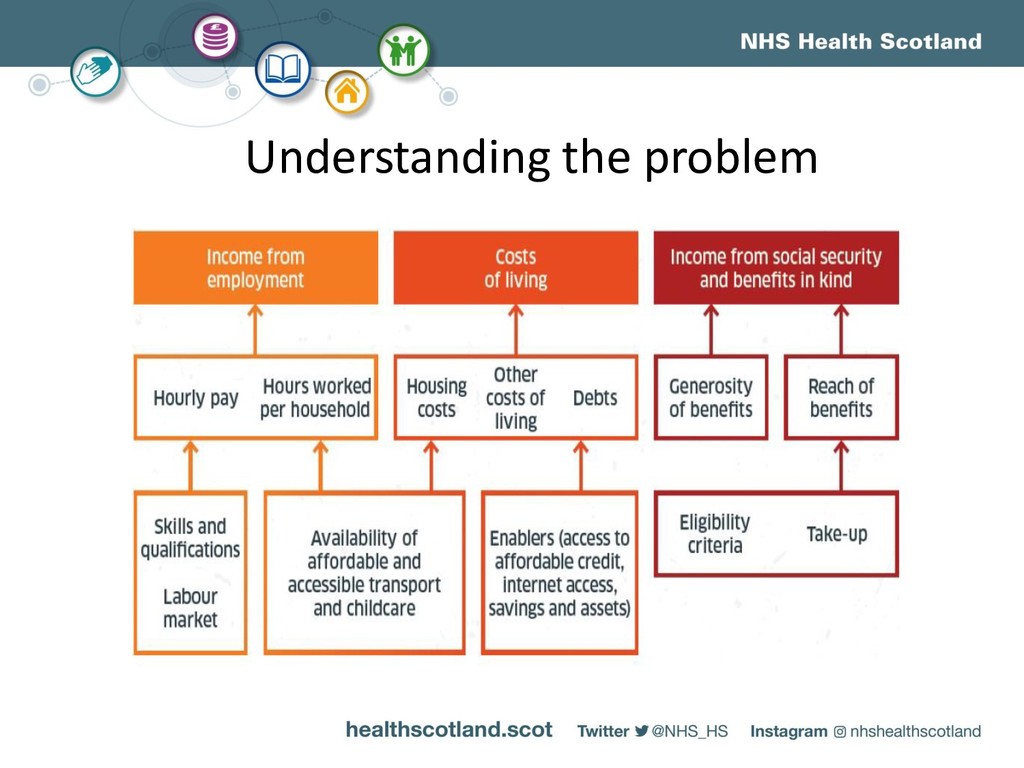
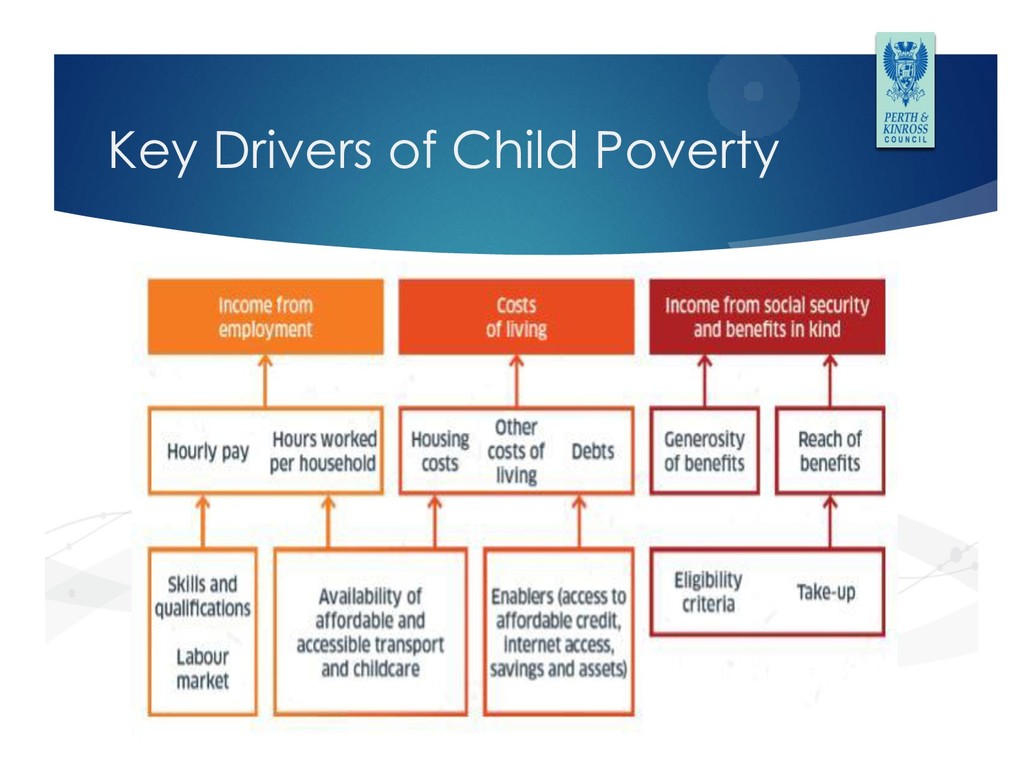
where poverty is particularly prevalent • Indicates which households are at particular risk of poverty • But it cannot provide evidence on the impact of local policies • Local intelligence and analysis required • Local Child Poverty Action Report should demonstrate CPPs’ actions directed to 3 key drivers of child poverty (i) increase income from employment (ii) reduce household costs / expenditure (iii) increase income from social security provision • But national data cannot show this for 6 priority groups • Therefore rationale for actions is crucial • Demonstrate plausible ‘line of sight’ connecting actions and outcomes • Explain why are you doing what you are doing
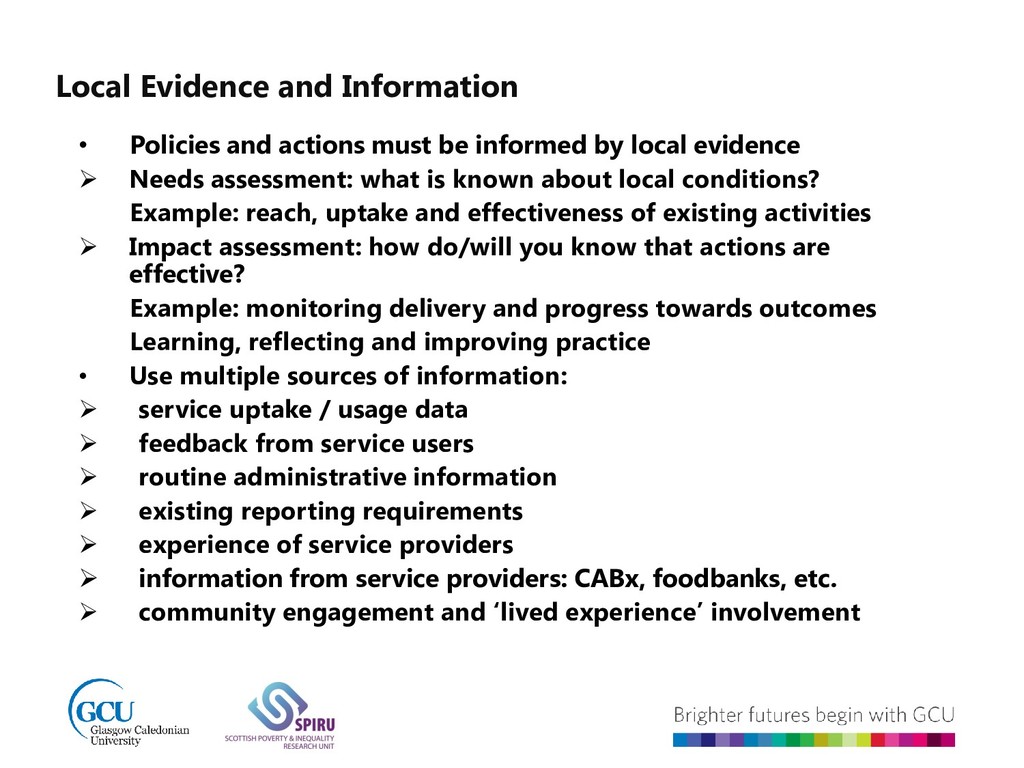
informed by local evidence Needs assessment: what is known about local conditions? Example: reach, uptake and effectiveness of existing activities Impact assessment: how do/will you know that actions are effective? Example: monitoring delivery and progress towards outcomes Learning, reflecting and improving practice • Use multiple sources of information: service uptake / usage data feedback from service users routine administrative information existing reporting requirements experience of service providers information from service providers: CABx, foodbanks, etc. community engagement and ‘lived experience’ involvement
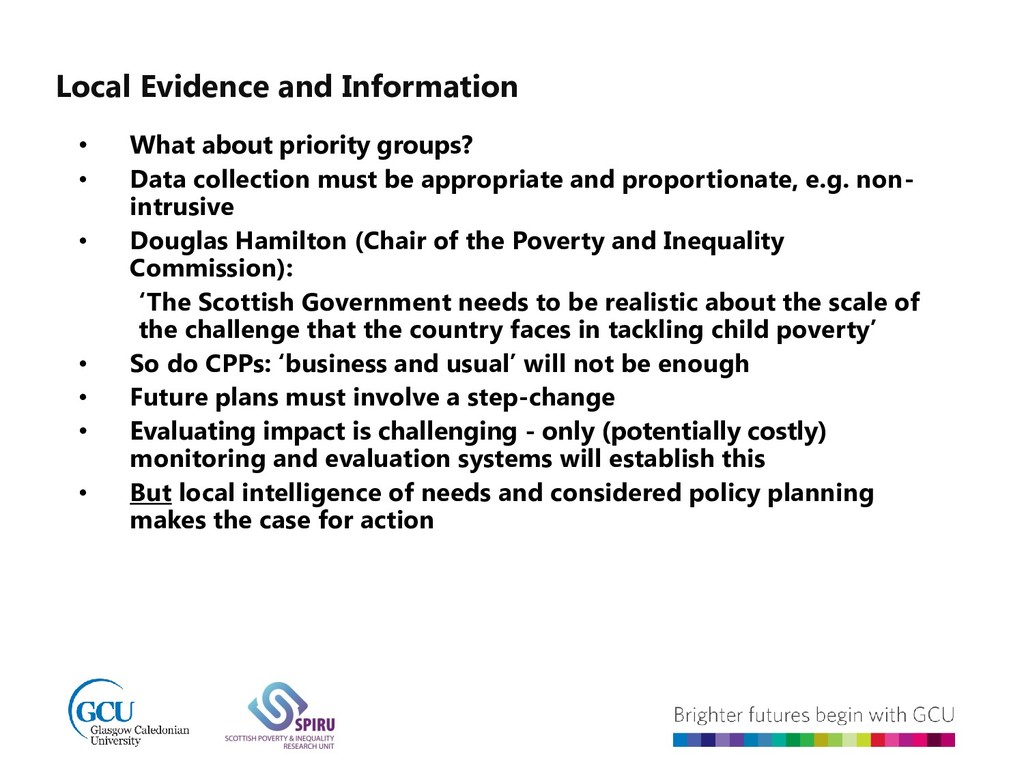
Data collection must be appropriate and proportionate, e.g. non- intrusive • Douglas Hamilton (Chair of the Poverty and Inequality Commission): ‘The Scottish Government needs to be realistic about the scale of the challenge that the country faces in tackling child poverty’ • So do CPPs: ‘business and usual’ will not be enough • Future plans must involve a step-change • Evaluating impact is challenging - only (potentially costly) monitoring and evaluation systems will establish this • But local intelligence of needs and considered policy planning makes the case for action
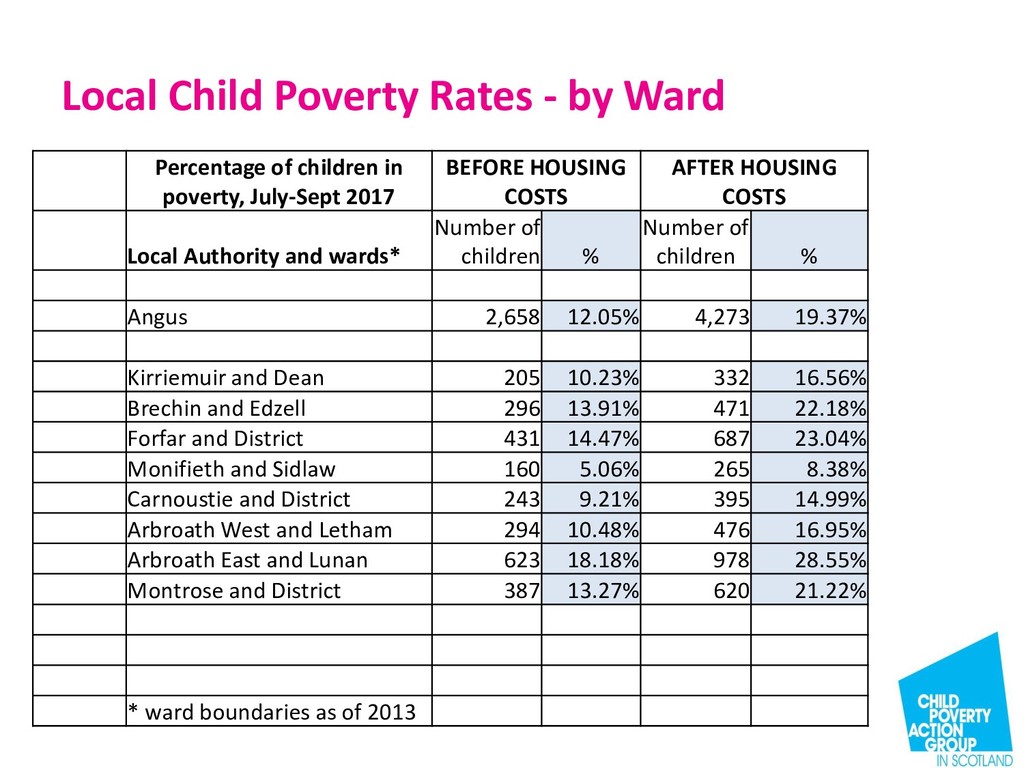
in poverty, July-Sept 2017 BEFORE HOUSING COSTS AFTER HOUSING COSTS Local Authority and wards* Number of children % Number of children % Angus 2,658 12.05% 4,273 19.37% Kirriemuir and Dean 205 10.23% 332 16.56% Brechin and Edzell 296 13.91% 471 22.18% Forfar and District 431 14.47% 687 23.04% Monifieth and Sidlaw 160 5.06% 265 8.38% Carnoustie and District 243 9.21% 395 14.99% Arbroath West and Letham 294 10.48% 476 16.95% Arbroath East and Lunan 623 18.18% 978 28.55% Montrose and District 387 13.27% 620 21.22% * ward boundaries as of 2013
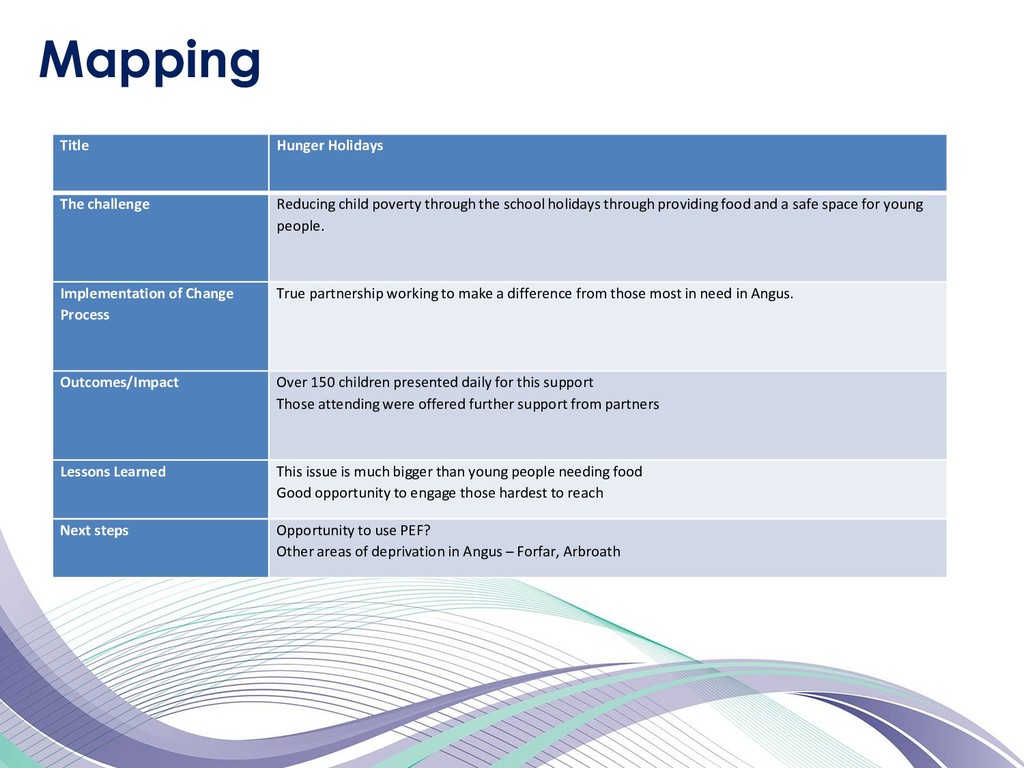
school holidays through providing food and a safe space for young people. Implementation of Change Process True partnership working to make a difference from those most in need in Angus. Outcomes/Impact Over 150 children presented daily for this support Those attending were offered further support from partners Lessons Learned This issue is much bigger than young people needing food Good opportunity to engage those hardest to reach Next steps Opportunity to use PEF? Other areas of deprivation in Angus – Forfar, Arbroath Mapping
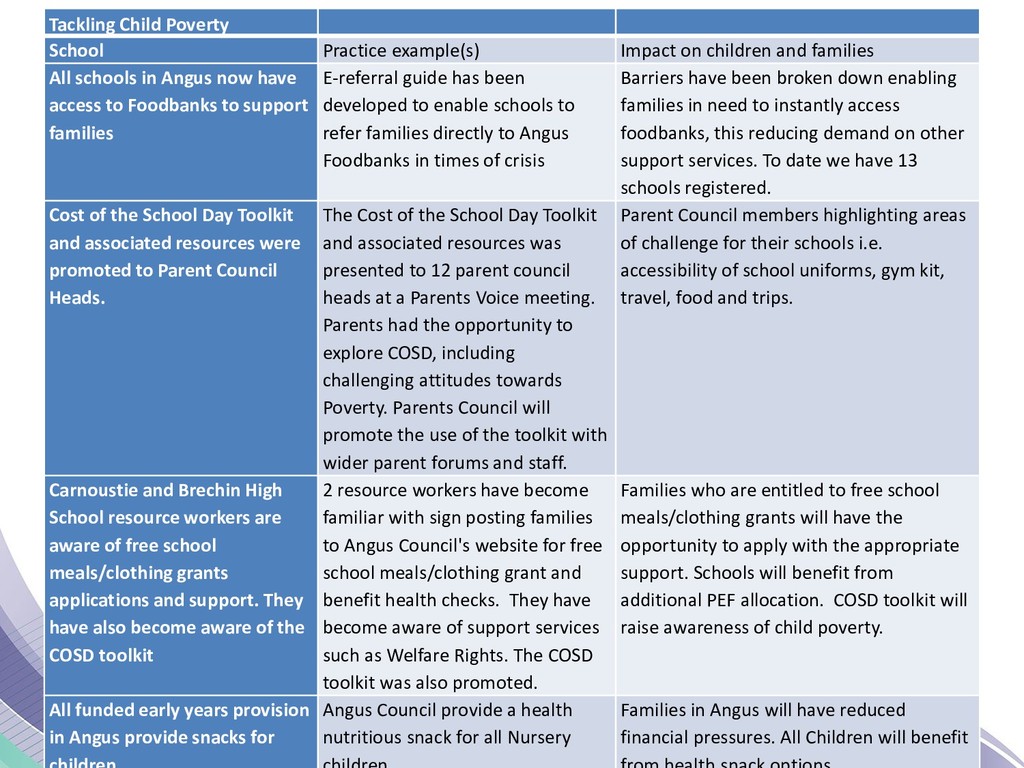
families All schools in Angus now have access to Foodbanks to support families E-referral guide has been developed to enable schools to refer families directly to Angus Foodbanks in times of crisis Barriers have been broken down enabling families in need to instantly access foodbanks, this reducing demand on other support services. To date we have 13 schools registered. Cost of the School Day Toolkit and associated resources were promoted to Parent Council Heads. The Cost of the School Day Toolkit and associated resources was presented to 12 parent council heads at a Parents Voice meeting. Parents had the opportunity to explore COSD, including challenging attitudes towards Poverty. Parents Council will promote the use of the toolkit with wider parent forums and staff. Parent Council members highlighting areas of challenge for their schools i.e. accessibility of school uniforms, gym kit, travel, food and trips. Carnoustie and Brechin High School resource workers are aware of free school meals/clothing grants applications and support. They have also become aware of the COSD toolkit 2 resource workers have become familiar with sign posting families to Angus Council's website for free school meals/clothing grant and benefit health checks. They have become aware of support services such as Welfare Rights. The COSD toolkit was also promoted. Families who are entitled to free school meals/clothing grants will have the opportunity to apply with the appropriate support. Schools will benefit from additional PEF allocation. COSD toolkit will raise awareness of child poverty. All funded early years provision in Angus provide snacks for Angus Council provide a health nutritious snack for all Nursery Families in Angus will have reduced financial pressures. All Children will benefit
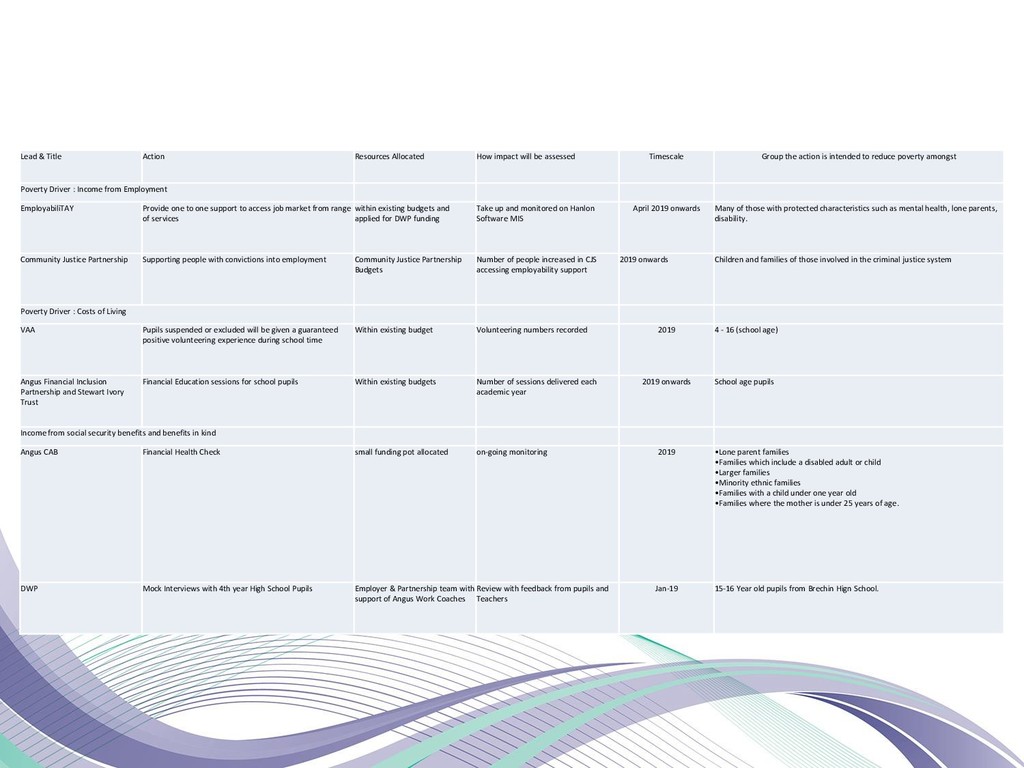
assessed Timescale Group the action is intended to reduce poverty amongst Poverty Driver : Income from Employment EmployabiliTAY Provide one to one support to access job market from range of services within existing budgets and applied for DWP funding Take up and monitored on Hanlon Software MIS April 2019 onwards Many of those with protected characteristics such as mental health, lone parents, disability. Community Justice Partnership Supporting people with convictions into employment Community Justice Partnership Budgets Number of people increased in CJS accessing employability support 2019 onwards Children and families of those involved in the criminal justice system Poverty Driver : Costs of Living VAA Pupils suspended or excluded will be given a guaranteed positive volunteering experience during school time Within existing budget Volunteering numbers recorded 2019 4 - 16 (school age) Angus Financial Inclusion Partnership and Stewart Ivory Trust Financial Education sessions for school pupils Within existing budgets Number of sessions delivered each academic year 2019 onwards School age pupils Income from social security benefits and benefits in kind Angus CAB Financial Health Check small funding pot allocated on-going monitoring 2019 •Lone parent families •Families which include a disabled adult or child •Larger families •Minority ethnic families •Families with a child under one year old •Families where the mother is under 25 years of age. DWP Mock Interviews with 4th year High School Pupils Employer & Partnership team with support of Angus Work Coaches Review with feedback from pupils and Teachers Jan-19 15-16 Year old pupils from Brechin Hign School.
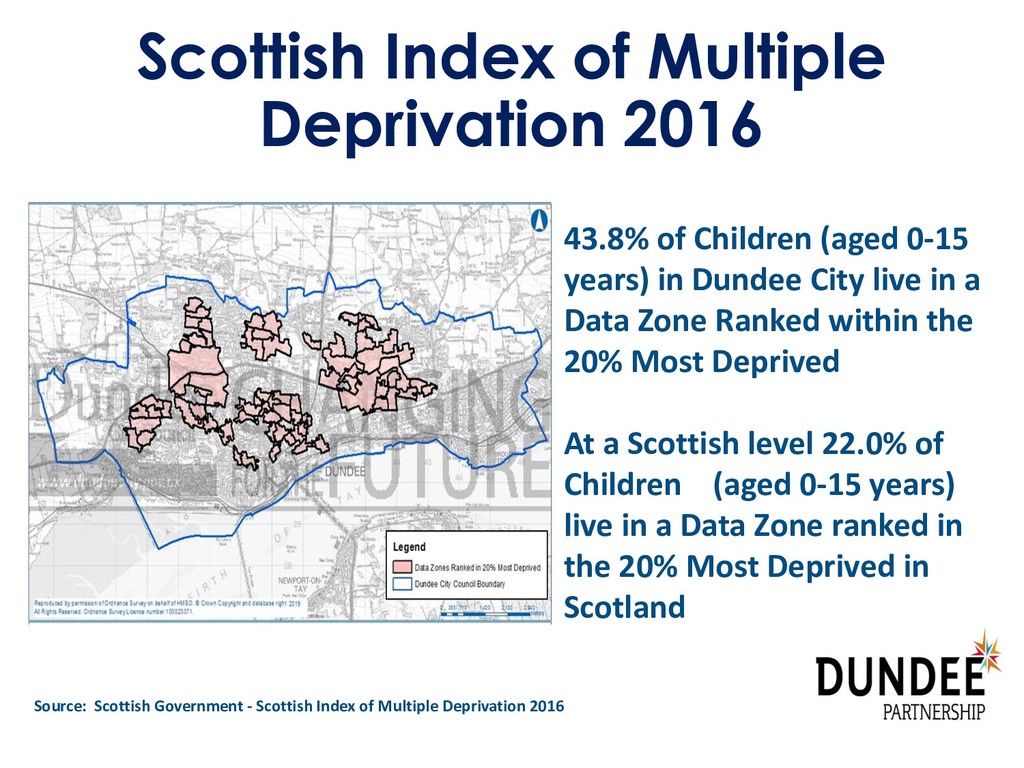
0-15 years) in Dundee City live in a Data Zone Ranked within the 20% Most Deprived At a Scottish level 22.0% of Children (aged 0-15 years) live in a Data Zone ranked in the 20% Most Deprived in Scotland Source: Scottish Government - Scottish Index of Multiple Deprivation 2016
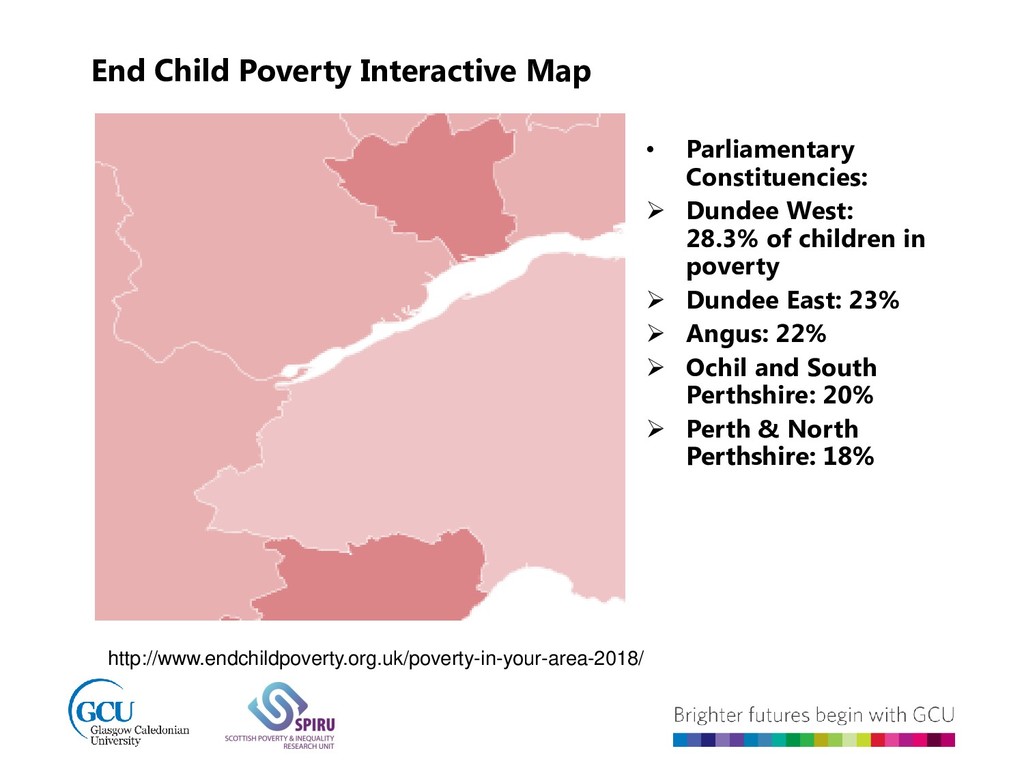
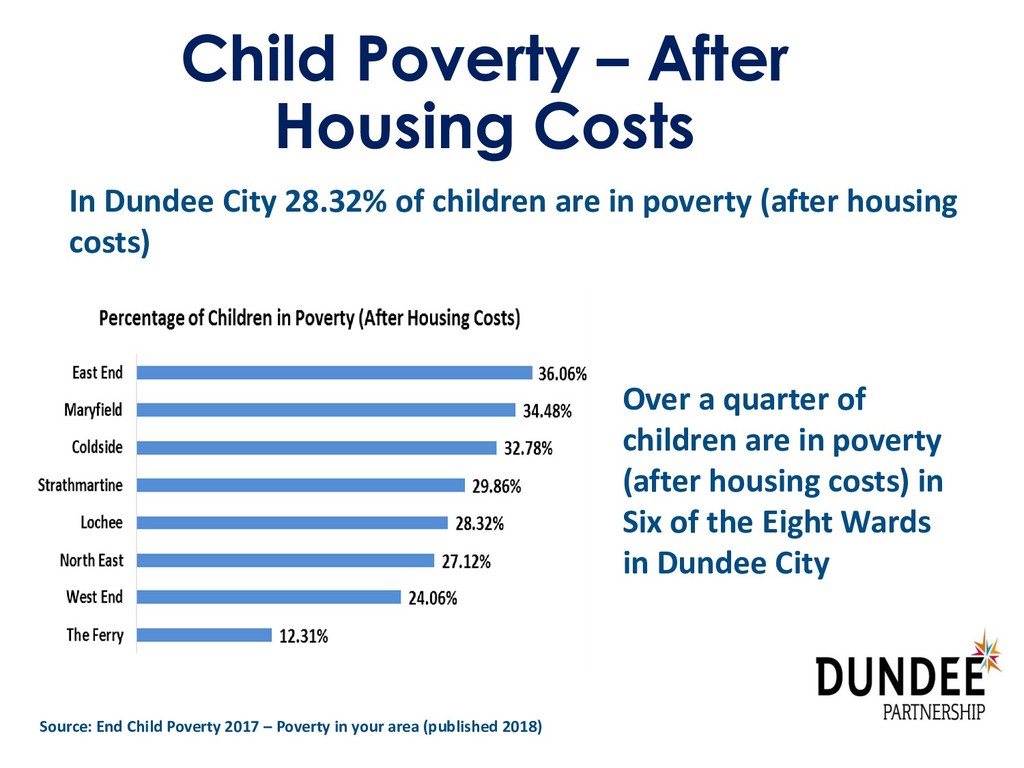
of children are in poverty (after housing costs) Over a quarter of children are in poverty (after housing costs) in Six of the Eight Wards in Dundee City Source: End Child Poverty 2017 – Poverty in your area (published 2018)
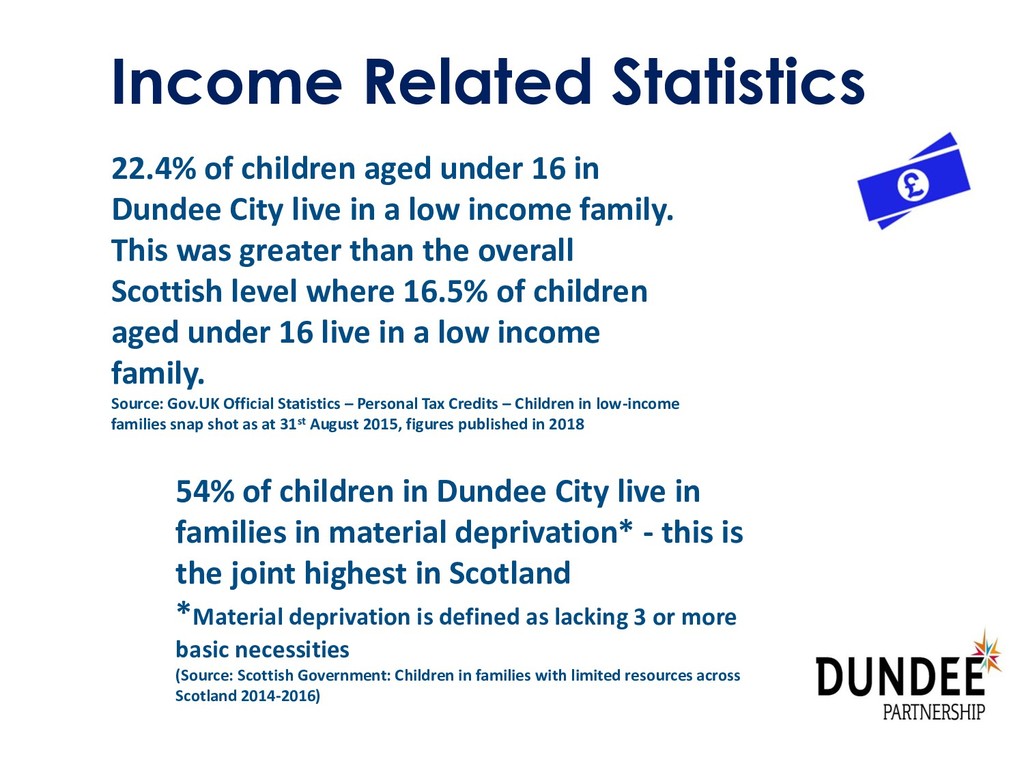
Dundee City live in a low income family. This was greater than the overall Scottish level where 16.5% of children aged under 16 live in a low income family. Source: Gov.UK Official Statistics – Personal Tax Credits – Children in low-income families snap shot as at 31st August 2015, figures published in 2018 54% of children in Dundee City live in families in material deprivation* - this is the joint highest in Scotland *Material deprivation is defined as lacking 3 or more basic necessities (Source: Scottish Government: Children in families with limited resources across Scotland 2014-2016)
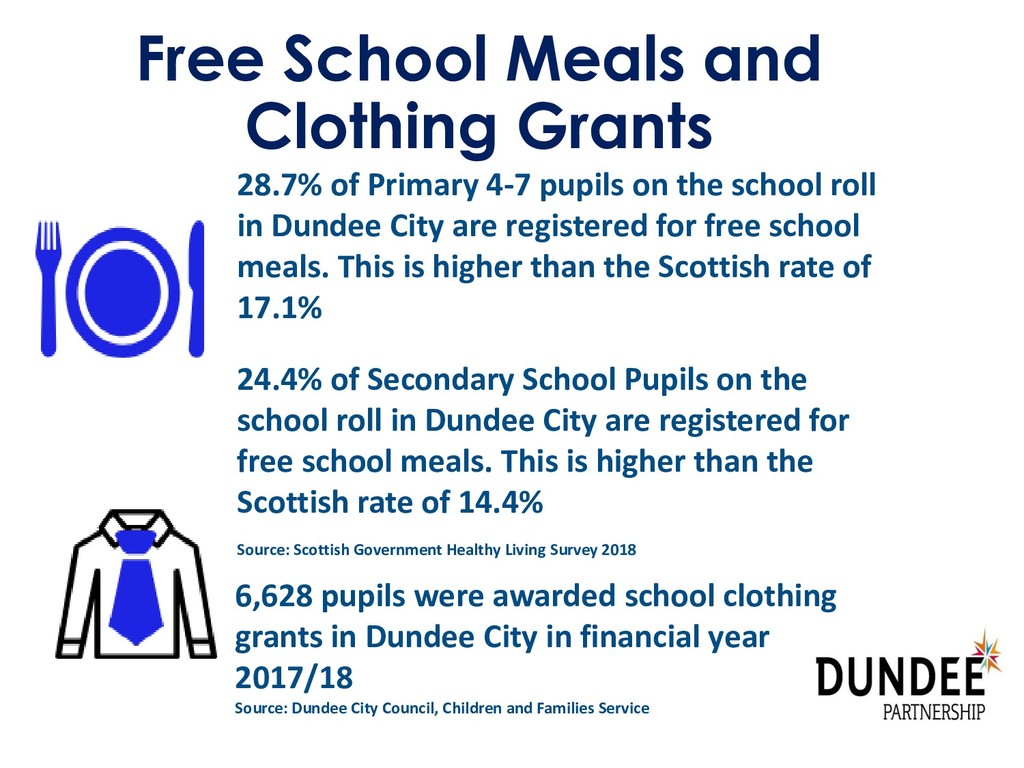
pupils on the school roll in Dundee City are registered for free school meals. This is higher than the Scottish rate of 17.1% 24.4% of Secondary School Pupils on the school roll in Dundee City are registered for free school meals. This is higher than the Scottish rate of 14.4% Source: Scottish Government Healthy Living Survey 2018 6,628 pupils were awarded school clothing grants in Dundee City in financial year 2017/18 Source: Dundee City Council, Children and Families Service
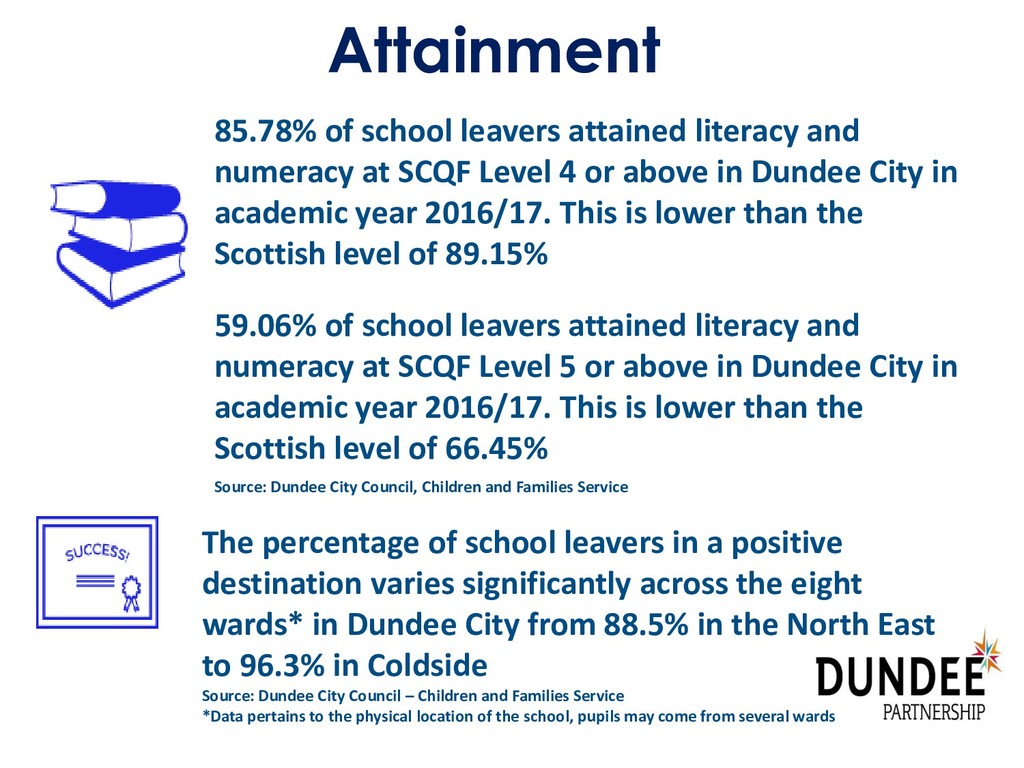
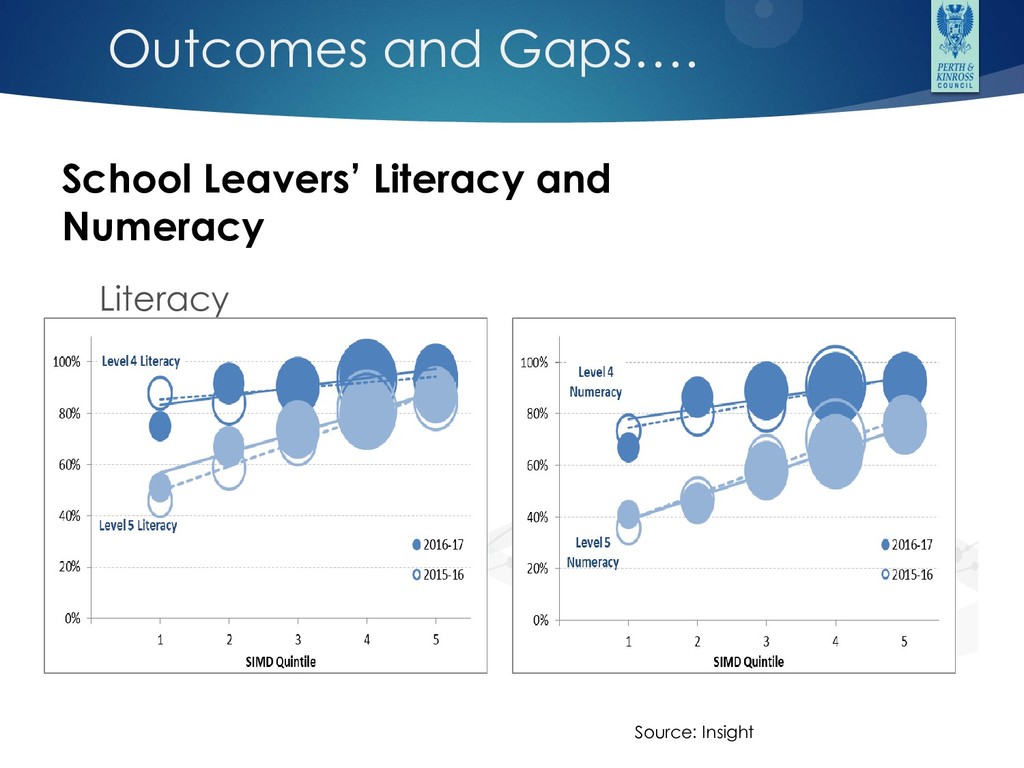
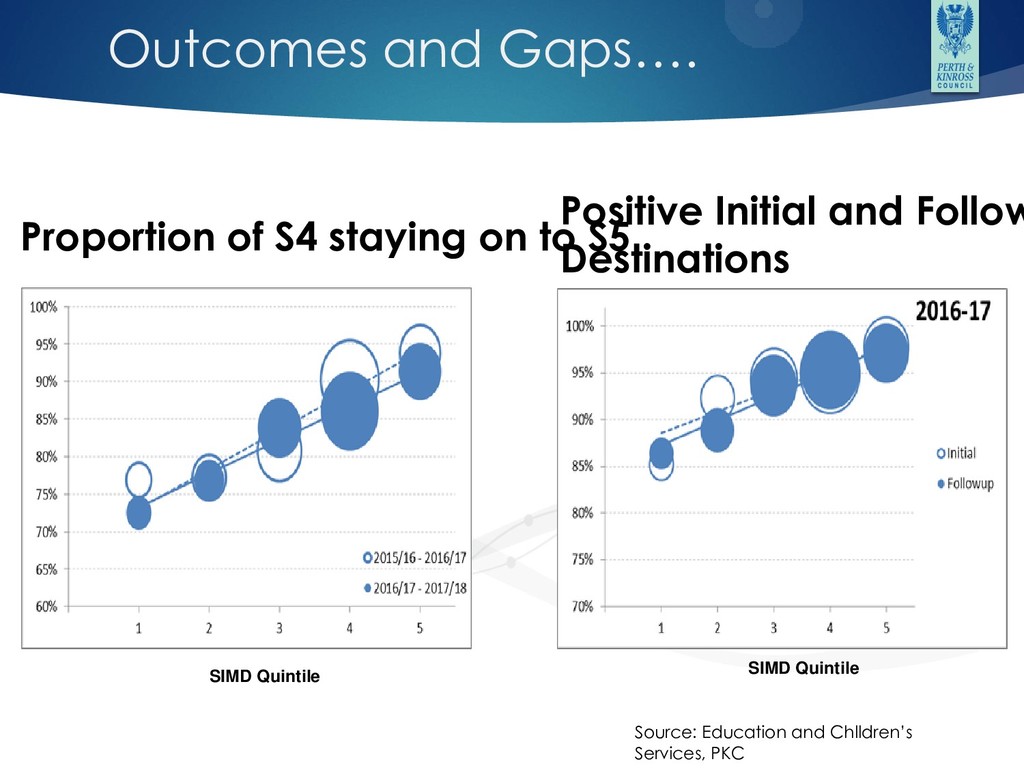
SCQF Level 4 or above in Dundee City in academic year 2016/17. This is lower than the Scottish level of 89.15% 59.06% of school leavers attained literacy and numeracy at SCQF Level 5 or above in Dundee City in academic year 2016/17. This is lower than the Scottish level of 66.45% Source: Dundee City Council, Children and Families Service The percentage of school leavers in a positive destination varies significantly across the eight wards* in Dundee City from 88.5% in the North East to 96.3% in Coldside Source: Dundee City Council – Children and Families Service *Data pertains to the physical location of the school, pupils may come from several wards
School Day (CoSD) is a Child Poverty Action Group (CPAG) in Scotland project. The project supports school and local authorities to ensure that all children, regardless of financial background are able to get the most out of the school day. The CoSD Dundee Project is funded by the Scottish Attainment Challenge Fund.
The School Day Dundee Report, Dundee City Council launched 4 Cost of the School Day Pledges on 26th October 2018. The pledges are: 1. No child or young person in Dundee will start school without a breakfast 2. No child in Dundee will miss out on their Primary 7 residential trip due to cost 3. All Schools will develop a Cost of The School Day action plan by end of session 2018/19 4. All children and young people in Dundee Schools will have access to an affordable school uniform
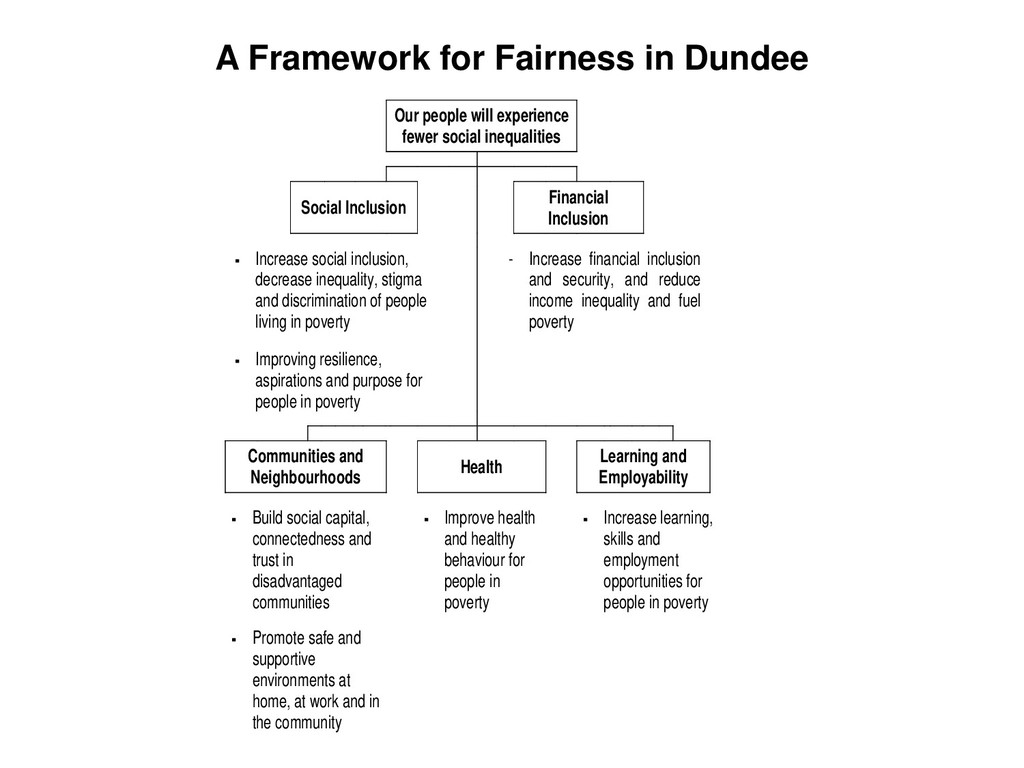
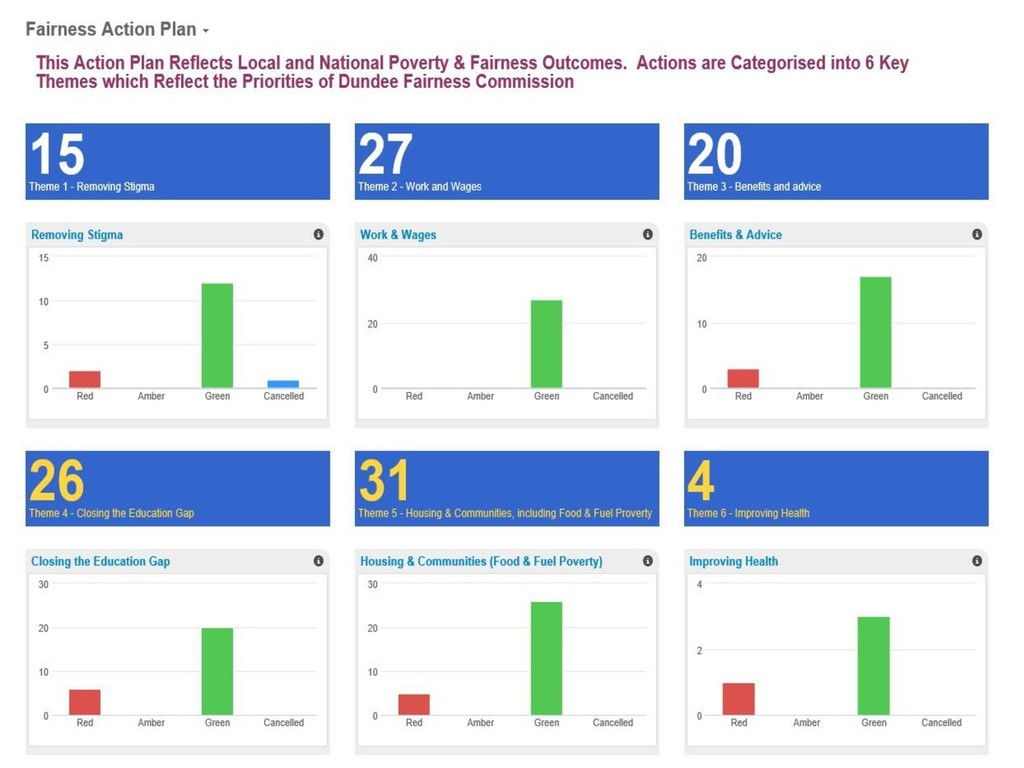
fewer social inequalities Social Inclusion Financial Inclusion - Increase social inclusion, decrease inequality, stigma and discrimination of people living in poverty - Improving resilience, aspirations and purpose for people in poverty - Increase financial inclusion and security, and reduce income inequality and fuel poverty Communities and Neighbourhoods Health Learning and Employability - Build social capital, connectedness and trust in disadvantaged communities - Improve health and healthy behaviour for people in poverty - Increase learning, skills and employment opportunities for people in poverty - Promote safe and supportive environments at home, at work and in the community
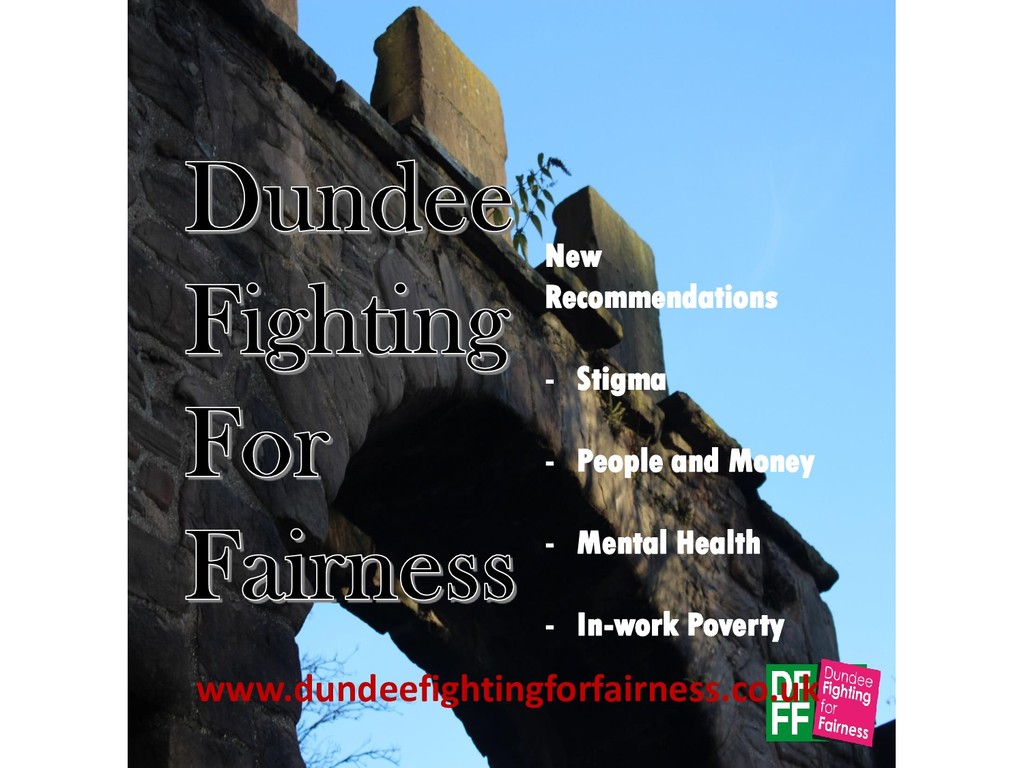
- Highlighting the Child Poverty drivers - Incorporating the Fighting for Fairness recs. - A final Fairness Commission - A new Fairness Leadership Panel
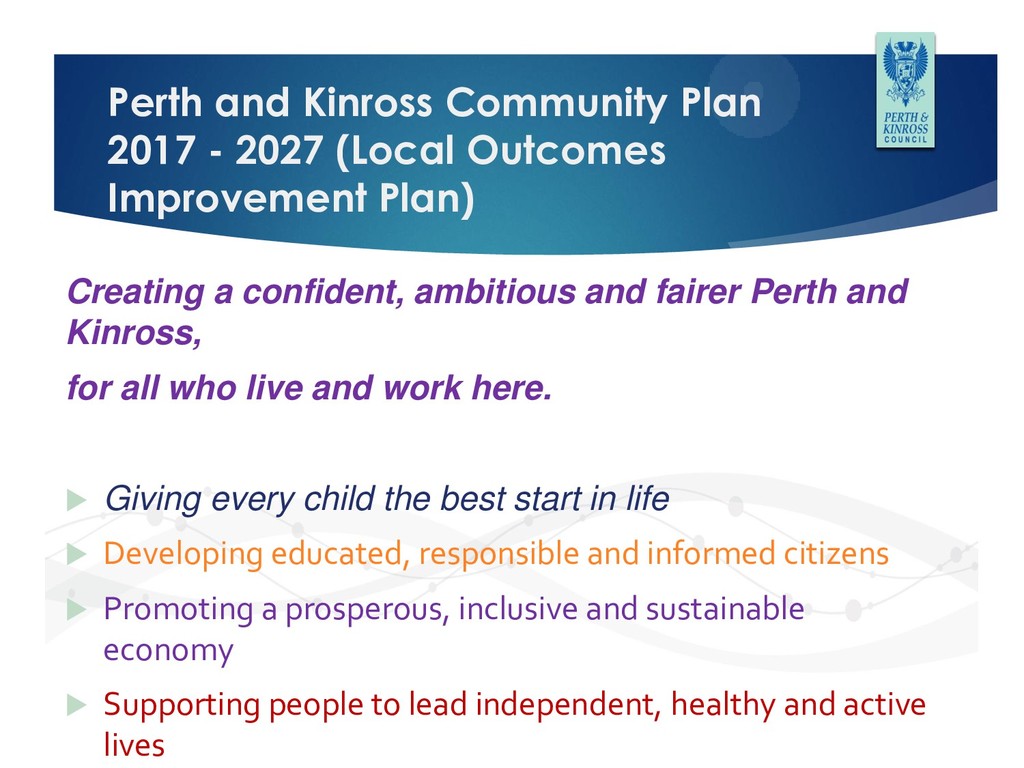
Improvement Plan) Creating a confident, ambitious and fairer Perth and Kinross, for all who live and work here. Giving every child the best start in life Developing educated, responsible and informed citizens Promoting a prosperous, inclusive and sustainable economy Supporting people to lead independent, healthy and active lives
Fairer Perth and Kinross: People, Place and Equality A Strong Start: An Equal Footing for Life- Chances, Choices and Confidence Fairer Working Lives: Opportunity, Security and Respect A Thriving Third Age: Living Well, Belonging and Contributing Better Connected: Services, Transport and Digital Lives
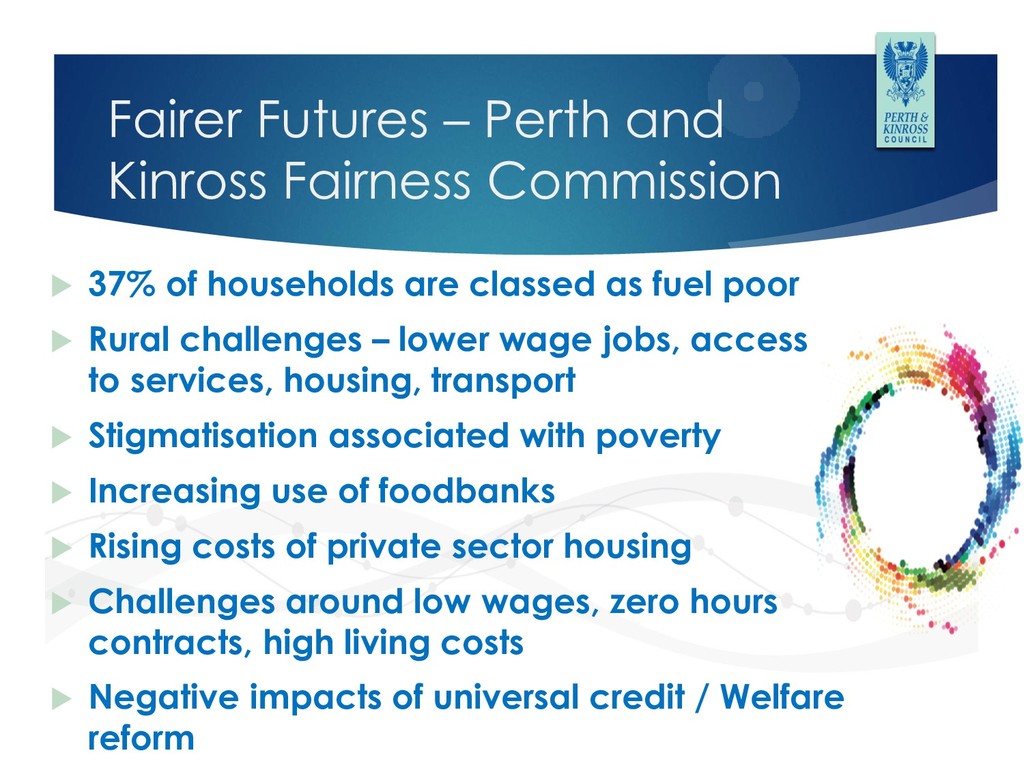
of households are classed as fuel poor Rural challenges – lower wage jobs, access to services, housing, transport Stigmatisation associated with poverty Increasing use of foodbanks Rising costs of private sector housing Challenges around low wages, zero hours contracts, high living costs Negative impacts of universal credit / Welfare reform
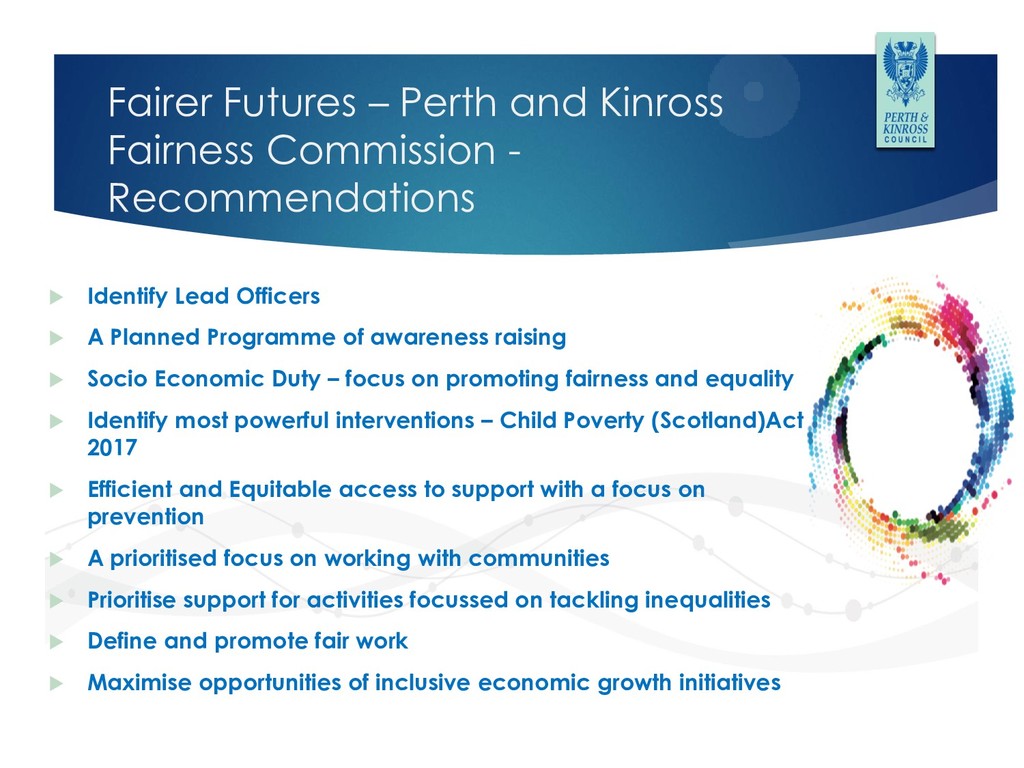
Identify Lead Officers A Planned Programme of awareness raising Socio Economic Duty – focus on promoting fairness and equality Identify most powerful interventions – Child Poverty (Scotland)Act 2017 Efficient and Equitable access to support with a focus on prevention A prioritised focus on working with communities Prioritise support for activities focussed on tackling inequalities Define and promote fair work Maximise opportunities of inclusive economic growth initiatives
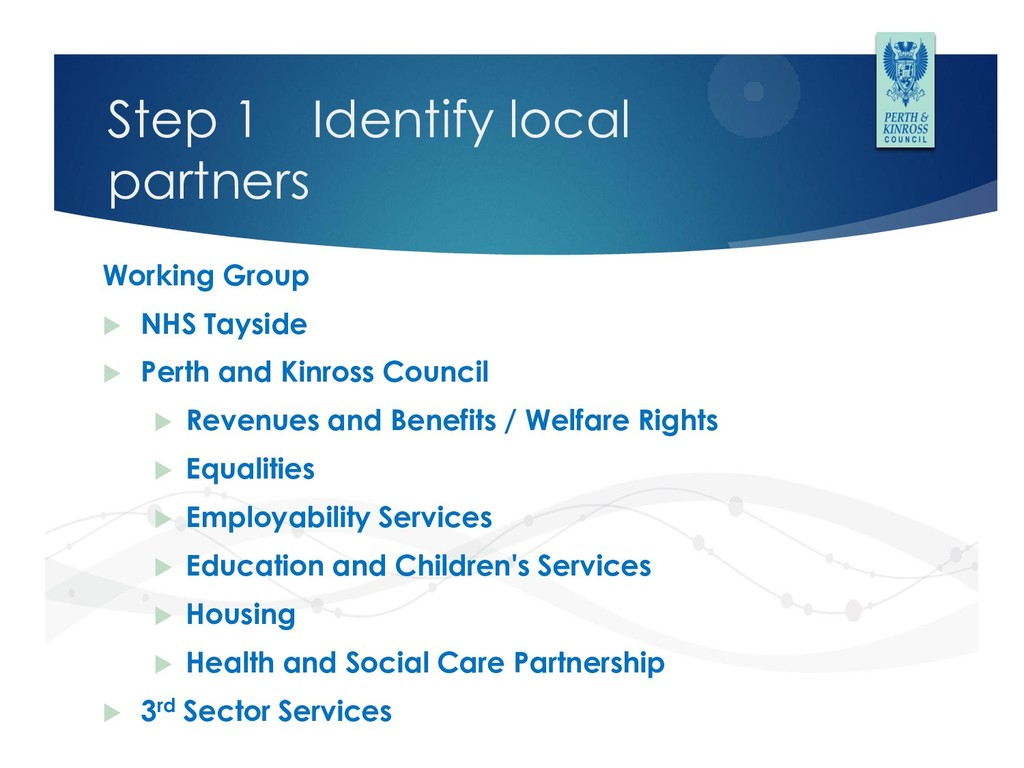
Perth and Kinross Council Revenues and Benefits / Welfare Rights Equalities Employability Services Education and Children's Services Housing Health and Social Care Partnership 3rd Sector Services
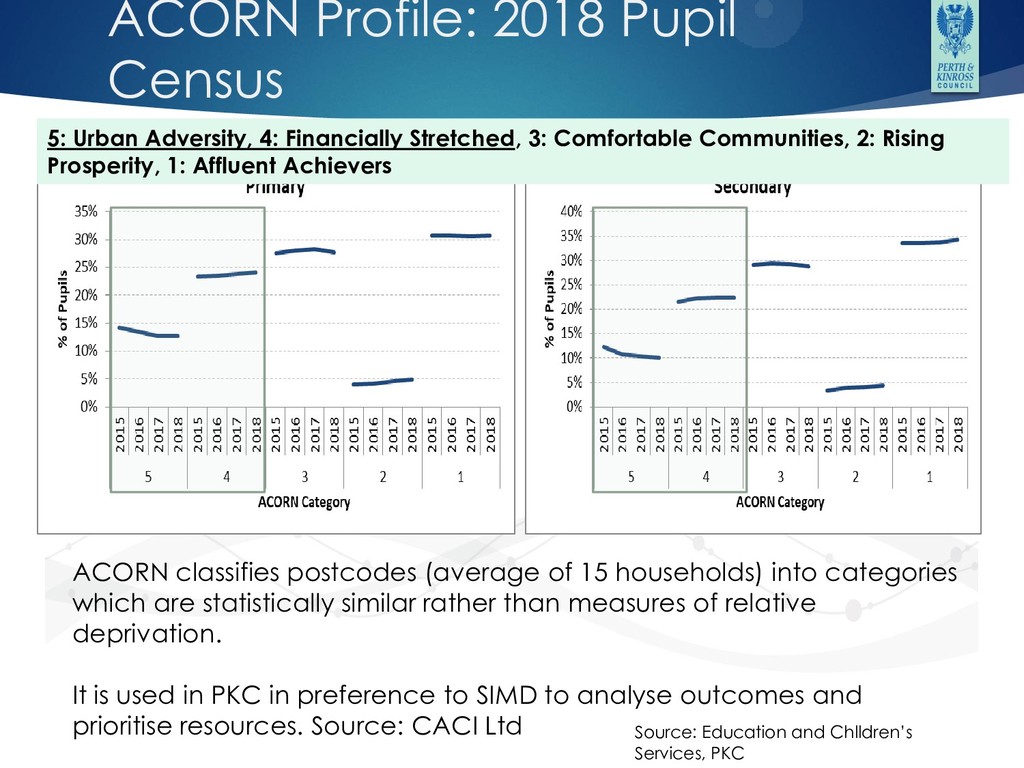
15 households) into categories which are statistically similar rather than measures of relative deprivation. It is used in PKC in preference to SIMD to analyse outcomes and prioritise resources. Source: CACI Ltd Source: Education and Chlldren’s Services, PKC 5: Urban Adversity, 4: Financially Stretched, 3: Comfortable Communities, 2: Rising Prosperity, 1: Affluent Achievers
P4-P7 pupils registered for Free School Meals Around 1 in 14 Secondary pupils registered for Free School Meals £1.67 Million Pupil Equity Fund (PEF) awarded to schools Source: Education and Chlldren’s Services, PKC
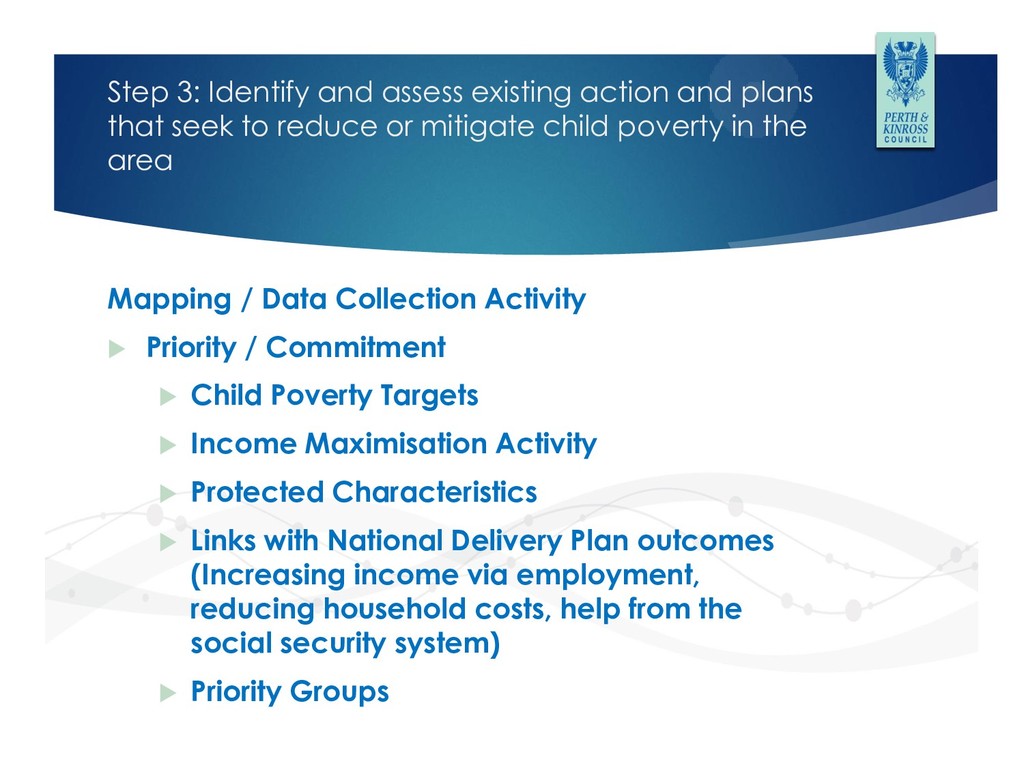
seek to reduce or mitigate child poverty in the area Mapping / Data Collection Activity Priority / Commitment Child Poverty Targets Income Maximisation Activity Protected Characteristics Links with National Delivery Plan outcomes (Increasing income via employment, reducing household costs, help from the social security system) Priority Groups
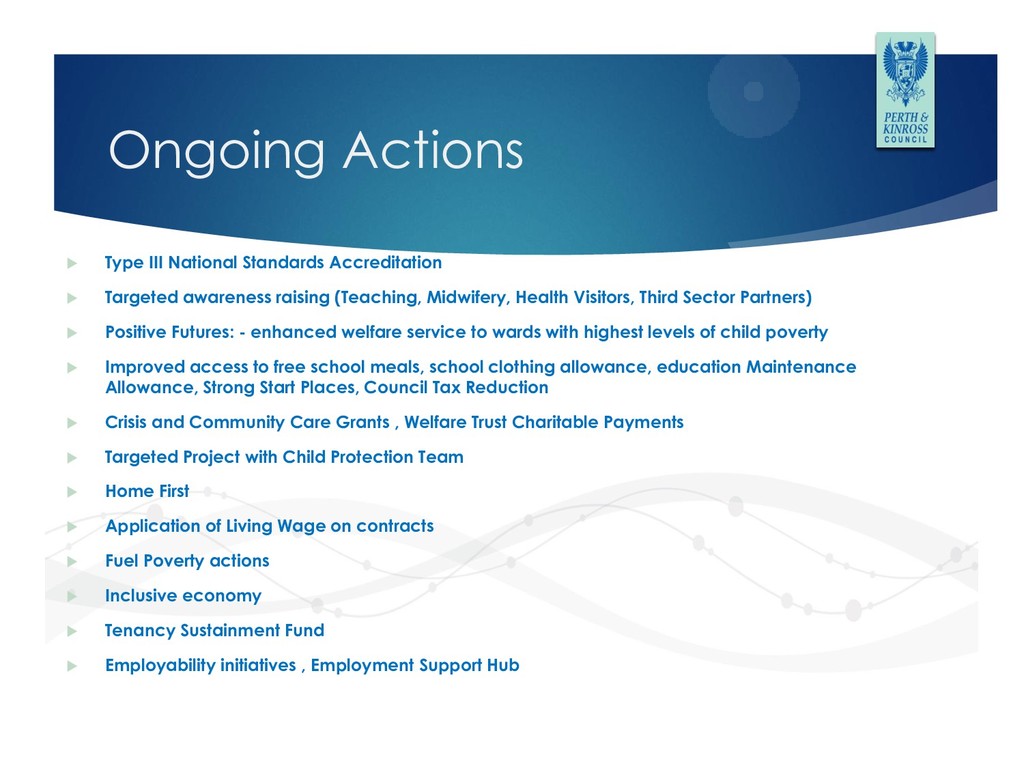
awareness raising (Teaching, Midwifery, Health Visitors, Third Sector Partners) Positive Futures: - enhanced welfare service to wards with highest levels of child poverty Improved access to free school meals, school clothing allowance, education Maintenance Allowance, Strong Start Places, Council Tax Reduction Crisis and Community Care Grants , Welfare Trust Charitable Payments Targeted Project with Child Protection Team Home First Application of Living Wage on contracts Fuel Poverty actions Inclusive economy Tenancy Sustainment Fund Employability initiatives , Employment Support Hub
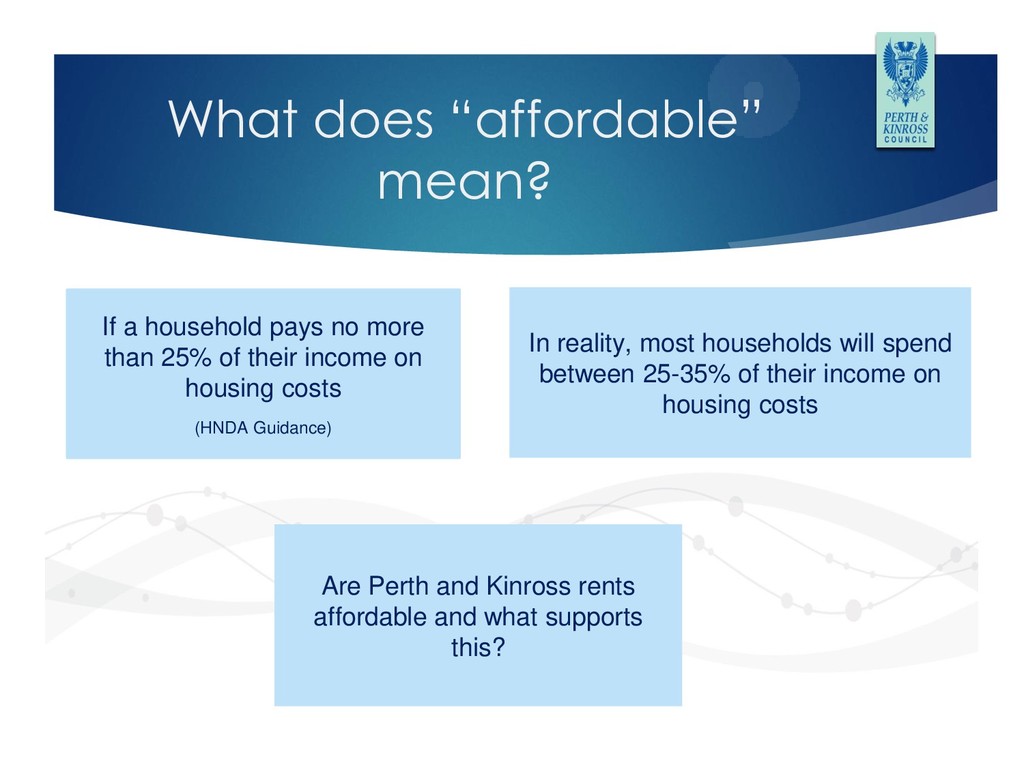
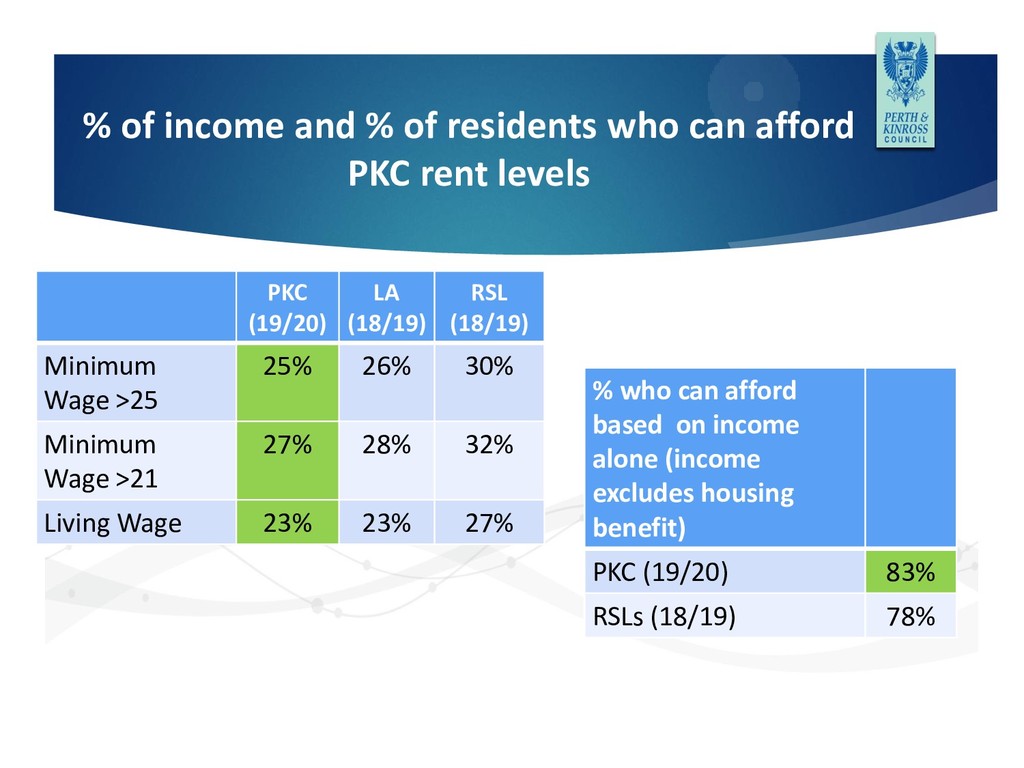
than 25% of their income on housing costs (HNDA Guidance) In reality, most households will spend between 25-35% of their income on housing costs Are Perth and Kinross rents affordable and what supports this?
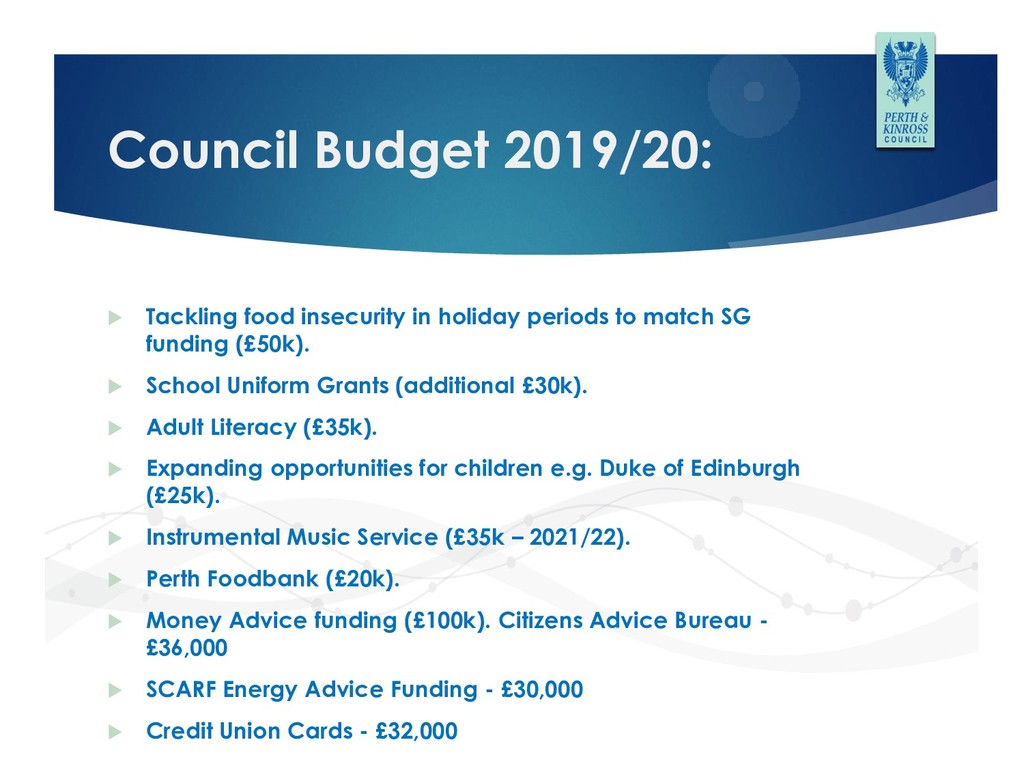
to match SG funding (£50k). School Uniform Grants (additional £30k). Adult Literacy (£35k). Expanding opportunities for children e.g. Duke of Edinburgh (£25k). Instrumental Music Service (£35k – 2021/22). Perth Foodbank (£20k). Money Advice funding (£100k). Citizens Advice Bureau - £36,000 SCARF Energy Advice Funding - £30,000 Credit Union Cards - £32,000
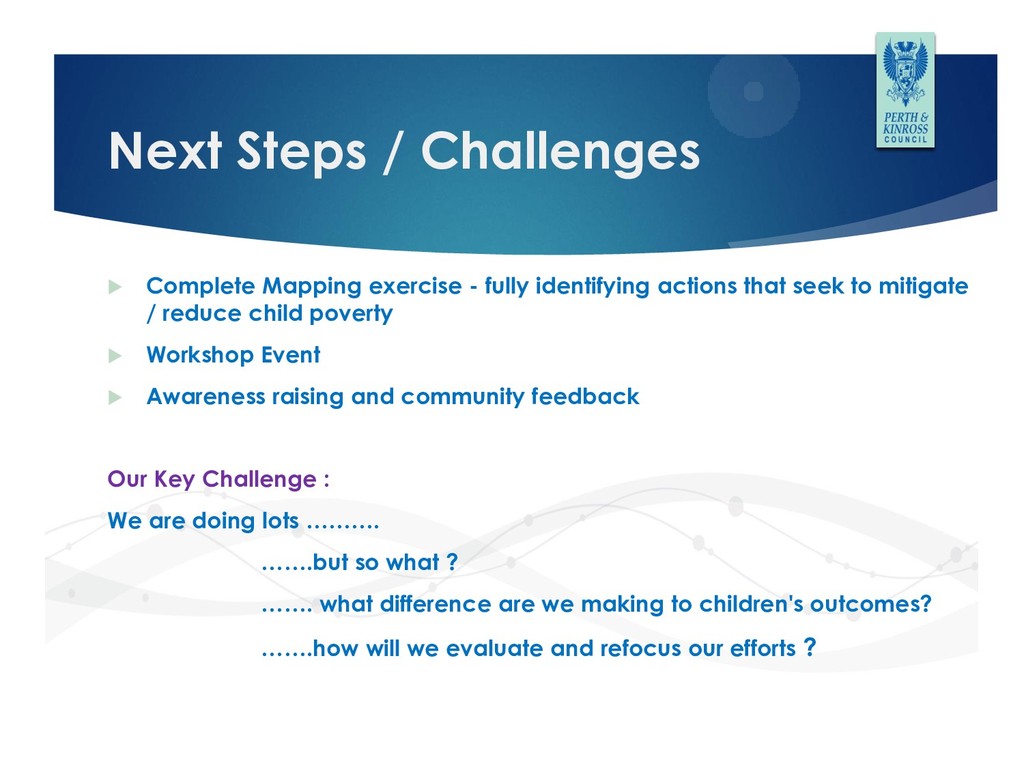
identifying actions that seek to mitigate / reduce child poverty Workshop Event Awareness raising and community feedback Our Key Challenge : We are doing lots ………. …….but so what ? ……. what difference are we making to children's outcomes? …….how will we evaluate and refocus our efforts ?
survey to collate any other activity and feedback https://www.surveymonkey.co.uk/r/ZT6WVWZ LA based activities will continue in order to develop Local Action Reports